

Background
Objectives
Main Objective
Hypothetical Model Properties
Election of Study Case
Data Collection
The Energy Simulations
Arquitecture and Climate in Galicia
Analysis of Current Status and Proposed Improvements
Improvement Proposals
Integrated Design for Energy-eficient Housing
Conclusions and Acknowledgments
Background
Energy consumption in buildings accounts for approximately one third of the EU energy consumption and CO² emissions, this is more than the consumption of industrial activity or transportation. Therefore, the rationalization of energy consumption in this sector has become a priority on the national and European energy policy, manifested by the appearance of specific regulations. Particularly noteworthy is The Spanish Strategy for Science and Technology, under the “Horizon 2020” of the EU, that states the challenge of producing safe, clean and efficient energy. In the case of existing buildings (in Spain there are 13 million homes most households amenable to be intervened, most of them from the years 1940-80, with nonexistent rules and scarce resources that difficult their intervention), energy rehabilitation works can bring savings of up to 75% in energy consumption, and a reduction in CO2 emissions of most of 34% with respect to 2001 (WWF, 2012).
Objectives
Main Objective
The objective of this research is the development and creation of an integrated system that allows simplify the process of data collection, analysis of the situation and application of energy-saving solutions to a building rehabilitation as much as possible.
The rehabilitation leads to the recuperation of the interior thermal comfort and the reduction of maintenance costs, with a return period of investment assumable. Each building is a unique case, with its particularities in geometry, composition and construction (Celis et al, 2012), as well as its occupation and use, typology, facilities and management. The availability of comprehensive, unified and consistent information is a key factor to do a proper diagnosis and optimal decision making.
Election of Study Case
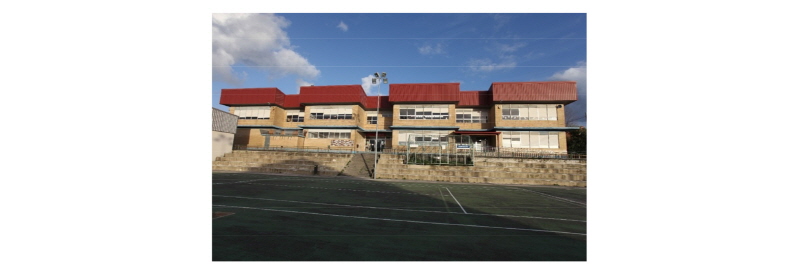
The study case is located in the south-western Galicia region. It has been chosen as a model for this investigation because in the 70’s there were a great expansion of the construction sector, which had to built many new schools, but with low climatic requirements. Once there were analyzed a number of existing typologies with the previous conditions, it was chosen an educational building located in the south-western Galician region. In the 70s it was experienced a big construction expansion that led to the construction of new schools across Spain but with low climatic requirements. This model has been replicated frequently throughout the national territory (in this area, the same school project was built 35 times), and the study of this unit will provide data to know other similar centers in the area. The study building is the childhood education center of San Roque Elementary in Cangas, Pontevedra, (1972), (Fig. 1)
|
Figure 1. Study case. San Roque Elementary school in Cangas, Pontevedra, Galicia, España. West facade. |
Data Collection
Regarding to geometry, the original drawings of the existing buildings aren't always available are not related with the constructed reality. For digital geometric modeling or 3D reconstruction, the laser scanners have an increasing acceptance, with specialist literature (Huber et al, 2011) pointing to its utility in the generation of 3D models BIM architecture.
Within the integrated system designed has been used a technology to acquire the geometry using a moving measuring device without GPS assistance, as the international reference research groups, such as the Video and Image Processing Lab, University of California Berkeley, and the Robotics Lab at the City College of New York, USA, has been developed. It has been also developed an unmanned aerial vehicles (UAV) model, with thermographic and geomatic sensors located in multi-rotor helicopters type (drones), which can fly at slower speeds and even maintain a fixed position (Fernández-Hernández et al, 2012).
BIM (Building Information Models) technology appears as the solution to compile all the information needed for the energy modeling process: 3D geometry, thermographic inspection and boundary environmental and technical conditions of the building (Lagüela et al, 2013; Vanlande et al, 2008). BIM does available to the energy inspector all the information and energy efficiency studies obtained of from the building (Raheem et al., 2011). The benefits from of this technology have been demonstrated by reducing costs and errors in the construction process, making a substantial improvement in the energy modeling of buildings (GSA, 2009) thanks to its large amount of data and faithful reproduction of constructed reality (Wang et al., 2011). However, advances in software on BIM and energy assessment takes focus on the early stages of life in the building: its design and endowment. Thus, the main commercial architectural design software tools offer BIM (© Autodesk, Bentley Systems ©, CYPE ©), but the energy assessment of as-built BIM is still under investigation.
The Energy Simulations
Within the integrated system that allows simplify the process of data collection, analysis of the situation and application of energy-saving solutions to a building rehabilitation as much as possible, this article will focus specially on energy simulations on the model of study and its connection with compliance with official regulations, (CTE, 2006) (Spanish Technical Building Code/Código Técnico de la Edificación).
Arquitecture and Climate in Galicia
The climate of the village where the school is located under study is a mild, regular and humid climate. Temperatures range between 5 and 17°C, in winter and 15 and 25°C in summer, with humidity all year between 70 and 95%.
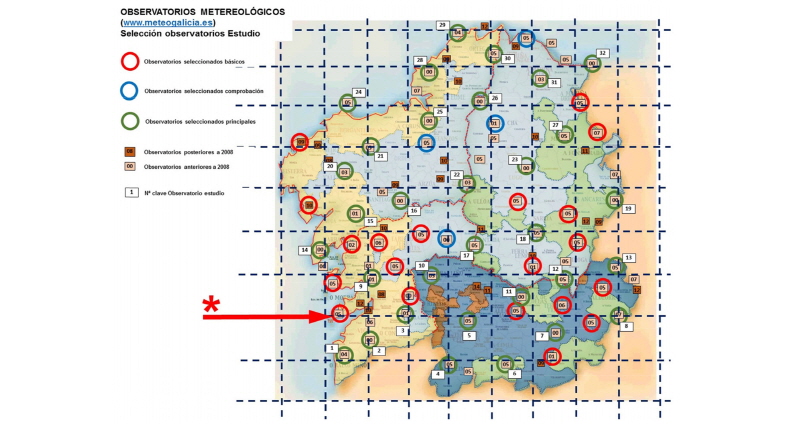
On the current regulation, the determination of climatic zones are given by the CTE, according to topographic height of each municipality, in the form of numerical table. It has developed a mapping with data versions CTE 2008 and 2013, with notable differences and several doubts regarding the correct climate distribution.
In this situation, it is very important for this research to obtain real climate data. Thus, the first step in the research is the realization of a new climate map of Galicia based of a proven methodology and set (da Casa, 2000), with the following phases:
・Consultation of weather information available through the official website of the autonomous community www.meteogalicia.es; all available stations with updated information are analyzed (fig. 2);
・There is established which weather stations are updated frequently, with no more than ten years in between;
・Monthly data of maximum and minimum temperatures, average data of maximum and minimum temperatures and relative data humidities are collected;
・The data are applied to Givoni diagram and bioclimatic strategies are established monthly;
・All the data obtained are arranged in a map and doubted zones are identified, data are analized even if the data are less than ten years, completing monthly distributions;
・Ultimately, there are obtained a map of monthly strategies, analyzed and verified the existence of potential clusters of great similarity, establishing zones with common data.
With the mapping created, it is possible to establish the policy needs on each of the selected schools (35), with the same characteristics of the study case.
Analysis of Current Status and Proposed Improvements
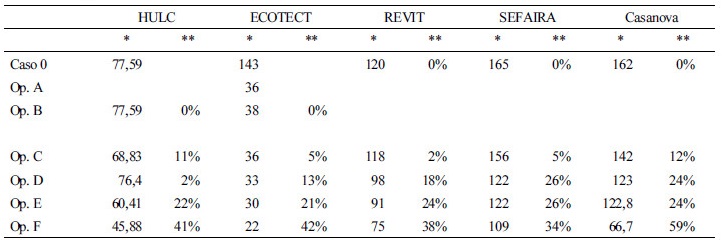
As already mentioned in this article has focused attention on the comparison of results between different simulation tools. To analyze the current status and proposed improvements of the building will be used several computer simulations tools:
・HULC: (Herramienta Unificada LIDER CALENER -Unified Tool LIDER-CALENER). It is the official tool provided by the CTE in Spain for energy assessment of buildings. Last version 26/07/2016. (view of results on fig, 5);
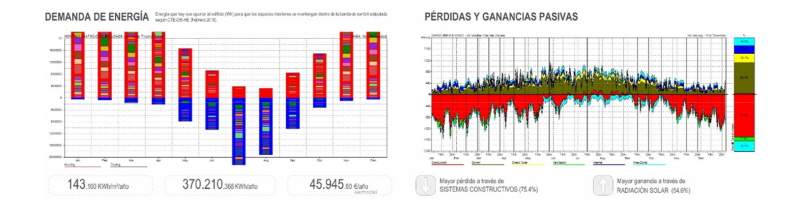
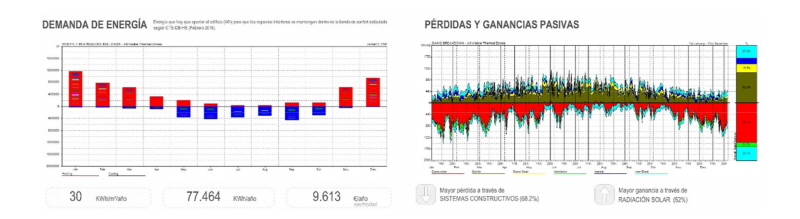
・ECOTECT: One of the best simulation tools. It is currently unavailable because it is no longer provided by AUTODESK. (fig. 3, 4);
・REVIT: It’s the BIM of AUTODESK suite, and allows to obtain direct 3D image from the robotic entries and is associated with ENERGY PLUS engine analysis;
・CASANOVA: It is a free software. Very accessible and intuitive, It has operative limitations and data input;
・SEFAIRA: It is a plugging for SKETCHUP. It has now been bought by the owner of SKETCHUP, ISCAR. Easy to shape but very simple.
Not all the computer simulations tools allows to use the same starting parameters. In some cases (REVIT, CASANOVA and SEFAIRA), there are not taken into consideration the hours of daily or monthly activity. In other cases, is not possible to use the real thermal data of the enclosures (it is only possible with ECOTECT) because they are much lower than the software admitted.
There are established three starting points:
・Case 0: No timetables or schedules of use are applied. External walls data correspond to the CTE. It can be applied to all analysis tools used in this research;
・Case A: Applying schedules and calendars. Using actual data of transmittance obtained “in situ” with measurement devices. It is only applicable with ECOTECT;
・Case B: Same as Case A, but introducing building materials data from the CTE database. It is applicable with HULC and ECOTECT.
Improvement Proposals
The simulations made with the different tools can be seen as requirements are isolation and uptake of radiation. They are used the same premises to discuss the results with all the tools, based on constructive solutions verified by the CTE. Three changes have been proposed but it would be possible to extend the application to many other combinations, using the speed of the simulation analysis:
・Option C: application of a new 15 cm insulation inside the facades is proposed;
・Option D: application of a new 15 cm insulation on the roof/deck is proposed;
・Option E: replacing existing windows by others with thermal break and double low emissivity glazed is proposed;
・Option F: It is the sum of all previous proposals (option C+ option D+ option E).
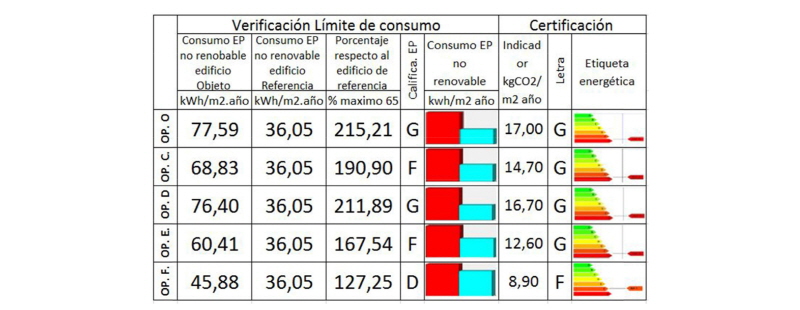
Studying the summary table of results (table 1) can be seen that in general, there are further reductions in consumption with constructive solutions applied to the roof or windows (around 20% each), that the reform of the facades (around 7%).
With the study of the necessary costs for each case it can be stablish an investment plan based in the energy savings, the compatibility of use with the activity and the investment plan of the building’s owner.
Integrated Design for Energy-eficient Housing
In addition to improve the energy efficiency of the building, according with the theories of integrated design, the other objective of the research is to get the most effective way to find the best solutions in building energy efficiency. This strategy aims to promote a more sustainable architecture through early multidisciplinary collaboration, achieving reductions of up to 80% of operating costs (Miotto et al, 2012).
・The integrated design includes among others the following features:
・Motivation of participants;
・Prior establishment of measurable goals and project requirements;
・Holistic Business vision with extensive information: site, climate, use, culture, materials, systems;
・Internal coordination of the team work, establishing the direction and aids.
・Multidisciplinary team covering all trades that, in one way or another, are involved;
・Evaluations and simulations of the prototypes from the first sketch in order to take focus on the better solution.
Conclusions and Acknowledgments
The following conclusions have been obtained:
・Using the same parameters, there are obtained very different answers depending on the analysis tool used. The differences are both in absolute values and in the type of results that can be obtained.
・There are many differences in each tool or system between the form to input the data and the response received, and in the time spent entering data and the calculation process of the application itself.
・However, as can be seen despite the dispersion of absolute values, the relative values are similar improvement in the tools where these constructive solutions are applied.
・Once the system model is implemented it is very easy to propose a wide range of combinations of improvements over the model.
The procedure suggested for improving the conditions of energy consumption of buildings is, in the first instance, the usage of easier operation tools that can even support the direct import of 3D models from laser scanning tools within the integrated system proposed in this research.
Subsequently, and once channeled the energy solution, it will require a specific modeling using the official simulation tool “HULC”, since this introduces data numerically, without modeled complex.
Alongside these simulations the study of the most efficient facilities also arises to improve overall performance and includes calculating the relative cost of each.
The development of this research is conducted within the project “ENE2013-48015-C3-2R” (Integrated system for energy optimization and reduction of building CO² footprint: BIM, indoor mapping and advanced energy technologies UAVs simulation tools) funded by the Ministry of Economy and Competitiveness and executed by the Geotechnologies group applied - University of Vigo, the Technology group information for scanning and 3D modeling in engineering and architecture - University of Salamanca and the Intervention group in the heritage and sustainable architecture - University of Alcala.
