

Introduction
Noise Influence in Human Being
Noise Map Elaboration
Results
Actual Scenario
Noise Evaluation After Tunnel
Conclusion
Introduction
Niterói is a medium size city in the neighbourhood of Rio de Janeiro and an important mobility project is being executed to connect the oceanic area to its harbour hub at Charitas District. The proposed mobility system uses exclusive lanes for buses in parallel to a bike lane. It is intended to allow a faster displacement from oceanic region neighbourhood to the Charitas District, where an intermodal connection is available. In order to reduce urban mobility problems at this region, a new tunnel is being constructed to transpose the Preventório Mountain, located between these two urban areas (Aleixo, 2014).
Although Niterói City has been founded in 1573, the first important housing development at the oceanic region, Vale Feliz, was only established in 1946, with the subdivision of the first glebe of Engenho do Mato Farm, one of the biggest sugar producer area. However, only after the Presidente Costa e Silva Bridge inauguration, in 1974, connecting directly Niterói and Rio de Janeiro cities, this area was effectively occupied. In the early 80's, the “Oceanic Region Specials Housing Developments” were created, constituted by high level houses, in horizontal condominiums and they were the cause of the large population growth rate at that time. Nowadays, the region is basically a residential area. The local commerce is intended to support its inhabitants and is established majorly along the main roads, from where people arrive at the region (NiteróiTV, 2013).
The oceanic region is composed by eleven districts, with nearly 69,000 inhabitants living in about 22,000 houses (IBGE, 2010). While population growth rate of Niterói City was 6% between 2000 and 2010, the growth in this area was 23% during the same period. Despite this high rate, the region has a high population potential growth, because it is constituted basically by houses and there is a low rate of inhabitants per km2, when compared to the average city amount (Couto, Audiência pública do corredor viário transoceânica. , 2014).
The Niterói downtown area concentrates the main commerce, hospitals and the main ferryboat station, where 100,000 people travel from and to Rio de Janeiro every day. It is important to notice that a third of Niterói City population works out of the city and Rio de Janeiro is the main attractive pole (Aleixo, 2014).
Surrounded by mountains, there are few road options to move from the oceanic region to downtown and to the Rio the Janeiro City - the State capital. It ought to be done by the two main roads with winding route through the mountain. This new mobility project provides an alternative way to connect Rio de Janeiro to Niterói downtown and reduces from 14 km to 1.2 km the path from Cafubá to Charitas District.
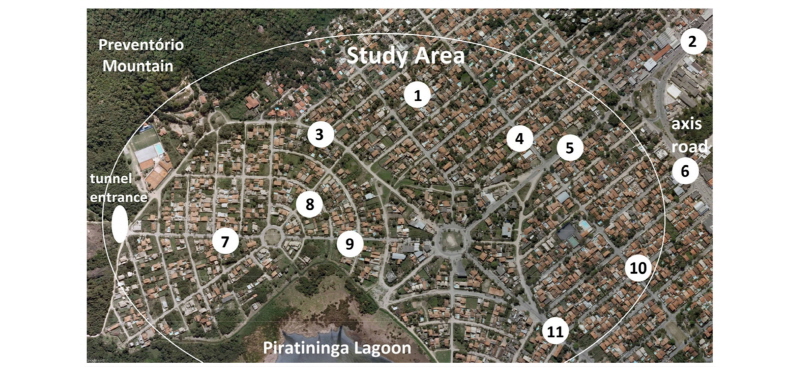
The tunnel entrance starts at Cafubá District, near the Piratininga Lagoon, as shown in Figure 1. The design predicts streets enlargement to allow an exclusive lane for buses and two lanes for others vehicles, with a traffic estimative of 12,000 vehicles per day. After the interventions, an exclusive residential area will receive practically all the vehicle flow from the oceanic region, impacting on the family lives which have chosen this area mainly due to quiet environment, nature proximity and welfare.
The case study area is located in Cafubá District, between Piratininga Lagoon and Preventório Mountain, as can be seen in Figure 1. This residential area is near to the local beaches and far enough from the main traffic axis: Francisco da Cruz Nunes Road. Only their main streets are paved, but they are narrow and they do not allow three cars side by side. The local streets are not yet paved, which contributes to a low noise profile due to the smooth pavement characteristics and low speed traffic. Added to the prevailing silence, there is a living fauna along the street trees, including birdsongs and tamarin monkey presence.
This research goal is to analyze the actual acoustic scenario and compare it to a future one, described by the mobility project, after the interventions have been concluded.
Noise Influence in Human Being
The human hearing system is able to perceive pressure stimuli between 0.00002 and 60 Pa. This extremely large range is better represented using a logarithmic scale, which matches with the human being sensitive response (Fletcher & Munson, 1933). The Sound Pressure Level (SPL) caused by pressure variation can be obtained as
 ,
,where p is the sound pressure and p0 is the reference pressure (0.00002 Pa).
The human ear perceives in different ways a stimuli caused from a sound wave, according to its frequency, even with the same SPL. In order to consider such influence on the measurements, the Brazilian and the international standards apply specific weighting curves to correlate the measured SPL with the hearing excitation, according to the sound pressure levels (ISO 226, 2003)
There are many health impacts caused by high noise level exposition, such as memory loss, irritation, cognitive dysfunction, hypertension and temporary or definitive hearing loss (Fiocruz, 2015). The sound level equivalent to 65 dB(A) is considered by the preventive medicine as the highest level that people can be exposed, continuously, without any health damage (Belojevic & Jakovlevic, 1997).
The health costs to mitigate damage caused by high sound pressure exposure are very large. The Europe Union spent in 2008 between 0.3% and 0.4% of its gross national product (GNP), which means about 12.5 trillion of Euros. Japan spent 0.2% of its GNP. To minimize these damages and consequently its repair costs it is necessary an adequate legislation and an active government policy. Despite the different acoustic criteria to evaluate the noise impacts, noise level has been reduced in Europe as a consequence of its committed policy (Arana, 2010) (Schwela, Finegold, & Gjestland, 2014).
The legislation has to be objective and adequate to affectively reduce the noise pollution. It is an interdisciplinary problem, involving new and quitter technologies on engines construction, new materials for paving, green absorptive facades, city morphology layout (height, shape and location of buildings), existence and location of urban voids, as squares and parks, and location of roads and acoustic barriers. All these factors contribute to reduce the urban noise, once properly combined (Guedes et al. 2011).
Brazilian legislation about noise in communities has as main reference the 10151 NBR standard (ABNT, 2000). This norm was adopted as federal legislation by the National Council of Environment, in 1990, named CONAMA Resolution n. 01 (CONAMA, 1990). This law defines noise pollution as an environment pollution.
Noise Map Elaboration
To evaluate the noise pollution in the Niterói area, a noise map was build using a computer model and in situ measurements. At first, a satellite photo was obtained from Google Earth PRO application and inserted in CadnaA application (Datakustik, 2016). The acoustical model was created by adding the main area characteristics, such as road pavements, vehicle flows, building heights and green areas.
For model calibration and validation, noise measurements were carried out in eleven points, following the 10151 NBR specifications (ABNT, 2000). A class 2 sound level meter was calibrated and adjusted to type A weight curve (dB A), recording a SPL sample every 30 seconds, during at least 20 minutes in each location. Vehicle traffic was filmed during 10 minutes at least, simultaneously with the sound level measurement. The traffic flow was divided in light, heavy and motorcycles. The motorcycles are not considered by the RLS 90 standard (available at the software) to calculate the road acoustic power and therefore they were added as light vehicles.
The proximity to noisy sources, such as schools, dogs and civil constructions, were avoid to reflect the statistical behavior of the map and not specific location characteristics. Although this care, the noise from working machines was observed during the measurements, due to drainage and paving services already in progress. Some streets were blocked by constructions and the traffic flow on these streets may be different than usual traffic. Nevertheless, it was perceived a high traffic of heavy vehicles involved in the constructions.
All measurements were carried out on day time. For simulation and map elaboration, the day period was divide in three: Day (from 10 am to 5 pm), Night (10 pm to 6 am) and Peak (6 am to 9 am and 5 pm to 8 pm). Vehicle flow per hour was extrapolated to all day period applying values measured by the author on the curves obtained from Traffic Engineering Handbook (Brasil, 2006) and adapted according to the area traffic characteristics observations. It is important to notice that the simulator implements European standards and considers European vehicles and pavements. Most of streets had land/sand as pavement, but this option is not available at the European standard, for instance. Therefore, some differences between measured and simulated values are expected and can be observed in Table 1, for the locations enumerated in Figure 1.
Table 1. Acoustic model validation: Measured and Simulated Pressure Levels in dB (A). Source: Author |
|
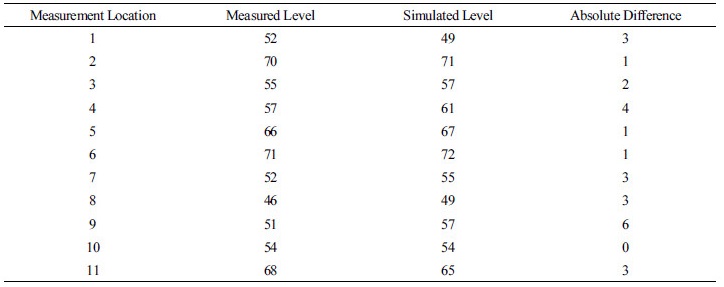
The level differences presented in Table 1 are due to several measurements uncertainties, such as traffic data extrapolation and road characteristics, that could not be precisely modelled in the simulator. Nevertheless, the levels are quite similar, with average error of 2,5 dB and standard deviation of 1,7 dB. The highest deviation occurred at locations 4 and 9 where the construction noise could not be avoided during the measurements. Therefore, it is expected that the noise maps generated are representative of the actual scenario.
Based on this scenario, a new model was created to predict the acoustic behavior of the urban area after the mobility interventions. The new model was developed by changing some characteristics of actual model, such as vehicle flow, streets geometry and pavements, according to the mobility plan provided by the municipality.
Results
Four noise maps were produced for the actual and future scenarios: Day, Peak, Night and 24 h (all day average) maps. The Peak maps present the worst traffic case, with the highest noise levels. The 24 h maps show an overview of average level along all day period.
Actual Scenario
Table 1 presents very low noise levels for most locations, which confirms the quietness of the area and expected characteristic of an urban area predominantly residential. The maximum allowed levels, according to the NBR 10151 standard, are exceed only at locations 2, 5 and 11, which are mixed residential and commercial areas, whose measurements were done at the main traffic roads.
Figure 2 presents the Peak noise map for the actual scenario and it can be observed that the standards limits are already exceeded in several areas. The standard limit to the mixed and commercial areas is 60 dB(A), but along the Francisco da Cruz Nunes Road, the noise level is higher than 75 dB(A) in the noise map. On Paulo de Melo Kale Avenue (point 5) and on Raul de Oliveira Rodrigues Avenue (Point 11) the standard limits were also exceed. Noise map shows more than 65 dB(A) and even 70 dB(A) on some stretches of theses avenues.
For the remaining streets, the standard limit is 50 dB(A), due to the residential land use. At Valdir Costa Street (points 7 and 9) more than 60 dB(A) was obtained. At Raul de Oliveira Rodrigues Avenue (point 3), despite the fact the limit was exceeded, this street has been extremely used by construction vehicles, as observed during measurement procedures.
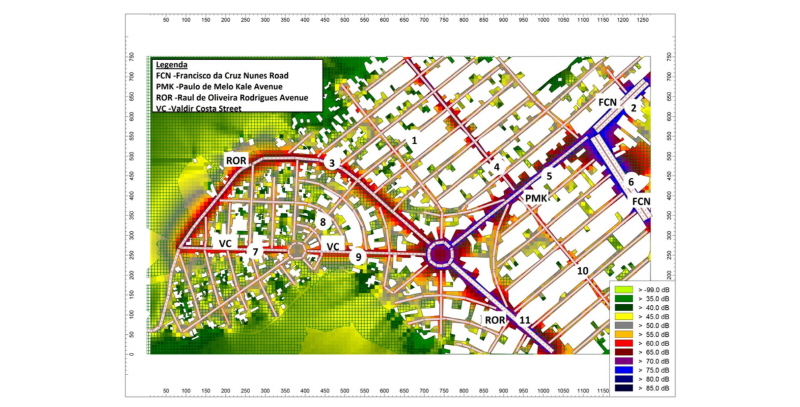
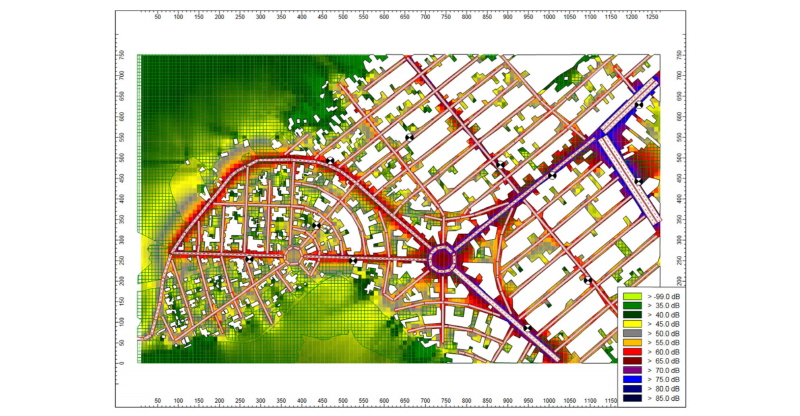
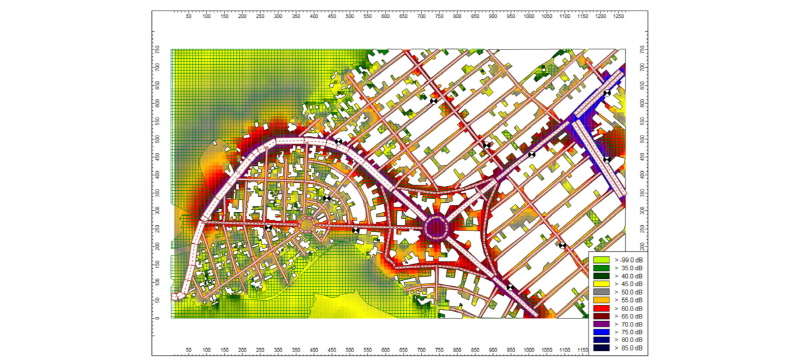
Figure 3 presents the 24 h noise map, where no significant changes were observed. It means that the traffic flows at the peak hours do not interfere in the area noise. This is because the main flow does not pass through the district along all day period, even during the peak hours.
Noise Evaluation After Tunnel
Figure 4 presents the noise map for the Peak period of the future scenario. The new traffic flow is higher than before the tunnel construction and a worse noise situation is predicted. It can be observed a level increase around the main streets which will receive most of the new traffic flow. On the other hand, the local streets, far from the main roads, are not significantly affected by noise level increase. Although it is not guaranteed, since part of the main traffic flow may find alternative ways through such streets to avoid occasional traffic jams. In this case, higher noise levels will be reached in the residential streets.
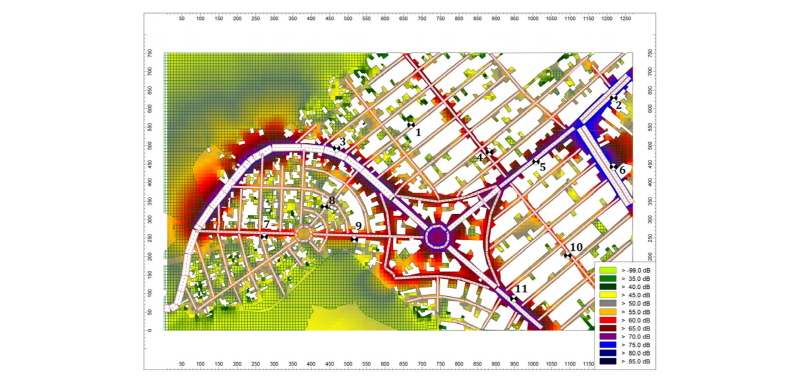
Figure 5 presents the 24 h map for the new scenario. Comparing figures 4 and 5 it can be stated that the Peak hours make difference in the area noise characteristics. At the peak hours, there were found higher levels than the average along the day.
When the actual and the new scenarios are compared, by contrasting figures 3 and 5, the level increase along the main streets and in some areas around is clear. Even the forest area is affected by the noise emitted along the main street which gives access to the new tunnel. Therefore, by such level analysis we conclude that the noise level increase due to the new mobility system will, at least, reduce the acoustic comfort in the area.
From the new scenario analysis, it is clear that people who live in the left side of the map will be submitted to a higher pressure level than they used to, exceeding the standard levels recommendation. It can also be observed the noise impact over the forest, which, probably would affect the fauna.
Noise levels exceeding the law thresholds require state intervention to prevent people from being exposed to unhealthy situations. The cost of such interventions after the construction finish is higher than the costs with prevention and intervention during the constructions.
Several measures might be taken before and during the constructions to avoid, or at least mitigate, the noise levels increase promoted by new mobility layouts. The pavements material, vehicle velocities and trees planting along the road are just a few good alternatives to achieve the intended noise level thresholds.
Conclusion
In this work, a comparison between actual and future mobility scenarios was performed. It has been shown that the mobility plan may affect the area by increasing the noise levels, especially along the main streets. This causes, besides the health problems, housing depreciation and important social and economical changes in the area, whose vocation was to be predominately residential.
It was also observed that the main roads on the study area are already exceeding the standard limits. The interventions with no acoustic study will increase the noise level on some streets and will bring it into all a strict residential area.
The use of noise simulation tools, together with an accurate analysis of the traffic flow for new mobility plans and urban planning directives, allows to analyse the acoustical behaviour of urban areas and to evaluate their adequacy to the limits imposed by the laws.
Therefore, this and several other works contribute to alert and to demonstrate to the urban planning authorities the importance of a noise impact study as a tool to help saving costs and to provide more comfort to the dwellers when a mobility issue is being addressed.
