Introduction
Study methodology
Case-study buildings description
Field survey through questionnaire
Data collection through instruments
Analysis
Thermal comfort parameters
Temperature
Relative humidity
Clothing
Adaptive means of control
Comfort votes
Correlation between the collected data
Results and discussion
Determining thermal neutrality and comfort range
Indoor temperature as a function of outdoor temperature
Discussion
Conclusion
Future scope
Appendix I
Survey Questionnaire
Introduction
The users of an indoor environment are said to be in a state of thermal comfort when they are physically and mentally satisfied [1, 2]. A building is designed to provide a comfortable indoor environment using climatically conscious design and with the appropriate choice of building materials, and such an evaluation is done for occupants’ thermal comfort. It has been shown that warmer or colder indoor temperatures beyond a certain range ensure thermal discomfort, which in turn decreases the productivity and mental acuity of the occupants [3, 4, 5]. Considering that almost one-fourth of every day of the most productive years of their lives are spent in classrooms [6], it is particularly important to provide a comfortable indoor environment for students of educational institutions to aid learning.
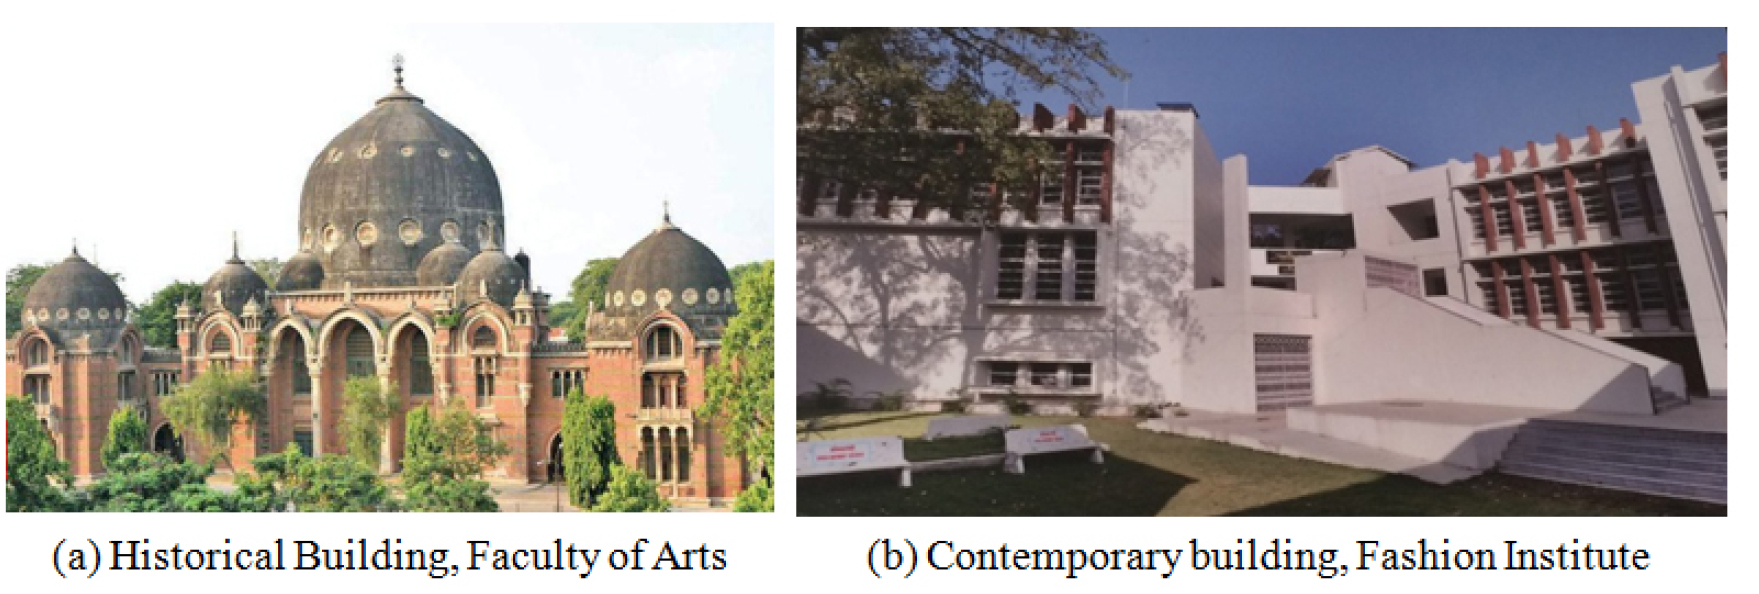
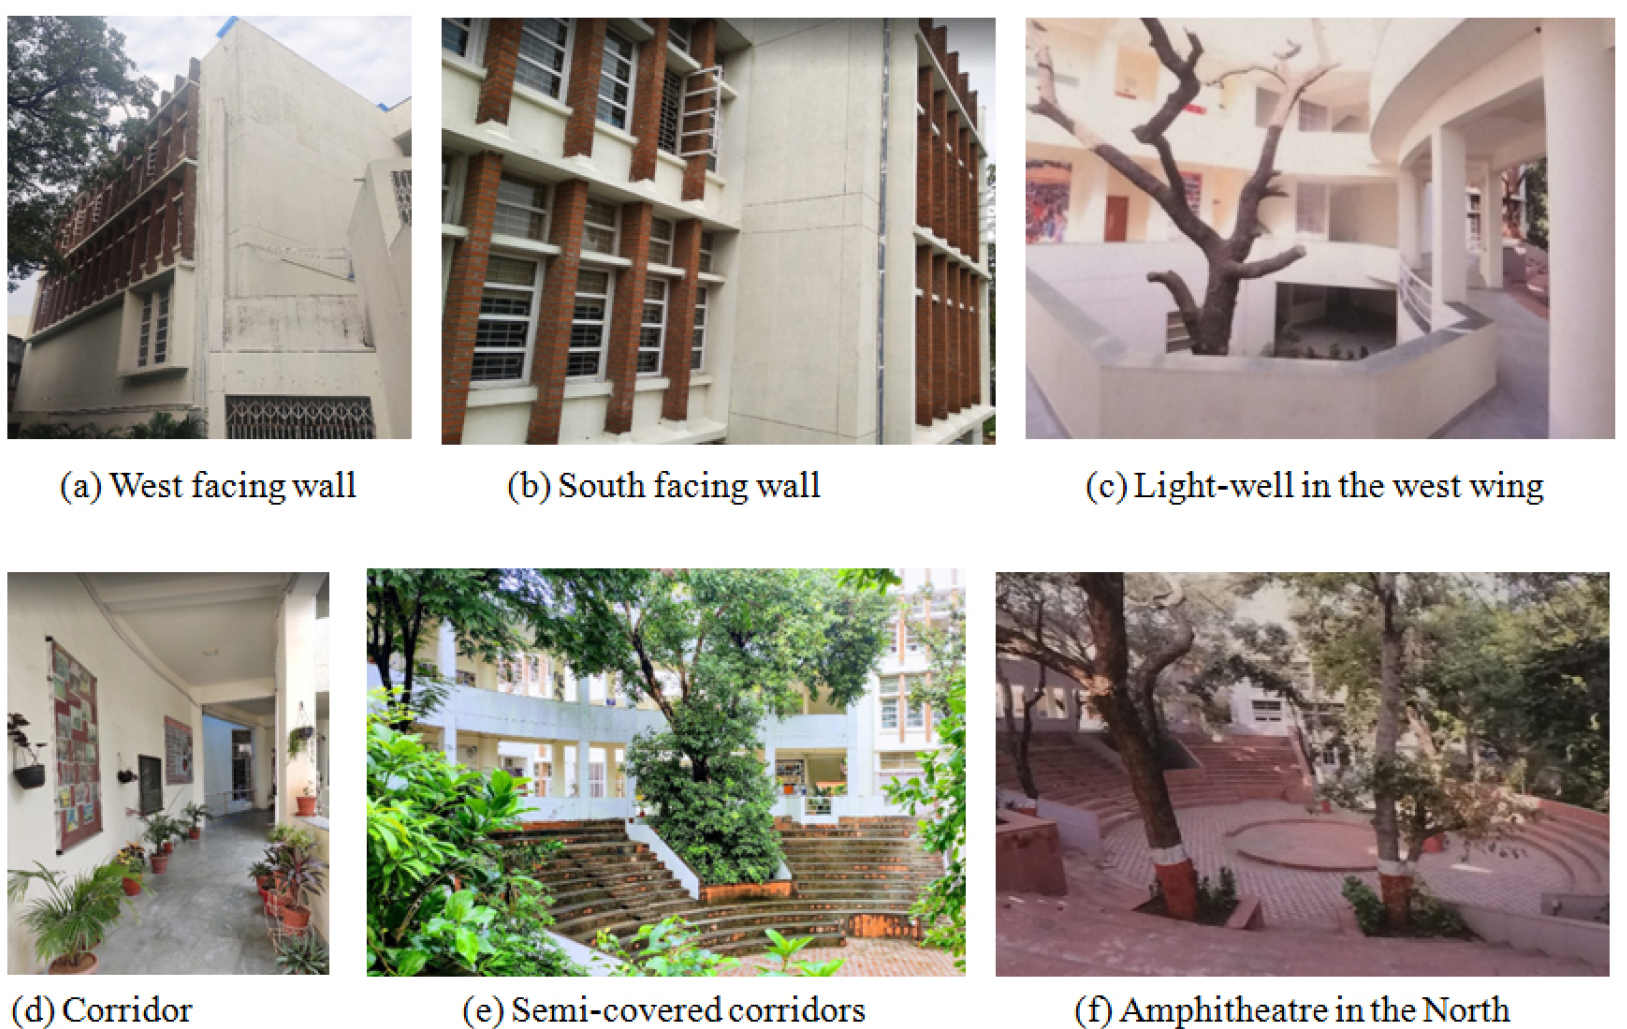
The city of Vadodara, Gujarat, India, falls under the tropical savannah climatic region, the ambient temperature reaches up to 40.3°C during the warmest month of May. There are 175 colleges in Vadodara district [7] that caters to approximately 3 lakh students within the 18-23 years of age group [8], which also is the age when the human capital of the country is most productive [9]. Maharaja Sayajirao University (MSU), located at Vadodara, currently caters to over one lakh students [10], is spread in 275 acres of land, and has a variety of 15 buildings constructed over a time period of 132 years. Thermal comfort is not only influenced by environmental factors, such as air temperature, radiation, relative humidity, and airspeed, but also by personal factors, such as activity and clothing [11]; building’s architectural design [12], as well as the construction material. The architectural style of Vadodara, Gujarat, India, has transitioned from Indo-Saracenic to Contemporary style of architecture, creating an amalgamation of both the styles in the urban fabric of the city. The Indo-Saracenic style has distinct climate-responsive features such as overhanging eaves, shaded balconies, chhatris, bulbous and miniature domes, arcades, stone and wooden jaalis, walls with thermal mass, etc. [13], while, the contemporary style has features such as fins, chhajas, box windows, and recessed openings, reflective wall finish, etc. This aim of this paper is to conduct a contemplative analysis of the thermal comfort range of two naturally ventilated buildings with distinct architectural styles and teaching patterns, situated in a similar context. The two buildings considered for the study are Faculty of Arts, which is the oldest building, and Institute of Fashion design and technology, which is the newly constructed building, and are shown in Figure 1. Though the buildings are of different architectural styles, with different passive design features, they are functionally similar and cater to a similar group of users. Further, the study also aims to identify the passive design features that affect the difference in the thermal comfort range of both the buildings and can be adapted in modern-day architecture to suit present-day lifestyle.
There are two methods employed to analyse the thermal comfort range for buildings in accordance with their functions, users, climate, and it’s heating and cooling methods [14], namely Rational studies those include experiment conducted in climate-controlled chambers with standard clothing, and Field studies those include experiment conducted in the real-life environment with routine clothing and activities. P.O Fanger developed the first thermal comfort equation in 1967 [2], which made the path for the development of the widely accepted and used PMV-PPD model for comfort, which was also adapted by ASHRAE 55 standard [2]. The study also developed the seven-point thermal sensation scale, as shown in Table 1, which has been used for the survey in this study. The PMV-PPD model was developed for air-conditioned buildings [15, 16]; hence it cannot be used directly for selected naturally ventilated buildings.
Various international comfort standards, namely ASHRAE 55 standard [2], ISO 7730, and Indian national standards, namely SP41[17] and National Building Code (NBC)[18], suggest design values for indoor air temperature either based on heat balance model or the adaptive comfort model. Many studies have found that the PMV-PPD model underestimated the occupants’ tolerance of warmth in hot and dry climatic zones [14, 19, 20, 21, 22, 23]. Many studies regarding thermal comfort had been done in Asia, Australia, America, Europe, and Africa; however, very few studies have been reported from India in spite of a large number of naturally ventilated and mixed-mode buildings. The Indian standards use the Tropical Summer Index (TSI) to determine the comfort range of 25°C to 30°C for 50% relative humidity, and may not accurate for higher or lower humidity values. Further Indian Model of Adaptive (Thermal) Comfort was developed in 2014, which derived a range of 20.5°C to 28.5°C (RH 30% to 60%) to provide thermal comfort guidelines for naturally-ventilated Indian offices and residential apartments [12, 24]. But because of the IMAC’s limitation to include educational buildings in its database, its applicability is questionable [25]. Hence, there is a need to develop a thermal comfort range for institutes of Higher Education in India.
Table 1.
Seven-point Thermal sensation scale [11]
Study methodology
Case-study buildings description
The University campus was visited, and two buildings were identified for study: Faculty of Arts (Building 1 = B1) and Institute of Fashion design and technology (Building 2 = B2). Architectural drawings of the buildings were obtained, and a site visit was conducted to identify the spaces of study as well as the passive design features in both buildings. The summarised study of both buildings is as follows:
Building 1: Faculty of Arts
The Ground floor plan and First floor plan of Building 1 are shown in Figure 2 and Figure 3 respectively. The identified spaces as shown in Figure 3 are denoted as Hall 1, Hall 2, and Hall 3. The photographs of the identified spaces are shown in Figure 4 and the passive design features are shown in Figure 5. The details of Building 1 are tabulated in Table 2.

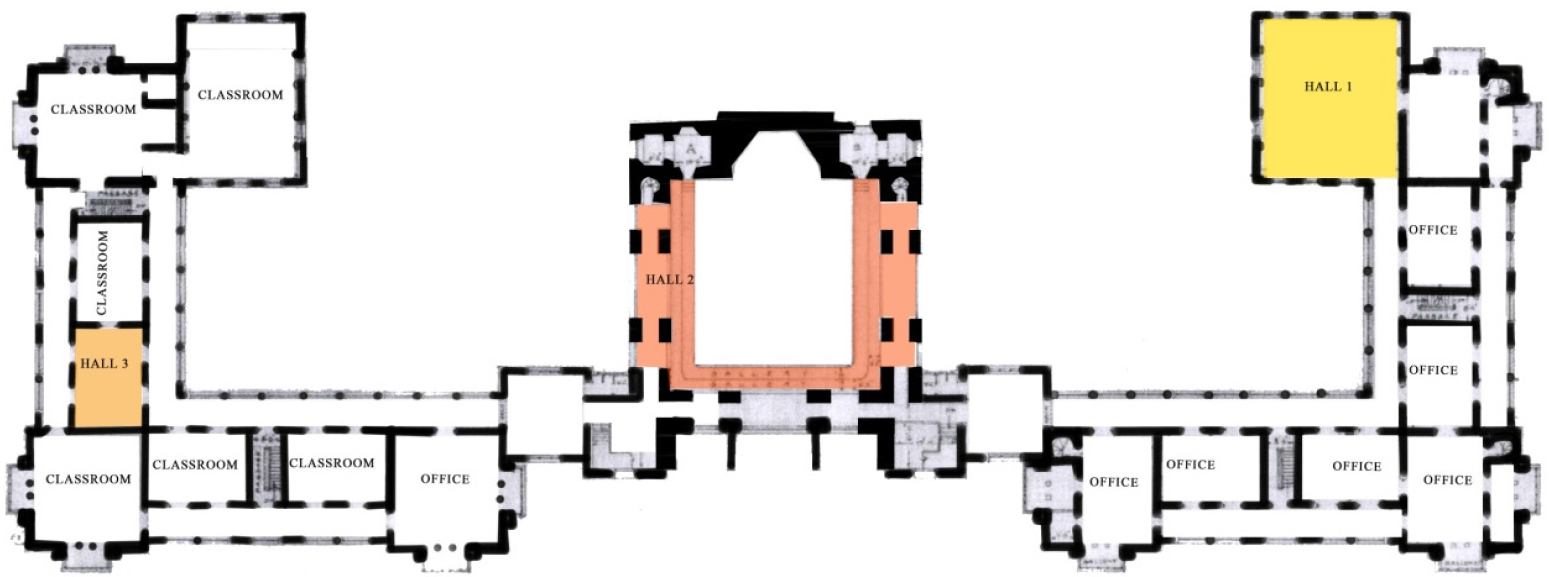
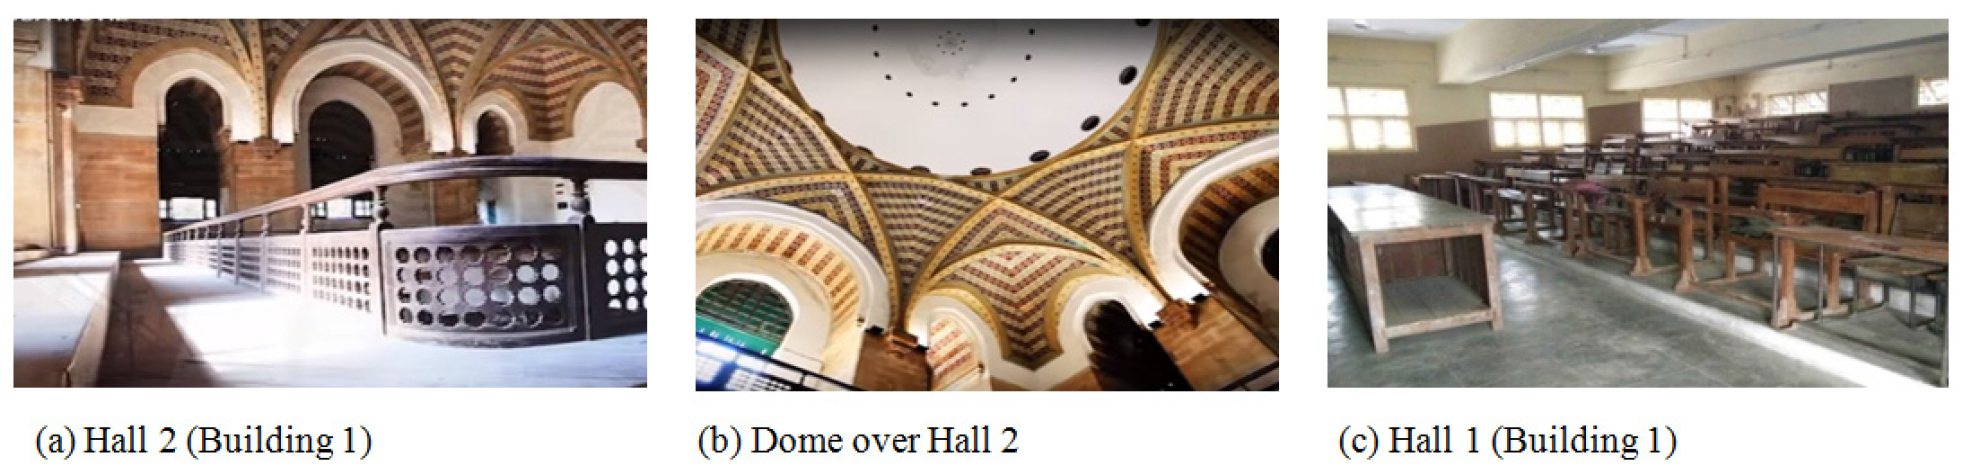
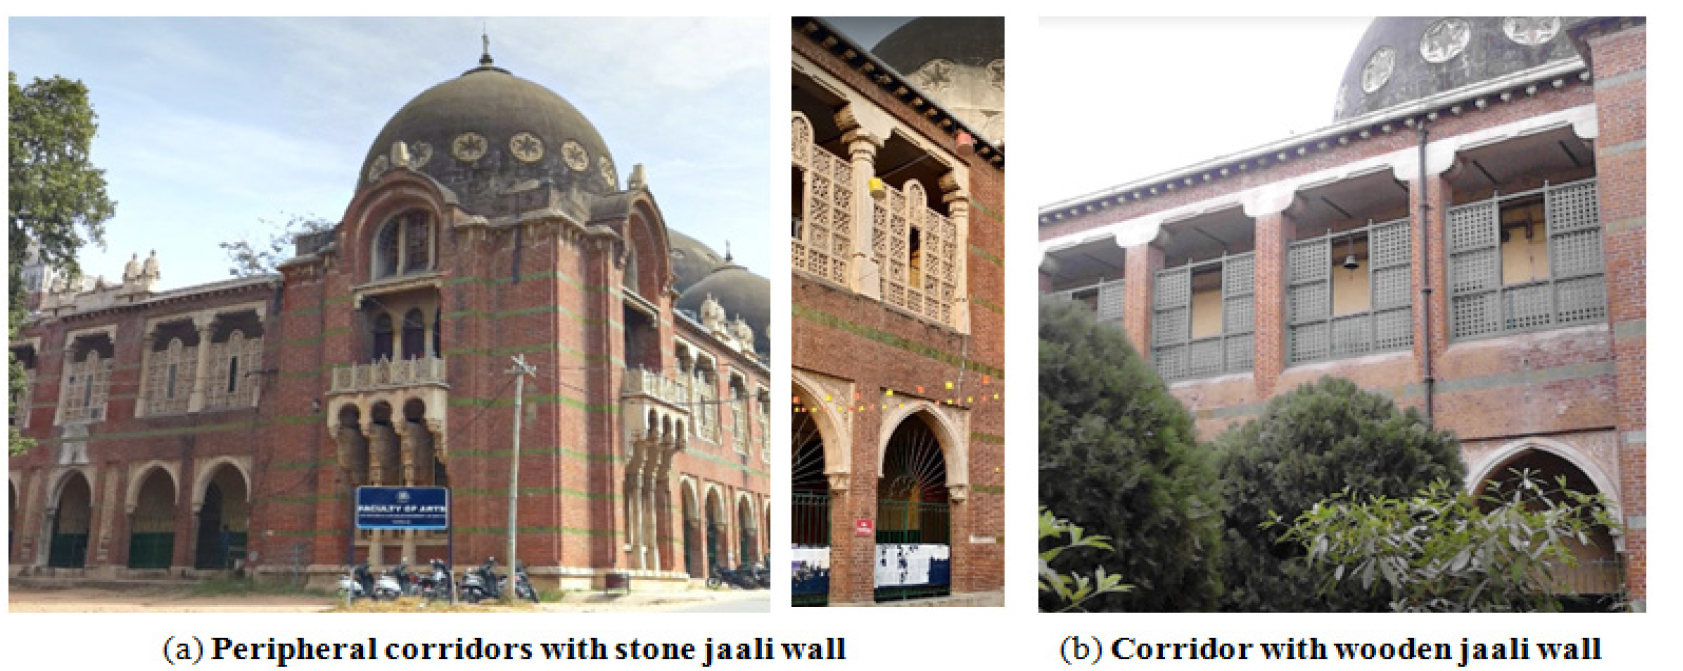
Table 2.
Summary of Building 1
Building 2: Institute of Fashion Design and Technology
The identified spaces of Building 2 namely Hall 1, Hall 2, and Hall 3 are shown in Figure 6. The passive design features present in Building 2 are shown in Figure 7.

The details of Building 2 are tabulated in Table 3.
Table 3.
Summary of Building 2
Field survey through questionnaire
The data was collected for the rainy season, i.e., September 2019, and the winter season, i.e., January 2020. A questionnaire survey of the occupants along with the instrumental measurement of the environmental parameters of thermal comfort was carried out in three spaces of each building across the study. A total of 2674 subjects were surveyed across the study, of which 95% of votes were of students aged between 18 to 23 years. The survey was conducted three times a day, once between 10 am -12 pm, 12 pm-3 pm, and 3 pm to 5 pm, for four continuous working days of both the months of the survey. The survey questionnaire consisted of 12 questions divided into five parts to acquire the details concerning respondent’s age, gender, experience before entering the premises, activity, thermal and humidity sensation and their preference during the survey, freedom of physical action for adaptive response to achieve comfort, clothing insulation, and their overall satisfaction. The questionnaire is attached in Appendix 1. The occupants filled the questionnaire after spending a minimum of 30 minutes in the classroom being surveyed.
ASHRAE’s seven-point thermal sensation scale, as mentioned in Table 1, was used to obtain the thermal sensation votes of the occupants to determine their perception of the thermal environment. Votes were also collected from the thermal preference of the occupants as per the Nicol preference scale [26], as shown in Table 4.
Table 4.
Nicol preference scale
| Nicol Preference scale | |
| Scale Value | Preference |
| 2 | Much cooler |
| 1 | Bit cooler |
| 0 | No change |
| -1 | Bit warmer |
| -2 | Much warmer |
The activity was considered ‘sitting’ with metabolic rates, MET = 1 to 1.2. The occupants were asked to write down their clothing ensemble, which was later converted to the clo unit. The clo values listed in ASHRAE 55 [2] are insufficient as they do not include the clothing ensembles worn in India, for which another study concerning Indian clothing [24] was referred, and the values are given in Table 5.
Table 5.
Clothing insulation values
Data collection through instruments
CE certified and calibrated digital handheld anemometer was used to collect the readings of the indoor and outdoor environmental parameters such as airspeed (with a range of 0.3 to 30 m/s ±5%), air temperature (-10°C to 50°C ± 1°C), and relative humidity (0% to 99% ±5% at 20% to 90%). The globe temperature was approximately equal to the outdoor air temperature, so it was not considered separately. The measurements were taken while the occupants were filling the questionnaire. The instrument was held at 1-meter height, and the readings were taken from all the corners as well as the centre of the study spaces. The values recorded were converted into mean values for easier workability.
A range of comfort indices was calculated from the collected dataset, which includes indoor air temperature (Ti), outdoor air temperature (To), airspeed (v), relative humidity (RH), predicted mean votes (PMV), actual mean votes (AMV), predicted percentage dissatisfied (PPD), metabolic rate (MET), and mean clothing insulation (Clo).
Analysis
Thermal comfort parameters
The parameters obtained and calculated from the field study in both the buildings for two distinct seasons have been tabulated in Table 6.
Table 6.
Summary of thermal comfort parameters from the study
Temperature
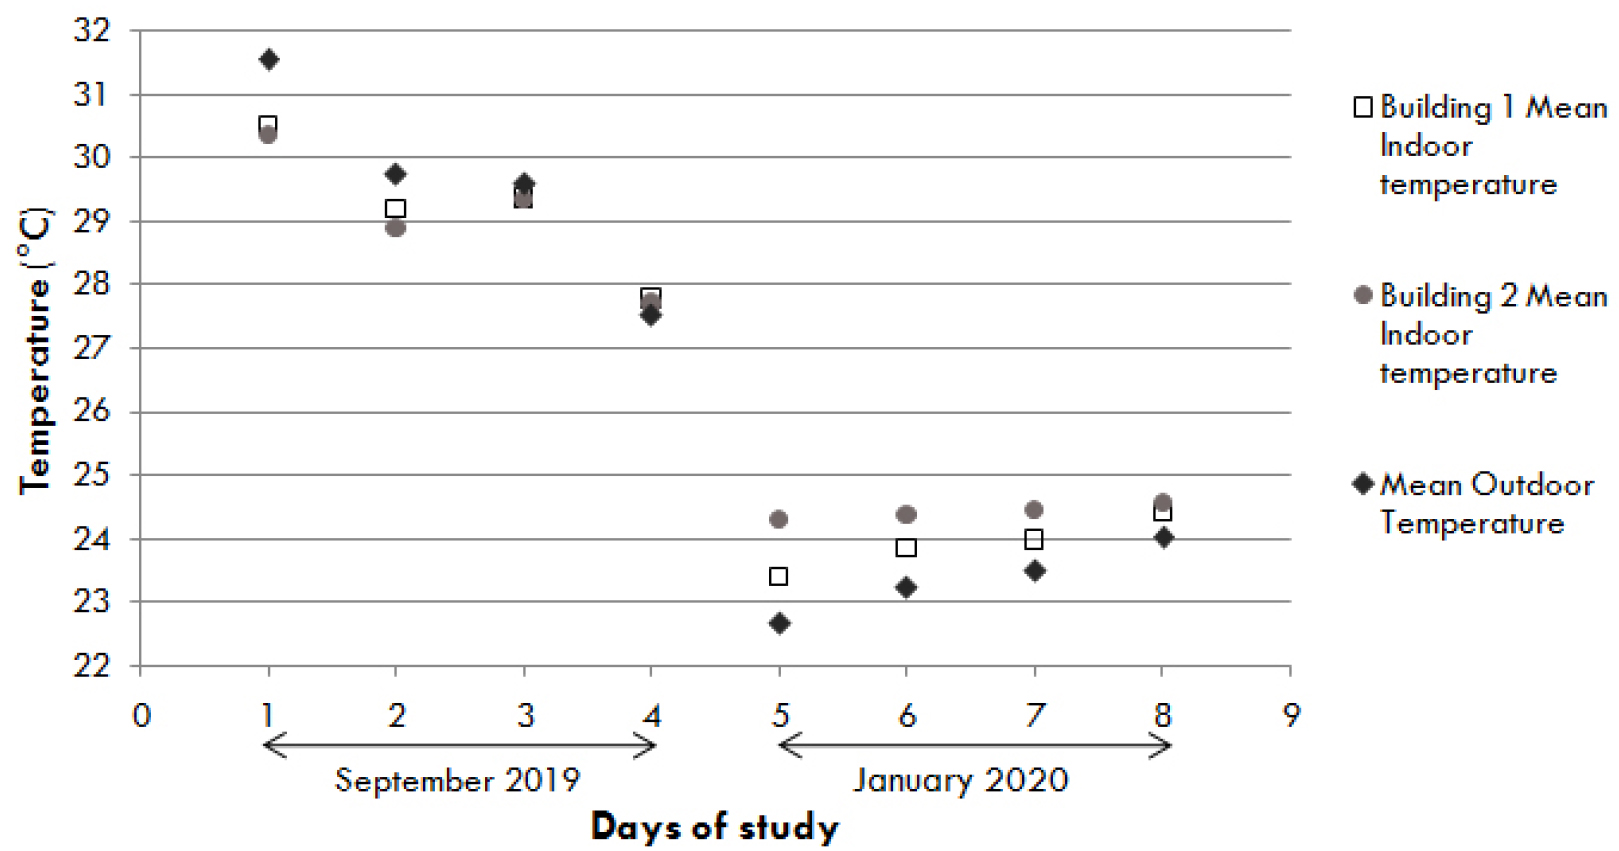
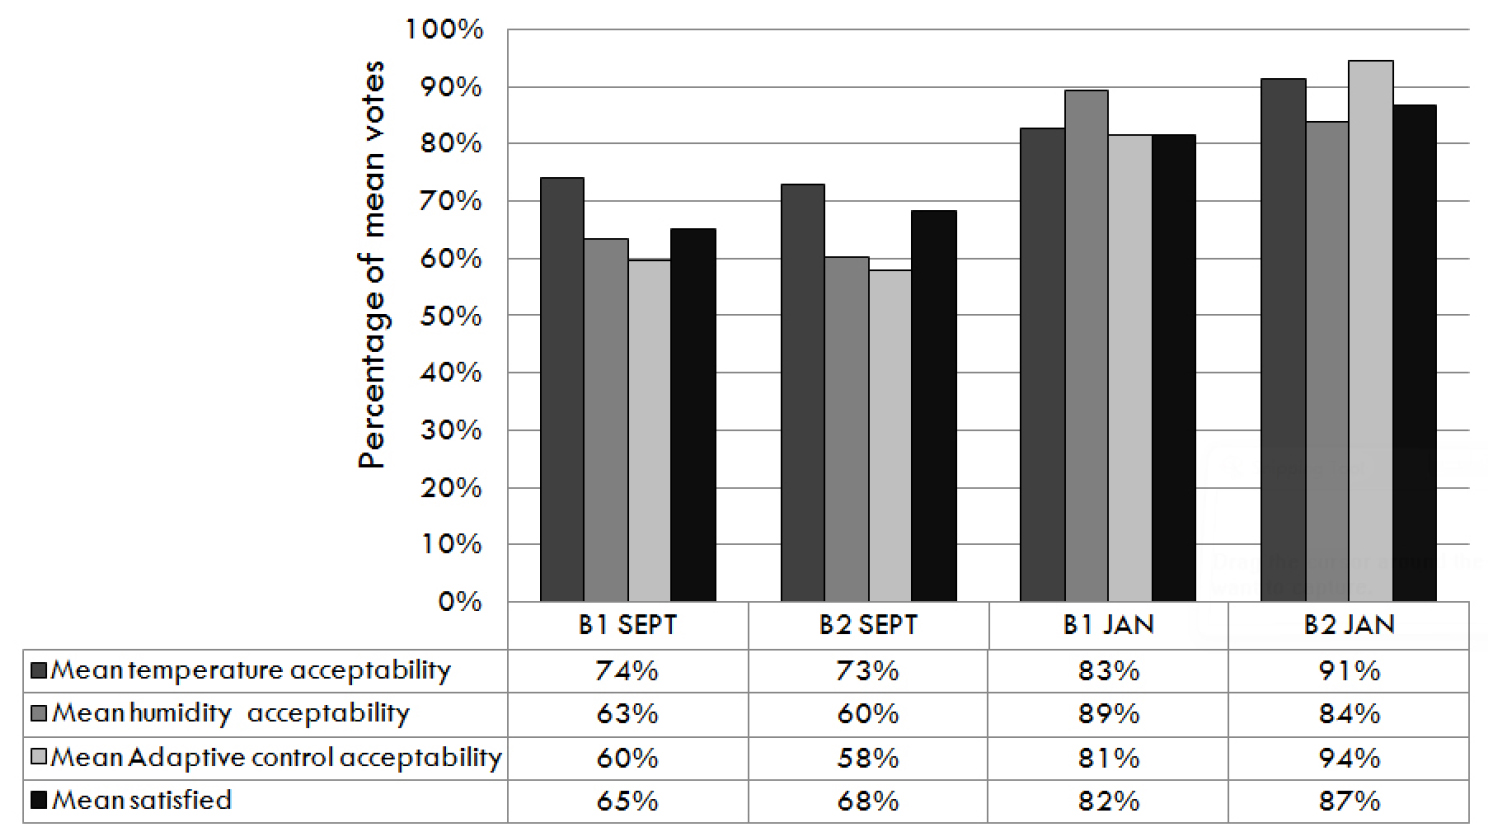
The maximum mean indoor air temperature (Ti) recorded in Building 1 is 30.49°C, and 30.34°C in Building 2. The minimum mean indoor temperature recorded in Building 1 is 23.39°C, and in Building 2 is 24.28°C, as shown in Figure 8. This signifies that this study covers a range of 7.1°C in Building 1 and 6.06°C in Building 2. The maximum and minimum mean outdoor temperature recorded is 31.53°C and 22.67°C, respectively; this signifies that this study covers a range of 8.86°C. On conducting an ANOVA test on the recorded values of indoor air temperature, it is discerned that the difference in the mean indoor temperature of Building 1 and Building 2 is minimal in September, while there was a significant difference observed in the readings of January. The occupants found the temperature range between 19.9°C and 26.5°C (> 80%) in January more acceptable than the temperature range between 27.5°C and 31.8°C (< 80%) in September as shown in Figure 9.
Relative humidity
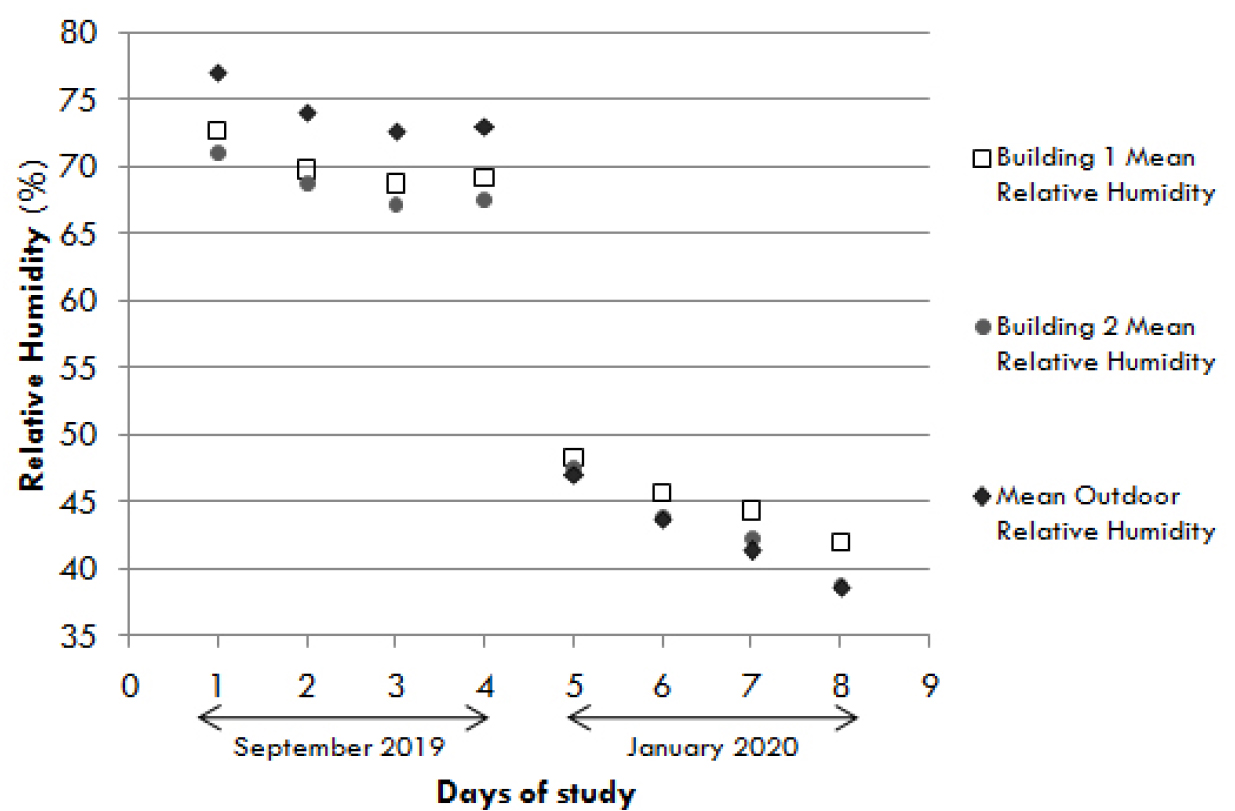
The maximum mean indoor relative humidity recorded for Building 1 is 72.67% & Building 2 is 71%. The minimum mean indoor relative humidity recorded in Building 1 is 42% & Building 2 is 38.67%, as shown in Figure 10. This signifies that the study covered a range of 30.67% and 32.33% in Building 1 and 2, respectively. The maximum mean outdoor relative humidity recorded is 77%, and the minimum mean outdoor relative humidity recorded is 38.67%, which indicates that the study covers a range of 38.33%. On conducting an ANOVA test on the recorded values, it was found that only a slight difference in the mean indoor relative humidity of Building 1 and Building 2 was observed in September, while there was a very significant difference observed in the readings of January. The occupants found the relative humidity range of 34% to 50% (acceptability> 80%) in January more acceptable than the relative humidity range of 65% to 85% (acceptability < 80%) in September, as shown in Figure 9.
Clothing
Adjustment of clothing ensembles is one of the important and apparent methods, which is the most practical adaptation processes to sustain comfort over different seasons. The mean clo value of both the buildings is almost identical; for September, it is 0.5 clo, and for January, it is 0.8 clo. The difference in the clo value for both the season is 0.3 clo. The relationship between outdoor temperature and clothing pattern is depicted in Figure 11. It is also observed that there are two distinct clothing profiles, and the mean clothing value varies from 0.79 clo to 0.91 clo during the winter season (January) and between 0.49 clo and 0.58 clo during the rainy season (September).
From Figure 11, it can be seen that the clothing pattern followed by the occupants in both buildings is similar. Hence, an overall clothing pattern’s dependence on the outdoor temperature has been assessed by linear and polynomial regression and exhibited by the following equation 1 and 2
Equation 1. Linear relationship between clothing insulation (clo value) and outdoor temperature (To)
Equation 2. The polynomial relationship between clothing insulation (clo value) and outdoor temperature (To)
It is also observed from Figure 11 that the clo values within the range of 25.5°C and 26.5°C are the reason the polynomial curve bends upwards, indicating the adaptive behaviour of the occupants. The difference between the maximum and minimum mean outdoor temperature in January and September, respectively, is 0.9°C with the clo value difference of 0.3 clo. Although the difference in clo value is predicted to be 0.15 clo as per ASHRAE 55 standard [2], which predicts a difference of 1 clo for every 6°C change in temperature.
Adaptive means of control
The means of adaptive controls available to the occupants were ceiling fans, operable windows and doors, curtains or blinds on few windows, and changing their clothing ensemble. From the votes collected, it was found that operable windows and ceiling fans were the most preferred means of adaptive control in the rainy season while changing the number of clothing ensembles was preferred by most of the occupants in the winter season. The occupants satisfied with the means of adaptive control available to them were only 59.7% in Building1 and 57.9% in Building 2 in the month of September, as the means available were unable to control the indoor relative humidity up to the desirable range, as seen in Figure 9.
Comfort votes
Thermal sensation votes (TSV) and Thermal preference votes
In Table 7, the occupants voting for the middle category of the scale (1, 0, -1) are considered satisfied. The environment is considered thermally comfortable if the percentage of votes for the middle group is more than 80% [2].
Table 7.
Percentage of Thermal Sensation votes in Building 1 and Building 2 for September and January
In September, the percentage of votes in the middle category is 91.39% for Building 1 and 93.97% for Building 2, signifying that the occupants were comfortable in their environments. In January, the percentage of votes in the middle category is 59.86%for Building 1 and 89.69%for Building 2, signifying that the occupants in Building 1 were dissatisfied with their environment, while the occupants in Building 2 were feeling comfortable in their environment. The thermal preference votes obtained from the survey are tabulated in Table 8.

Table 8.
Percentage of Thermal Preference votes in Building 1 and 2 for September and January
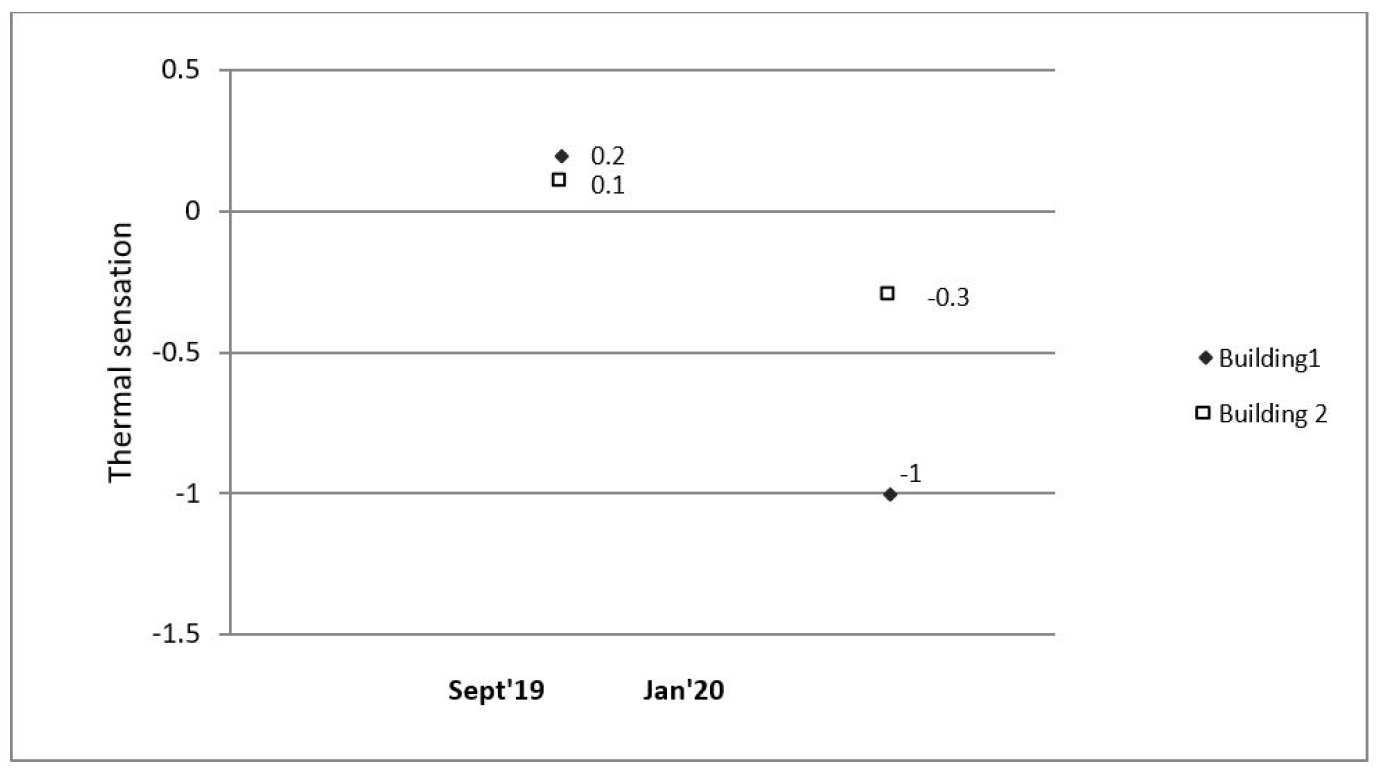
In September, the majority of occupants in both the buildings (mean percentage of 44.53%) preferred the indoor temperature to be as it is, while in January, the majority of the occupants in both the buildings (mean percentage of 48.21%) preferred the temperature to be slightly warmer. The mean thermal sensation votes of Building 2 were found to be towards slightly cooler sensation than Building 1 in January, while in September, both buildings showed nearly neutral sensation, as shown in Figure 12.
Overall satisfaction of occupants
The environment is considered satisfactory when 80 percent or more occupants are satisfied with their environment. In September, the occupants were unsatisfied, while they were satisfied with their environment in January, as shown in Figure 9. The percentage of satisfied occupants increased by 16.33% in Building 1 and by 18.22% in Building 2 from September to January when the mean outdoor Relative Humidity decreased by 31.5% and the mean outdoor temperature decreased by 6.23°C. It is also observed that in September, even though the occupants in Building 1 were more accepting of their environmental parameters, they were less satisfied than occupants of Building 2.
Predicted mean votes (PMV), Actual Mean votes (AMV), Predicted percentage dissatisfied (PPD), and Actual percentage dissatisfied (APD)
Thermal sensation votes obtained from the survey as per the thermal sensation scale are considered Actual mean votes (AMV), while the Predicted mean vote (PMV) and Predicted percentage dissatisfied (PPD) was calculated from the equation given by P.O. Fanger, provided in ASHRAE 55 standard [2] as shown in equations 3 and 4.
Equation 3. Predicted Mean vote (PMV), where M is the metabolic rate, and L is the thermal load on the body (ASHRAE 2015)
Equation 4. Predicted Percentage dissatisfied (PPD) as a function of PMV (ASHRAE 2015)
The thermal sensation profile against outdoor temperature derived from the AMV of Building 1 and 2, and PMV calculated from equation 3 is shown in Figure 13.
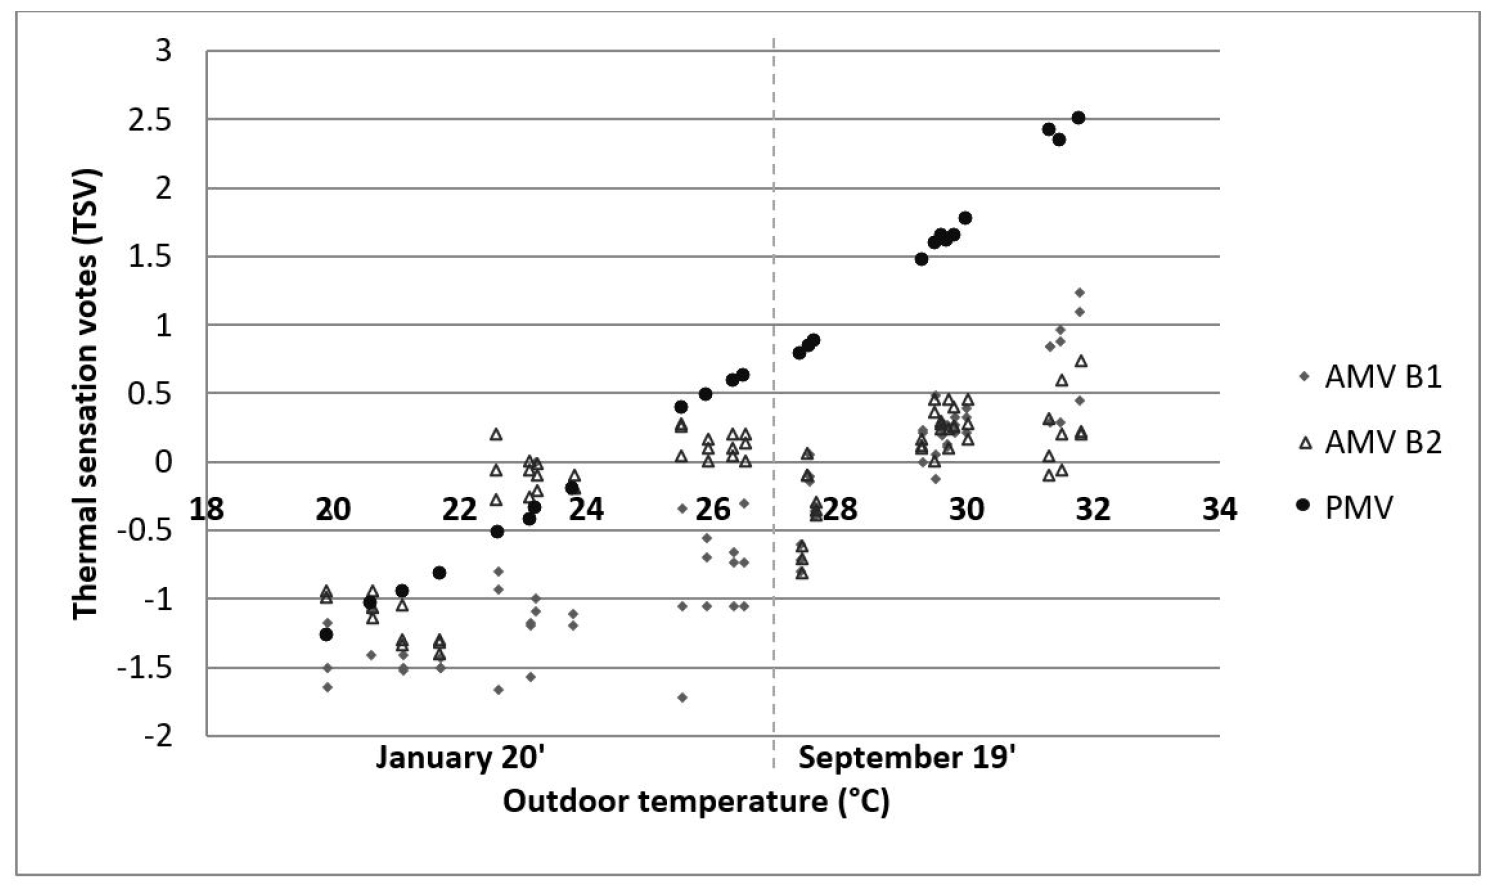
From Figure 13, it is observed that two separate profiles exist for two different seasons of the year. The thermal sensation lies in between -1 to +1.5 when outdoor temperature varies from 27.4°C to 31.8°C in September, while for January it lies in between -2 to +0.5, with the variation of outdoor temperature from 19.9°C to 26.5°C. When the mean TSV lies between -1 to +1 and occupants’ satisfaction percentage is >80%, a comfortable temperature range is achieved. The comfort temperature range, in September, in Building 1 is found to be 27.4°C to 31.5°C and in Building 2 is found to be 27.4°C to 31.8°C, and in January, it is found to be 22.6°C to 26.5°C in both the buildings. It is also seen that although the PMV profile is similar to that of AMV in January, it is over-predicted in September.
The percentage dissatisfied index presents the portion of people dissatisfied or is uncomfortable at an exacting environmental condition. Its relation with the thermal sensation is shown in Figure 14, which considers the relationship between PMV-PPD as well as AMV-APD.
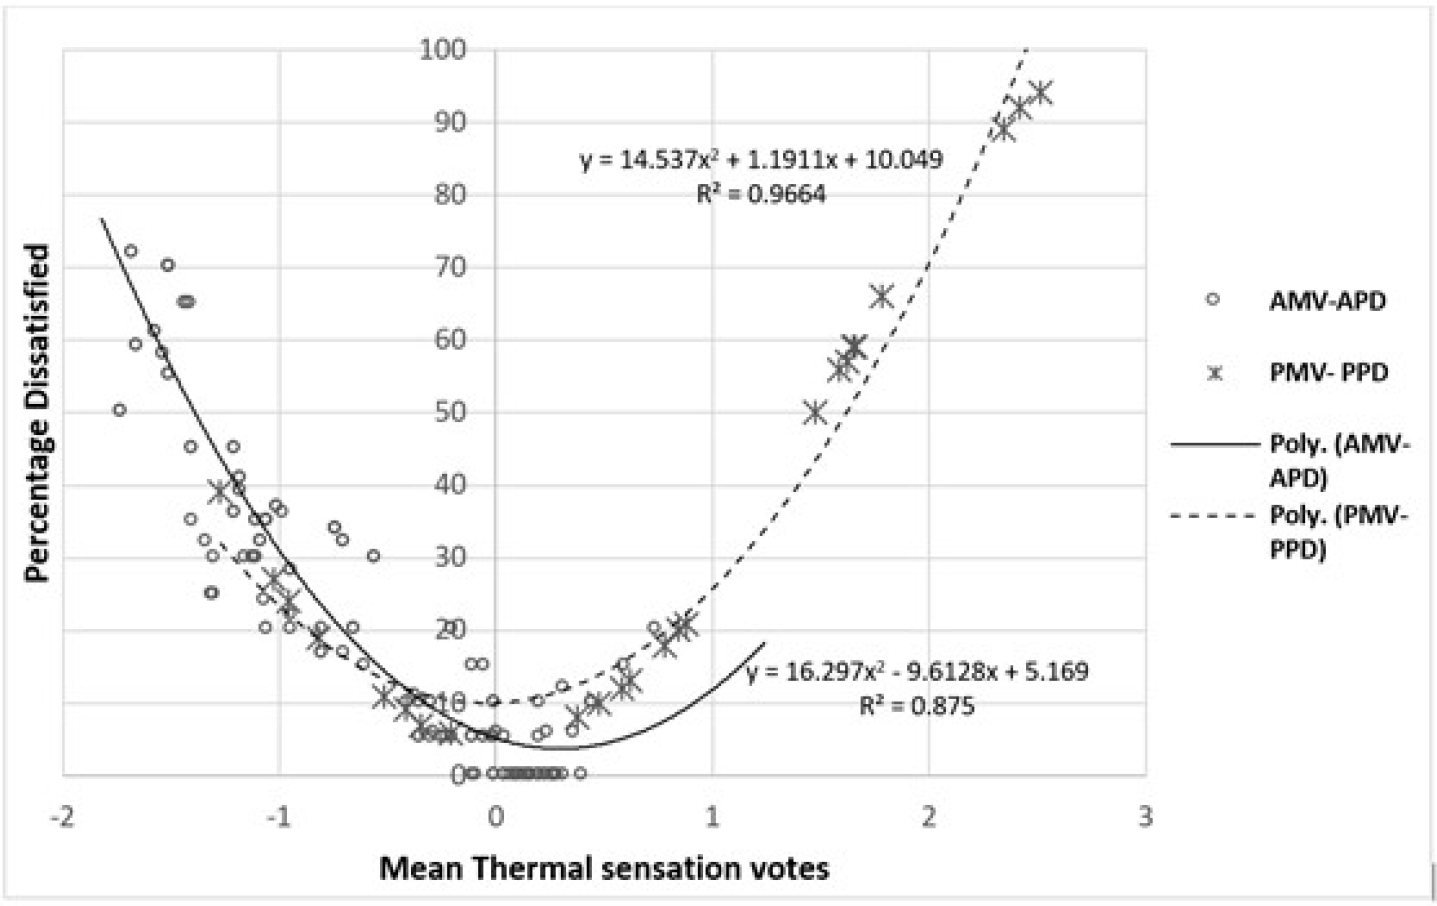
From Figure 14, it is observed that the PMV-PPD graph over-predicts the warmer sensation and dissatisfied people, while it under-predicts the cooler sensation and people dissatisfied because of it. This shows that the occupants in the study are more tolerant of the warmer sensations. The relationship between AMV-APD and PMV-PPD is represented in equations 5 and 6, respectively.
Equation 5. Relationship between AMV and APD
Equation 6. Relationship between PMV and PPD
Correlation between the collected data
Pearson correlation has been used to analyse the relationship between the various set of data collected from the field study. The correlation between indoor air temperature, outdoor air temperature, Thermal sensation, and Thermal preference is shown in Table 9.
Table 9.
Pearson correlations between indoor temperatures and outdoor temperatures, thermal sensations, and thermal preferences in Building 1 (B1) and Building 2 (B2) in September’19 and January’20
From Table 9, it can be inferred that there is a strong relation between indoor and outdoor temperatures, while the relation between the thermal preference of the occupants and the indoor temperature is not that significant. The relationship between occupants’ thermal sensation and indoor air temperature is strong in January, while in September, the relationship is weak. This indicates that factors other than temperature influence occupants’ comfort in September. For finding the other factor, the correlation between indoor relative humidity and mean thermal sensations were analysed as shown in Table 10.
Table 10.
Pearson correlations between mean indoor relative humidity and mean thermal sensations in Building 1 (B1) and Building 2 (B2) in September and January
From Table 10, it is inferred that in September, occupants’ thermal sensation and indoor relative humidity relate moderately, while the relation is fragile in January.
It is asserted from the findings of Tables 9 and 10 that indoor relative humidity primarily affects thermal comfort in September. In contrast, in January, indoor temperature assumes a vital role in affecting occupants’ thermal comfort in both buildings.
To understand the effect of indoor temperature and thermal sensation on occupants’ overall satisfaction, their correlation was analysed in Table 11.
Table 11.
Pearson correlations between overall satisfaction, mean indoor temperature and mean thermal sensations of occupants in Building 1 (B1) and Building 2 (B2) in September’19 and January’20
Table 11 establishes that the overall satisfaction of the occupants is moderately related to the buildings’ indoor temperature, while it relates strongly to the thermal sensation of the occupants of both buildings throughout the study.
From the analysed correlations, it can be said that the overall satisfaction of the occupants relates to the thermal sensation experienced by them. The occupants’ thermal sensation in both buildings was strongly related to the indoor air temperature in January, while it was related more to the indoor relative humidity in September. Hence, the overall satisfaction of occupants depended on the indoor air temperature in January, whereas relative humidity assumed a key role in defining the satisfaction of occupants in September.
Results and discussion
Determining thermal neutrality and comfort range
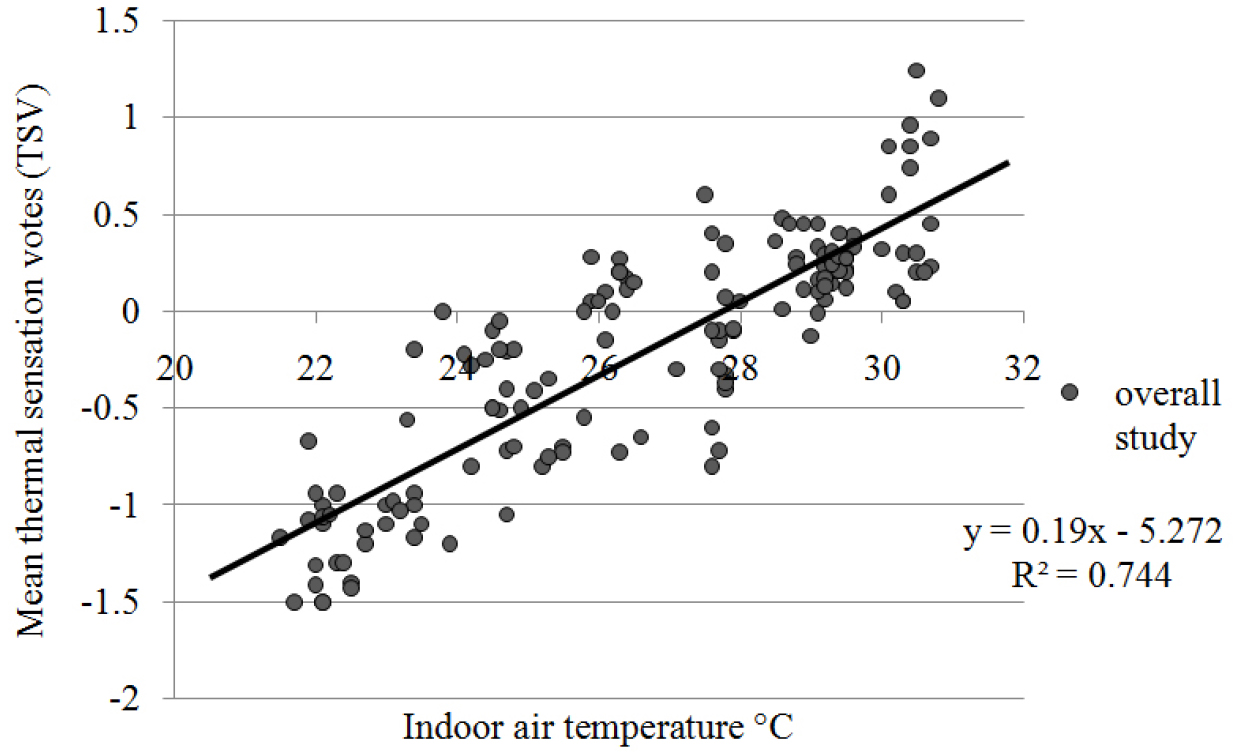
By performing regression analysis, as shown in Figure 15, 16, and 17, of the dependent variable “thermal sensation” on the independent variable “indoor air temperature” for both the buildings, equation 7, 8, and 9 are derived to obtain the ‘neutral’ temperature - i.e., when mean TSV is zero, and a thermal comfort range, for building 1, building 2, and overall study, respectively.
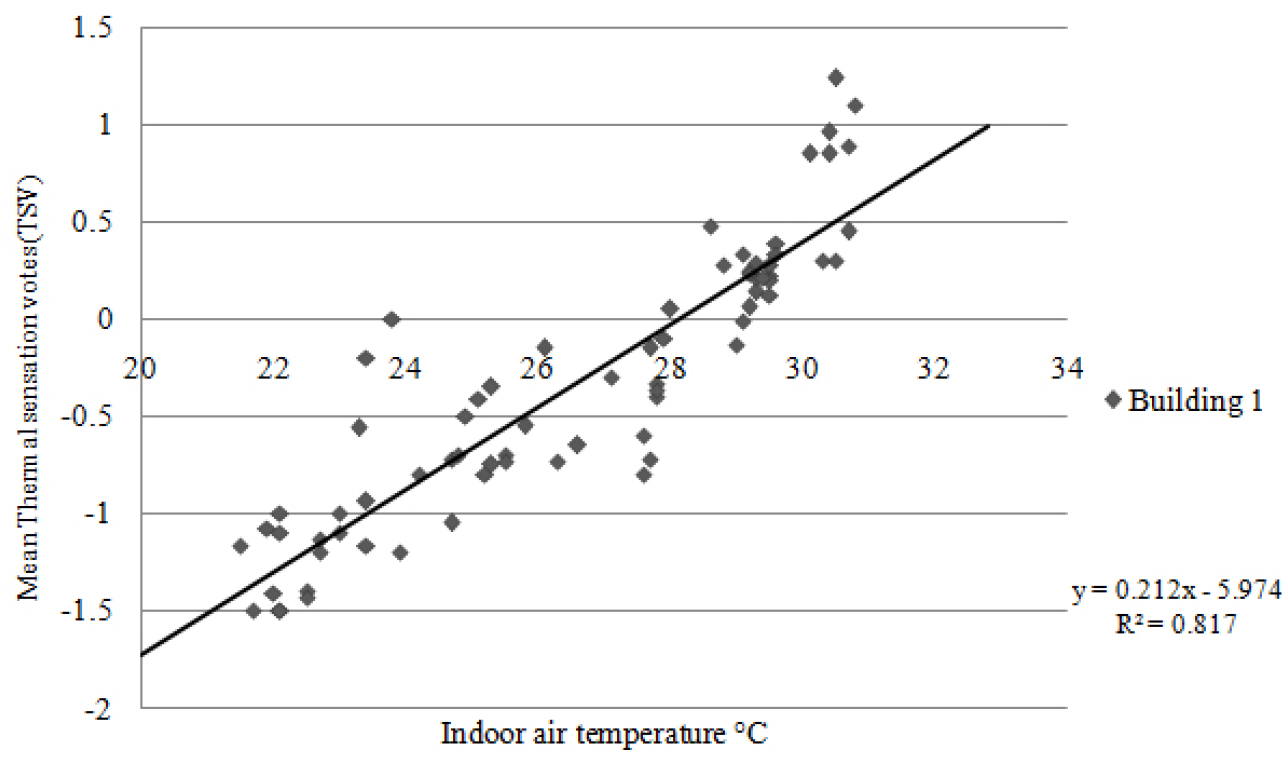
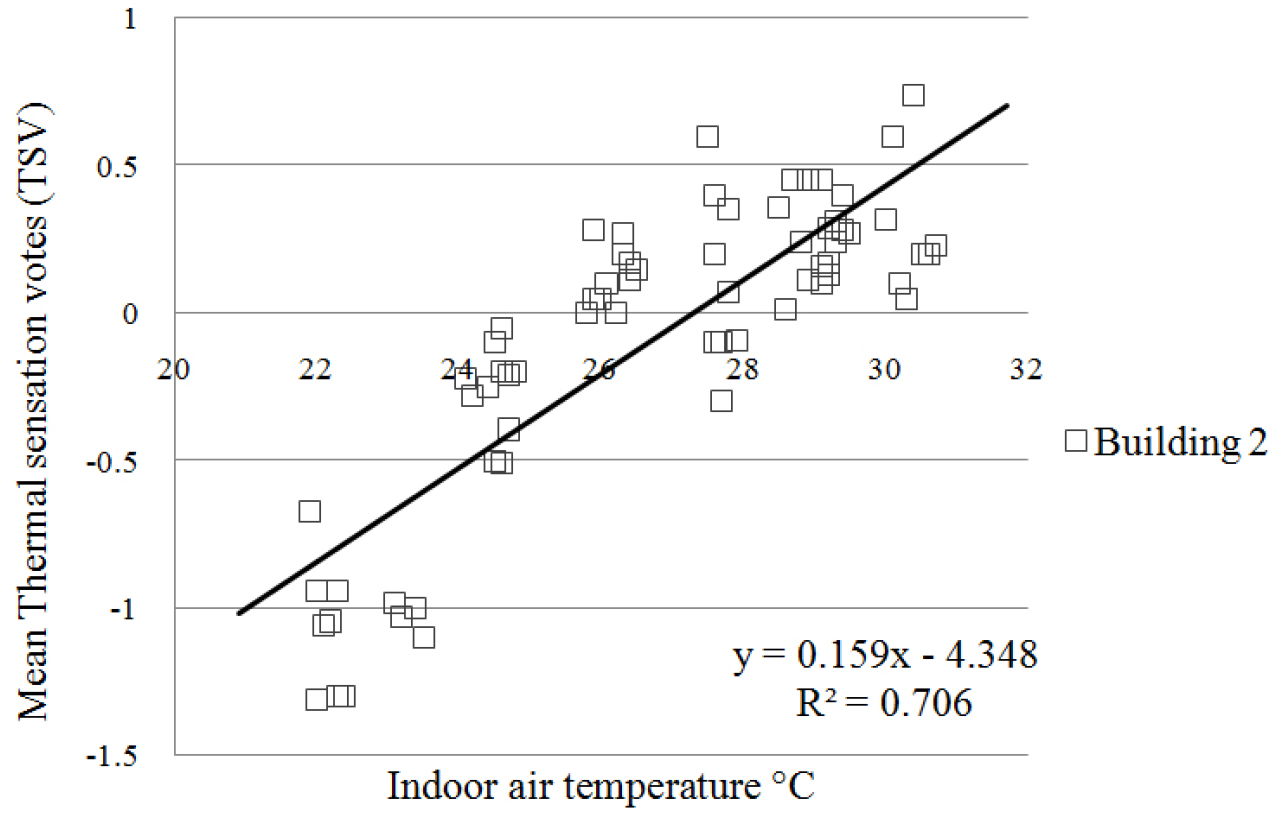
A comfortable temperature range is obtained when there is thermal acceptability of 90%, which is when TSV lies in the range of -0.5 to 0.5. This range for both the buildings as well as for the overall study is derived from equations 7, 8, and 9.
Equation 7. The regression of mean thermal sensation vote (TSV) on indoor air temperature (Ti) for Building 1 (Faculty of Arts).
The comfort range is between 23.8°C and 30.5°C in Building 1 with a neutral temperature of 28.18°C.
Equation 8. The regression of mean thermal sensation vote (TSV) on indoor air temperature (Ti) for Building 2 (Institute of Fashion Technology).
The comfort range is between 24.2°C and 30.3°C in Building 2 with a neutral temperature of 27.34°C.
Equation 9. The regression of mean thermal sensation vote (TSV) on indoor air temperature (Ti) for naturally ventilated buildings from the study
The comfort range is between 25.2°C and 30.4°C for the study with a neutral temperature of 27.7°C.
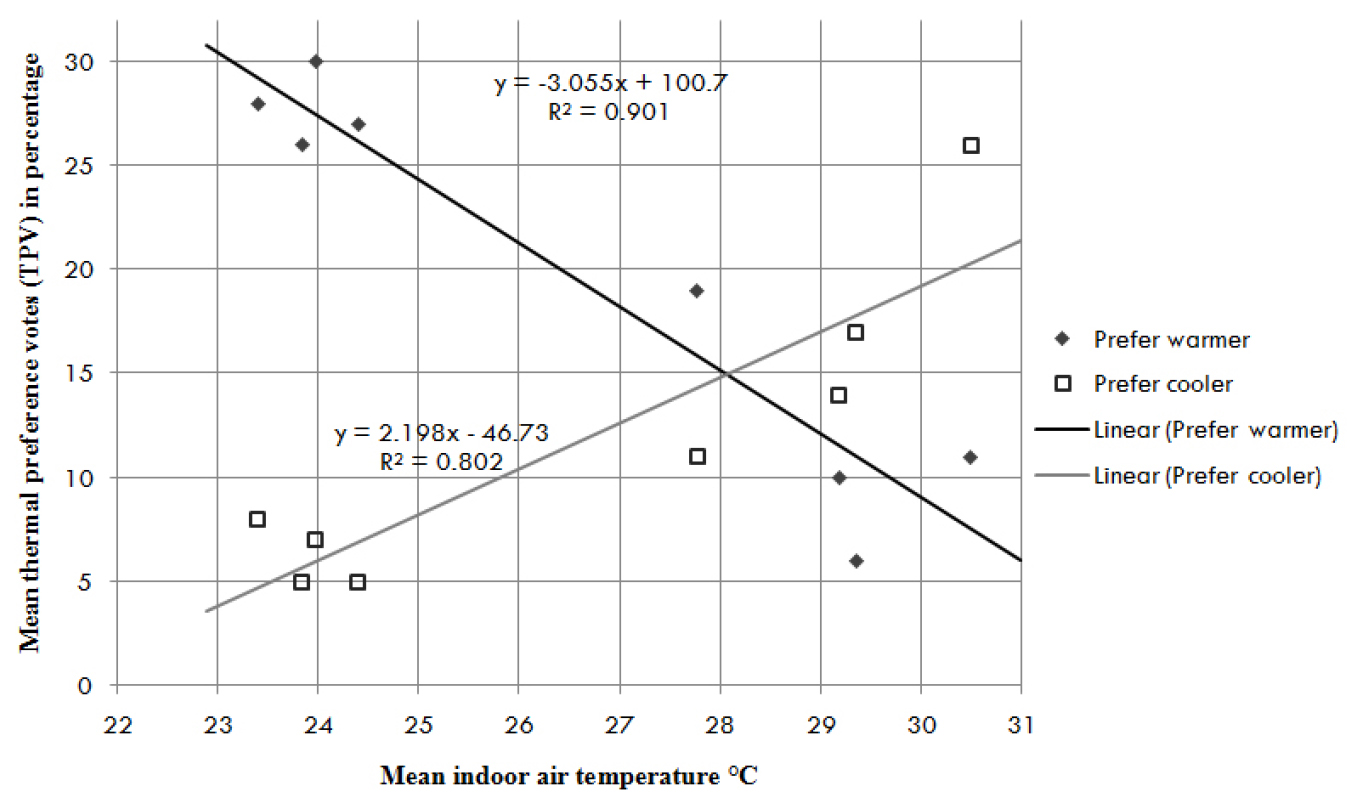
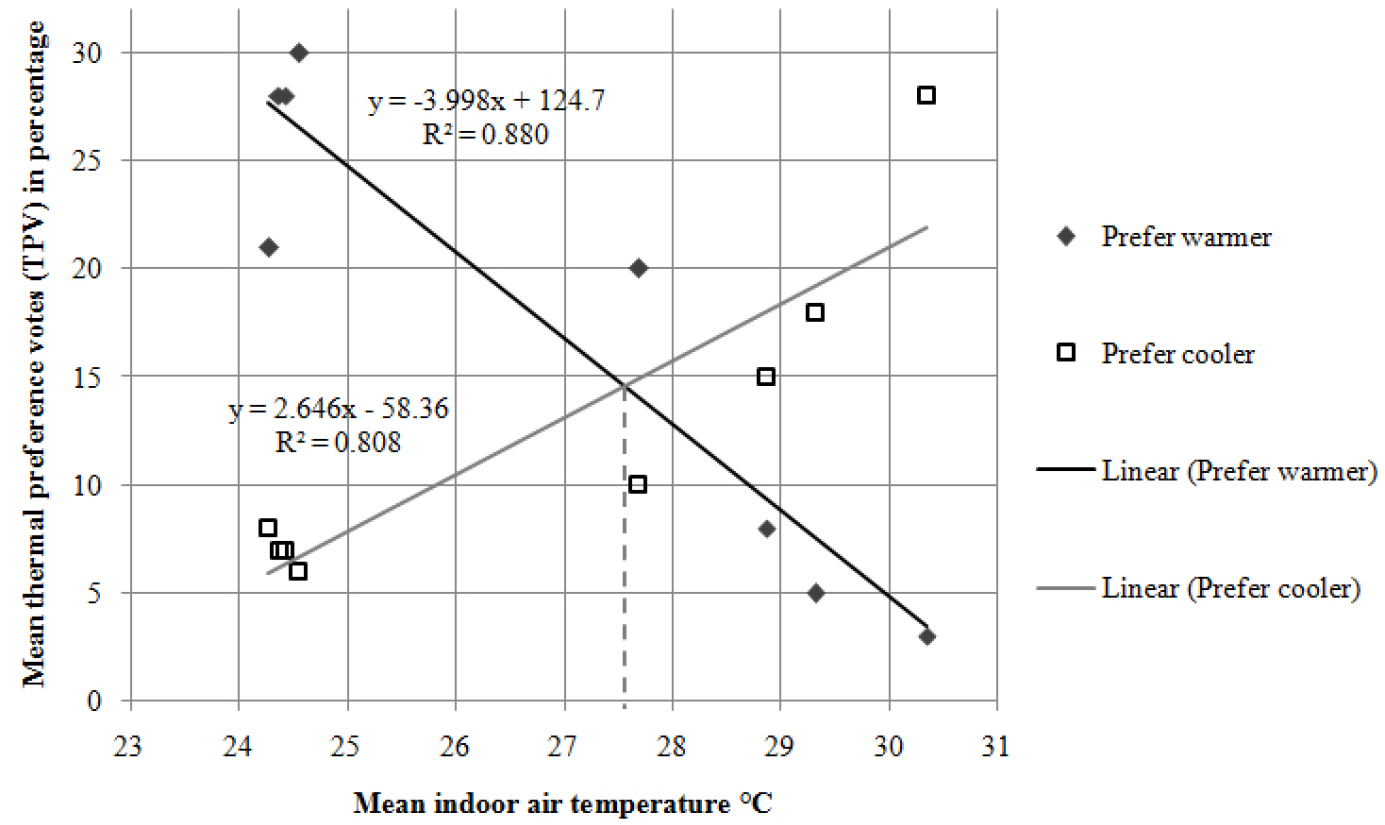
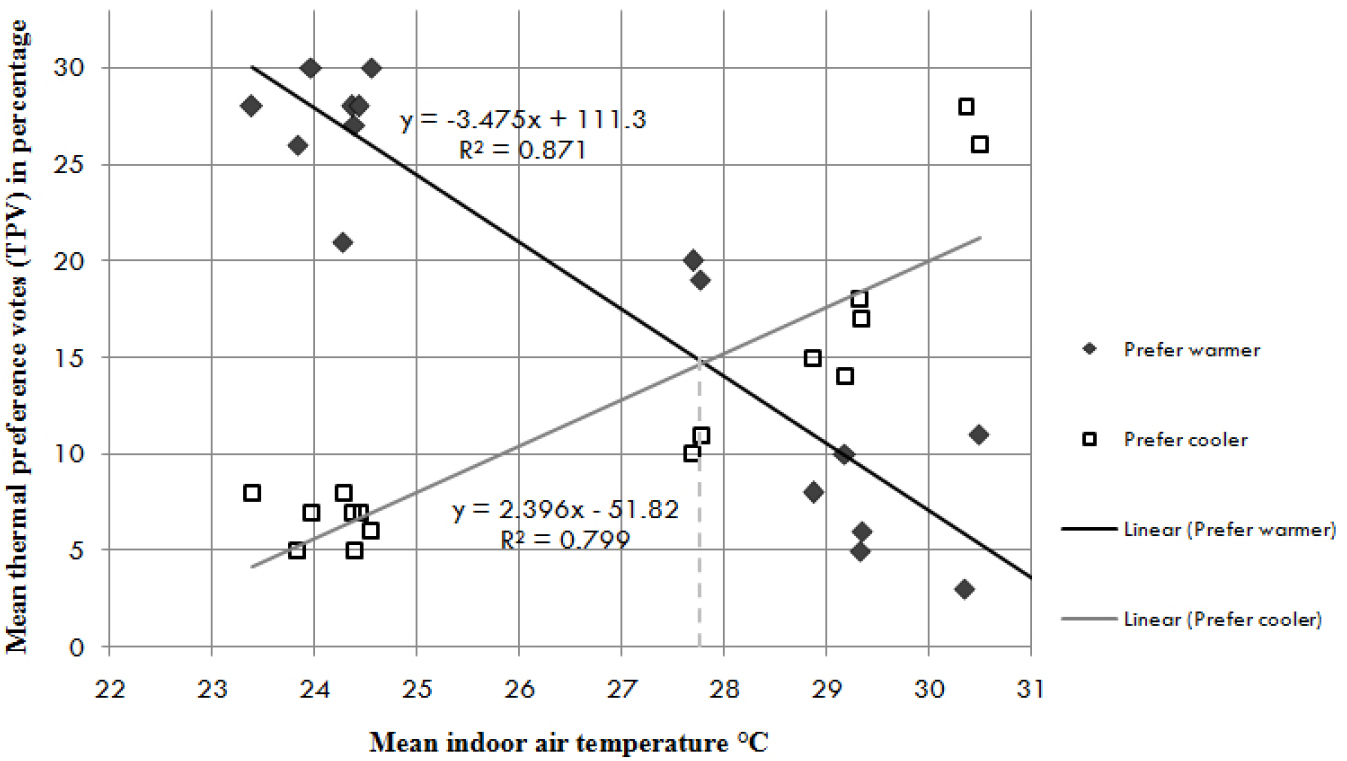
In order to investigate the relationship between neutral temperature and preferred temperature, the thermal preference votes were analysed with respect to the indoor air temperature of the buildings across the study, as shown in Figures 18, 19, and 20. The preferred temperature was found to be 28°C in Building 1, 27.5°C in Building 2, and 27.8°C for the overall study. These results indicate that the neutral temperature obtained coincides with the occupants’ preferred temperature.
Indoor temperature as a function of outdoor temperature
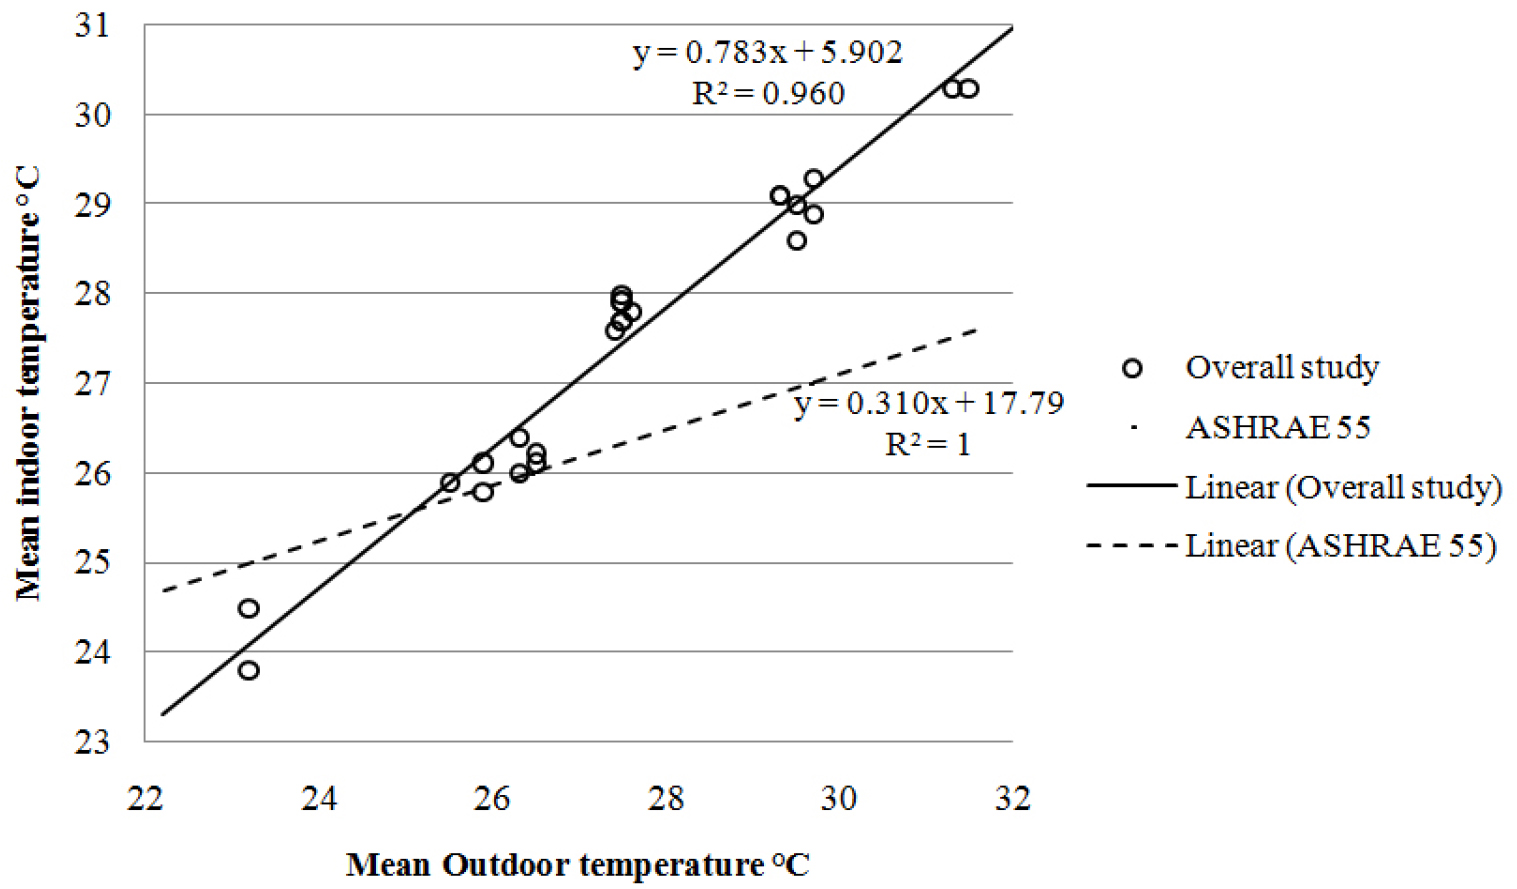
Figures 21 and 22 illustrate the method of Regression analysis of the dependent variable “outdoor air temperature” on the independent variable “indoor air temperature” for the neutral thermal sensation vote was applied on both the buildings throughout the study to derive equation 10, 11, and 12.

Equation 10. Relationship between indoor air temperature (Ti) and outdoor temperature (To) for comfort neutrality in Building 1.
Equation 11. Relationship between indoor air temperature (Ti) and outdoor temperature (To) for comfort neutrality in Building 2.
Equation 12. Relation between Ti (Indoor air temperature) and To (Mean outdoor temperature) for both the buildings throughout the study.
The equations depicting the relationship between Indoor air temperature and outdoor air temperature derived from the study were compared to equation 13 as given in ASHRAE 55 standard.
Equation 13. Relation between Ti (Indoor air temperature) and Tmo (Mean monthly outdoor temperature) as given in ASHRAE 55 [2].
It is comprehensible from the result that the occupants in the study are more tolerant of the higher temperatures than those predicted by ASHRAE 55 [2].
Discussion
The buildings selected for the study were of distinct architectural styles, Indo- Saracenic style, and Contemporary style of architecture. It was observed that both the buildings included a few passive-design features that are a part of the climate-responsive architecture in Hot and Dry climatic zones. The methodology used in the collection of data was successful and confirmed to be consistent with other studies in this area. From the inspection of the spaces under study, it was found that the mean airspeed in the room did not exceed 0.6 m/s, so it was not considered in the study. During the survey, it was observed that the opening and closing of the window allowed desirable ventilation in the rooms in September, although it did not create any significant difference in the airspeed of the room.
It was further observed that the occupants in Building 1 were ignorant about the opening and closing of doors and windows for ventilation whereas, occupants in Building 2 operated the windows as per the requirement. This may be because the occupants in Building 1 spend less time in one room while the occupants in Building 2 spend maximum time of their entire year in one allotted room due to the difference in teaching patterns in both the departments. The occupants’ adaptation is clearly evident in the style of clothing, which is strongly based on the outdoor temperature, and the addition or removal of layers of clothing is primarily the preferred form of adaptive control by the occupants in winter. The occupants were uncomfortable in the rainy season due to the relative humidity level of 67% to 73%. In contrast, although they preferred a slightly warmer temperature in winters, the occupants felt satisfied in a slightly cool environment because of the pleasant winters in a hot and dry climate.
Table 12 illustrates that the neutral temperature and comfort temperature range obtained from the study is higher than that predicted by ASHRAE 55 standard [2], while it confirms that stated in SP41 and NBC 2016.
Table 12.
Summary of the neutral temperatures and comfort temperature range given in standards and obtained from the study
Conclusion
Some of the occupants, although thermally satisfied, were dissatisfied with their overall environment and vice versa. A further discussion with these occupants led to psychological factors that probably affected their comfort and are mentioned as follows
∙Interest in the choice of the stream affected the occupants’ perception of their environment positively, resulting in a more tolerant and adaptive behaviour
∙A sense of belongingness to the classroom and its interiors, which includes painted walls, proper illumination, student display boards, and other furniture, resulted in the occupants’ satisfaction level in Building 2 being more satisfied with their environment as compared to those in Building 1.
∙Constant surveying affected their responses to the survey questionnaire
∙The occupants preferred a lower temperature before a class test or a submission than the neutral temperature acceptable to them on the regular days.
Future scope
The survey employed was a transverse survey and was limited to the occupants of the classrooms of the two buildings of study because of time constraints. Including a larger sample size from different spaces of the buildings as well as surveying more buildings of the institute will produce more accurate results along with a more accurate analysis can be done on physical as well as psychological parameters that affect occupants’ comfort. Further, simulation software can be used to study the role of passive-design features and increase their efficiency. This would help in setting elaborate guidelines for designing educational buildings that are energy efficient as well as are thermally comfortable for the occupants.