

Introduction
Peri-Urban Area
Contribution
Recent Research Work: A Brief Review
Background for the Research Work
Research Objectives
Synthesis of the Identified Effects of Unregulated Development in Fringe Areas on Transportation Scenario
Fringe Area around Pune City : Geographical Definition and Status in Regards to Unregulated Development
Exploratory Research-Justify that Pune city faces the identified issues due to un-regulated fringe area development
Design and creation: set of guidelines un-regulated fringe areas development specific to identified effects or sub effects:
Experiences from Other Countries:
Road Accidents and Emerging Social Issues
Verification of Pune City’s Issues
Set of Guidelines to Control Unregulated Development
Hypothesis Testing
Findings
Research Methodology
Data Collection
Pre-processing using Coherence Shock Filtering
Feature Extraction using PCA
Prediction of Effects on Fringe Area Development Status Using CNN
Optimization using Komodo Mlipir Optimization Algorithm (KMOA)
Result and Discussion
Conclusions
Introduction
Urbanization is a defining characteristic of the contemporary world, shaping the landscapes of cities and their surroundings. Pune, often referred to as the “Oxford of the East,” stands as a testament to this phenomenon, experiencing rapid growth and transformation [1, 2, 3, 4]. As the city expands to accommodate its burgeoning population, the areas on its outskirts, known as peri-urban zones, have become a focal point of dynamic change. This research delves into the intricate relationship between unregulated fringe area development and its profound impact on Pune’s transportation network. Peri-urban areas, lying in proximity to Pune but beyond its municipal boundaries, have undergone rapid and often chaotic development. Attracted by factors such as affordable housing and driven by socio-political pressures, these areas have witnessed hasty urbanization [5, 6, 7, 8]. Unlike the well-planned development within the city’s administrative borders, these fringe regions have experienced growth with minimal adherence to legal formalities and urban planning regulations [9, 10, 11, 12]. This paper seeks to unravel the complexities surrounding this phenomenon.
The issue of unregulated fringe area development has persisted as a subject of debate and contention since India’s independence [13]. Landlords and landowners, influenced by political and social forces, have undertaken land development endeavors without rigorous adherence to local planning authority rules and regulations. Within the municipal council limits, development follows a structured path guided by urban planning guidelines, but beyond these boundaries, it often takes on an unauthorized character.
This research aims to shed light on the multifaceted challenges arising from unregulated fringe area development around Pune [14]. By exploring a range of factors - encompassing socio-demographic, economic, political, physical, environmental, and transportation dynamics - this paper endeavors to provide a comprehensive understanding of the issue. In doing so, it seeks to serve as a guiding resource for all stakeholders, offering insights into critical measures and policies necessary to foster systematic and sustainable growth in these areas beyond the city’s fringe [15, 16, 17, 18, 19, 20].
Peri-Urban Area
The surrounding area of a larger city comes under the influence of city itself. Such area is called as ‘peri-urban area ‘or fringe area. It is having urban-rural mix type growth or development. It comes within limits of regional planning. It lies beyond limits of the Municipal Corporation or planning authority. The zone of peri urban area varies from city to city. It is different for different city as well has different geological & geographical situation. The outline of it is not having particular form. It is guided by transportation availability. Economic activities and transportation network is interrelated. It is dynamic. It rules the form of city. Hence peri urban area responds to it. It results into change in boundary. The method to examine zone of influence is to represent area served by employment, land use ratios, other socio-economic activities, amenities, purpose of journey, and frequency of movement and speed delay on the map. It is applicable at all level in urban hierarchy. This has more impact on land use and its development.
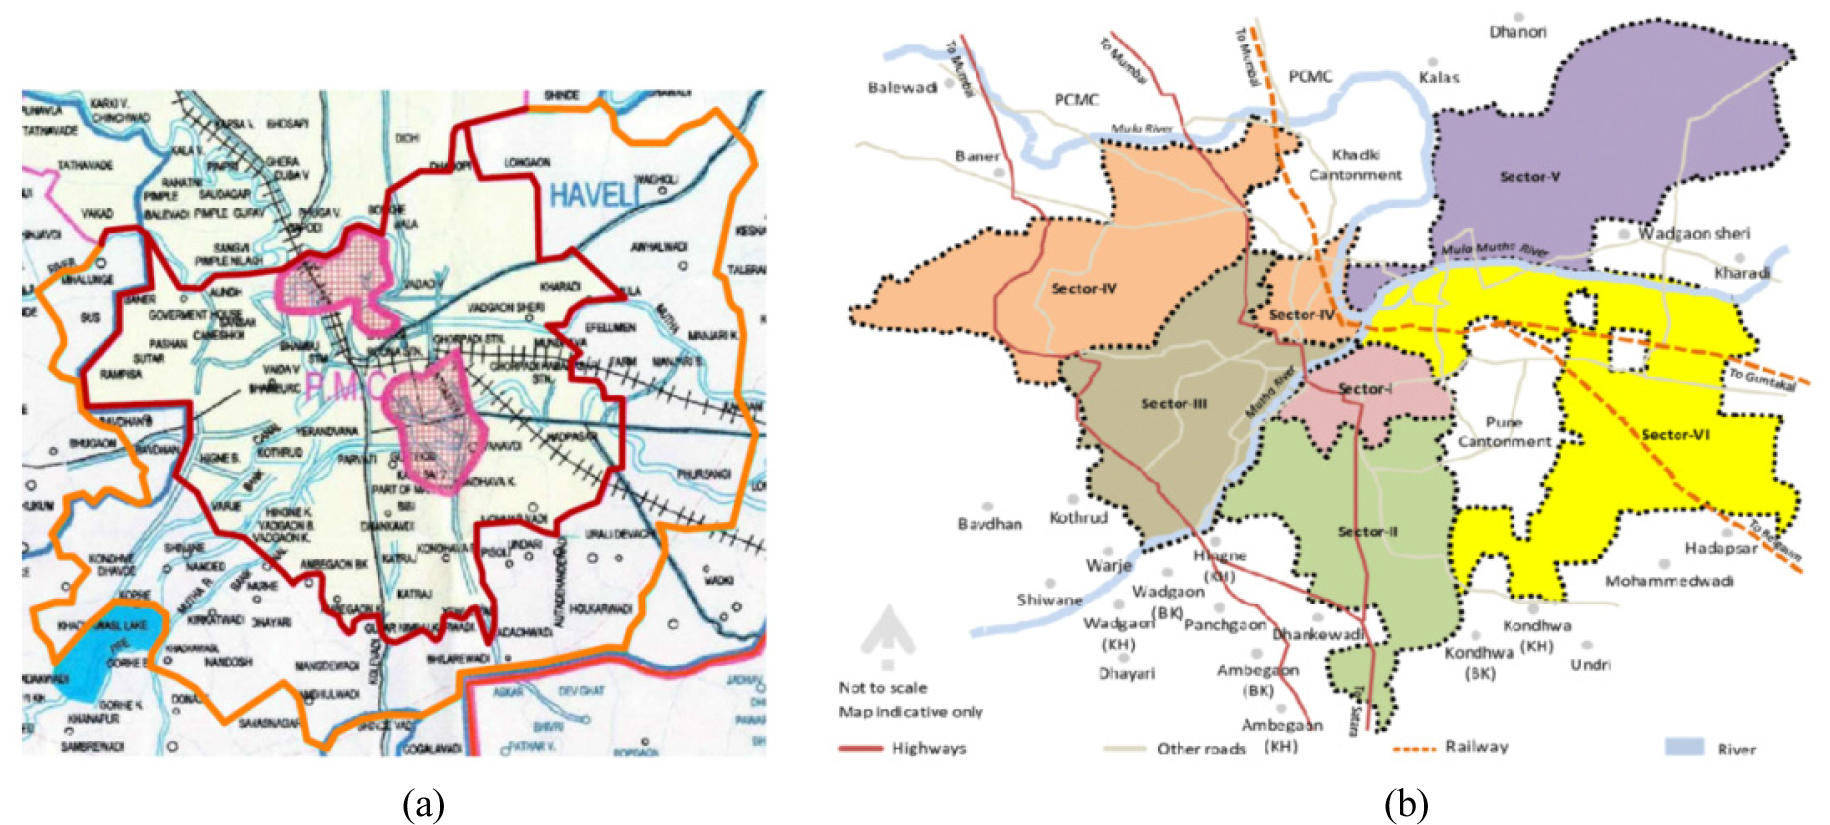
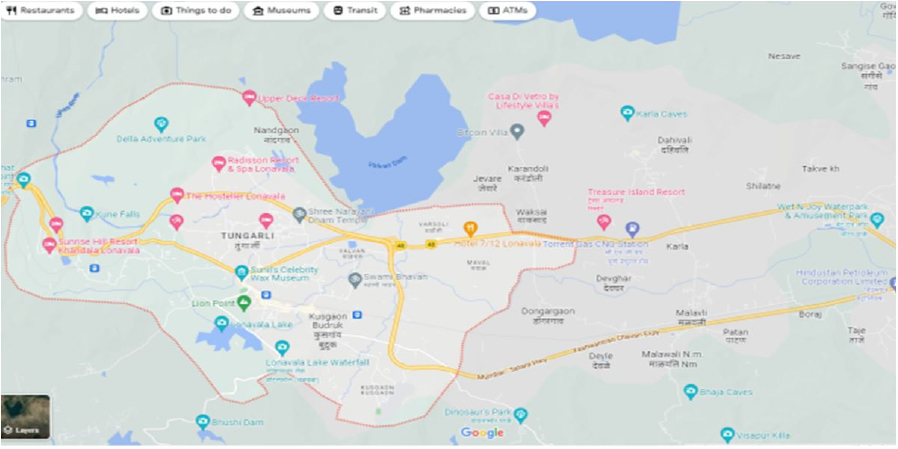
The city area is well guided by development plan with proposals of various land uses and its potential. Beyond the limit though there are regional plan guidelines but somehow it is observed fail to implement at larger interest of the stake holders and political pressures. These areas are not regulated its growth as like land use development plan. It leads to high density residential or other uses without infrastructures. The structures which are constructed are without development control rules and regulations. This gives birth to increase in density, narrow road patterns very few amenities and facilities. As per Maharashtra land revenue act the land immediate after the boundary of planning authority up to 3.5 has more impact on the parent city. But in within due course of 29 years span it start development without any land use or conceptional planning porch. The finally the services like water supply, drainage, garbage collection and disposals mostly tabbed from the boundary level facilities provide by Municipal or local planning authorizes. This may result into increase the load on municipal services. This needs more control measure to enhance economy of the parent city as these are without any revenue to the planning authority. The (a) Pune Municipal Corporation limit, (b) Sectors in Pune city shows a Figure 1.
Earlier the areas beyond first limit were peri urban area. These areas were merged into Pune Municipal corporation new limit as per notification by the state government and planning authorities. Some of the areas which are added were settlements, villages too. There was only control of Collectorate of Pune and local panchayat of that village. Most of these areas are at large scale developed haphazardly by leaps and bounds without any land use planning. After the most of the unregulated development took place without infrastructure then 23 villages were added in new limit in 2007.
Contribution
Below is a summary of the primary contributions made by this manuscript:
•The prediction of effects on fringe area development status around pune city on transportation scenariousing Convolutional Neural Network optimized with Komodo Mlipir Optimization Algorithm (FADTS-CNN-KMOA) is proposed.
•At first, the dataset are gathered via the dataset of Landsat 5 dataset. Afterward the dataset are fed to pre-processing.
•For pre-processing the Coherence shock filtering method is used. It achieves data pre-processing for reducing the noise in the dataset.
•The pre-processed result is provide for the segment of feature extraction. For feature extraction, the Principal Component Analysis (PCA) method is used. Its operation involves identifying a collection of fresh variables, referred to as principal components, which are linear mixtures of the actual l variables and effectively captures the highest amount of variance within the dataset.
•After the subsequent processes of pre-processing and feature extraction the output is fed into the prediction method. Convolutional Neural Network is used for the prediction.
•Then the Komodo Mlipir Optimization Algorithm (KMOA) is used for the optimization of the predicted output from CNN.
•The proposed FADTS-CNN-KMOA approach is simulated by MATLAB utilizing the dataset of Landsat 5.
•The performance metrics, such as Precision, Accuracy, Traffic congestion, and Economic growthare analysed to analyse the performance of the proposed technique.
•The obtained outcome of FADTS-CNN-KMOA approach is analysed with existing methods, such as Recurrent Neural Network (FADTS-RNN), Random Forest Algorithm (FADTS-RFA), Spiking Deep Neural Network (FADTS-SDRN).
The remaining sections of this manuscript are organized as follows: sec. 2 analyses a literature review, sec. 3 explains the research objectives, sec. 4 presents the research method. Sec. 5 shows the result and discussion, and sec. 6 provides a conclusion.
Recent Research Work: A Brief Review
Numerous studies in the existing literature have explored the impact of fringe area development status around Pune city on the transportation scenario. A portion of the works were analyzed here.
Yang et al. [21] designed a hybrid cellular-automata method to assess the dynamic changes in urban settings. A Markov chain (MC), cellular automata (CA),a geographic partition, and a multi-layer perceptron artificial neural network (MLP-ANN) comprised the method. From 2000 to 2015, the Ganjingzi District was spatially grouped using multivariate land use data, and landscape status evolution was simulated using a divisional composite cellular automaton model. Ganjingzi District had increases in construction and forest land areas of 19.43% and 15.19%, respectively, between 2000 and 2015. Conversely, there were decreases in garden lands, farmland, and other land areas of 52.14%, 43.42%, and 75.97%, respectively. Each land use sub-region change potential have its own distinct geographical features. Koch et al. [22] presented a hybrid cellular automata (CA) and agent-based modeling (ABM) technique for examining the dynamic interactions of land-owners choices to sell their property for growth and the consequent lands-cape fragmentation patterns. Our technique was based on other conceptual structures in land-systems model, with an agent-based modeling included into the well-established grid-related land-change model, FUTURES. Landowner agents in the ABM make decisions about selling property to developers based on a variety of preferences and peer factors, notably spatial neighborhood connections. Tennøy et al. [23] have examined the total CO2 emission consequences of rearranging whole-sale warehouses from central regions and exchanging them with more spatially efficient actions, a combination of residences and place of work that might have been situated in peripheral regions. This urban development trend was underway in numerous urban areas, often as part of strategies to reduce CO2 emissions from transportation. Yet, the effectiveness of this approach have not been extensively studied.
Gizelis et al. [24] have proposed that the swift urbanization occurring in Africa has generated a complex set of challenges on the urban periphery, resulting in heightened tensions and social unrest. As urban populations continue to surge, the outskirts of African cities experience rapid and often haphazard growth characterized by informal settlements, inadequate infrastructure, and limited access to essential services. These circumstances create fertile ground for the emergence of conflicts as marginalized communities grapple with issues such as land ownership, resource scarcity, and social exclusion. Additionally, environmental stressors, including the impacts of climate change, pollution, and resource depletion, further intensify vulnerabilities, leading to disputes over limited resources and increased risks of displacement. This study delves into these intricate dynamics, drawing from a range of case studies across the continent, and emphasizes the urgent necessity for comprehensive and inclusive strategies that address both the social and environmental aspects of urbanization in Africa, with the goal of establishing sustainable and harmonious urban futures. Halder et al. [25] have examined the dynamics of land use and cover changes, analyzed land surface temperatures, and conducted correlation studies involving LULC, LST, NDBI, and NDVI. The extent of built-up areas increased over the years, comprising 22.01% in 1990, 31.44% in 2000, 44.21% in 2010, and 55.768% in 2020. The annual temperature exhibited a gradual increase of 0.157 ◦C per year. The relation between NDVI and LST displayed a negative correlation, attributed to vegetated areas being affected by urban expansion. Conversely, the relationship between NDBI and LST showed a positive correlation, linked to anthropogenic activities. For predicting land use and cover in 2030 and 2050, CA-ANN was employed to anticipate future urban expansion and environmental changes. Proper planning in these areas is essential for fostering healthy livelihoods and environmental preservation, as neglecting these aspects could result in the adverse impacts of climate change on the entire region. Pan et al. [26] have devised a comprehensive method for modeling greenhouse gas (GHG) emissions associated with urban growths, using Stockholm County, Sweden as their case study. GHG projections extending to 2040, derived from a social-ecological system model, revealed higher overall emissions compared to straightforward extrapolations found in official climate action planning. The highly notable variance in emissions was 39% higher from the usage of energy in single-residence constructions due to urban-sprawl, a factor not considered in the basic extrapolations. Tong et al. [27] have delved into the complex dynamics of land development, emphasizing its intricate interplay with various natural and social factors. In the context of China’s urbanization process, where the dual land ownership system prevails, distinguishing between state-owned and collectively-owned lands, this research becomes particularly relevant. It sheds light on how collective-owned rural land, situated on the fringes of urban areas, undergoes rapid transformation for urban use, following two primary trajectories: 1) Land expropriation by the government, leading to state ownership and primary land development. 2) Collective landownership retention, where villagers collectively convert undeveloped land into built-up areas, bypassing government expropriation. The crucial aspect examined here was the change in land ownership and its potential correlation with land development. By constructing a logistic regression model, the study focused on Shenzhen, China, a city marked by extraordinary urbanization and a distinctive dual land ownership structure.
Background for the Research Work
The focus of this study is to investigate the unregulated development within the fringe areas surrounding Pune city and its profound impact on the transportation scenario. These fringe areas, expanding nearly 10 kilometers from the Pune Municipal Corporation (PMC) limits, have experienced unchecked growth without proper approvals or adherence to guidelines. Notably, the development along the main entry points and internal roads connecting to the primary routes is starkly incongruent with road width, with internal roads often measuring between 3.0 to a maximum of 6.0 meters, or even less. This mismatch between development and road capacity results in inadequate space for both vehicles and pedestrians, exacerbated by the lack of sufficient parking facilities, forcing vehicles to occupy road spaces. Furthermore, the construction of marriage halls and hotels along roadsides contributes to heavy traffic during events, causing congestion. Exit roads, unfortunately, serve as dumping grounds, accumulating debris and waste materials due to frequent traffic jams. The presence of food stalls and hawkers, both in temporary and concrete structures, further compounds the issue, as passersby park their vehicles on the road, leading to additional traffic congestion. Notably, political rallies and festive processions, such as Ganpati or Navratri festivals, occasionally result in complete traffic standstills that persist until the events conclude.
Research Objectives
Synthesis of the Identified Effects of Unregulated Development in Fringe Areas on Transportation Scenario
The Pune city has extended limit which merged about 23 villages in the corporation limit [28]. Beyond this limit there are the fringe areas which are located in between the main entry and exit points of city, these are as follows.
Fringe Area around Pune City : Geographical Definition and Status in Regards to Unregulated Development
The Geographical definition and status in regards to unregulated development shows a Table 1. The area immediate beyond the limits of local planning authority is known as fringe which has entries from above roads and other too. The boundaries of such areas are not exactly defined by planning authority of any sort of marking. This area may have more development along the main and secondary approaches or corridors. The road side or linear development is mostly prepared by the stake holders those who may native of that region. After publication of first development plan of Pune city the immediate area is already developed without any strategies planning and approval mechanisms. At entry and exist of city some buildings are constructed as per sanctioned plan some are without approvals but the roads are not developed as per DP plans which creates more traffic problems. No single thought was given on infrastructure, parking and traffic movement as well as social and ecological aspects etc. The roads width is not uniform and segregation of traffic is merely seen. Some segments are zigzag type which slow down the speed.There are marriage halls along the roads side which create more traffic problems at certain period. Not adequate parking facilities available within these areas. Most of the garbage is thrown on either side of the tar roads; this creates traffic jams and over flooding the roads in rainy season and leads to traffic jams.
Table 1.
Geographical definition and status in regards to unregulated development [35]


Exploratory Research-Justify that Pune city faces the identified issues due to un-regulated fringe area development
Pune City’s fringe areas serve as a case study for assessing and establishing policy guidelines for the development of regions immediately beyond the local planning authority limits. Pune enjoys robust connectivity with various regions of Maharashtra, including western Maharashtra, Marathwada, Vidarbha, and the Kokan region. The city is strategically located along major transportation arteries, including the Mumbai-Bangalore national highway, Pune-Solapur national highway, Pune-Ahmednagar-Aurangabad national highway, and Pune-Baramati state highway. Additionally, it boasts well-maintained routes like Pune-Saswad road, Pune-Mahad state highway, Pune-Bhor major district road, Pune-Satara Road national highway, and Pune-Lonawala state road.
Along these roadways, numerous land pockets are owned by landlords just beyond the local planning authority’s jurisdiction. Many migrants seek accommodation along the roads leading to their hometowns. However, the demand and supply of housing in these fringe areas are often met by landlords in an unregulated manner, leading to unhealthy development patterns. Consequently, this contributes to traffic congestion and disrupts the pace of city life. Compounding the issue, government authorities sometimes regularize these insufficient housing structures without adhering to a master planning concept, often influenced by political factors. This further encourages developers to bypass the standard application of rules and regulations, eroding the city’s control over the development process.
Design and creation: set of guidelines un-regulated fringe areas development specific to identified effects or sub effects:
To ensure sustainable and well-planned development in the peri-urban areas surrounding Pune City, several crucial measures need to be implemented. Firstly, it is essential for the respective state government to enforce clear peri-urban limits and draft development plans in line with regional plan guidelines. These limits and plans will serve as a framework for orderly growth in these areas. Secondly, strong governance mechanisms are imperative to curb unauthorized construction and development activities beyond the municipal limits. This enforcement will help maintain the integrity of the development plan. The development plan for peri-urban areas should prioritize a balanced land use strategy, addressing the need for controlled and sustainable development. Additionally, it should pre-identify suitable locations for garbage disposal and dumping grounds, as well as plan the road network meticulously. This proactive approach will help control haphazard growth and ensure efficient waste management.
Furthermore, attention should be given to the road infrastructure, particularly the entry and exit points and irregular roads. Efforts should be made to upgrade and straighten these roads, improving connectivity and reducing traffic congestion. To accommodate the needs of public activities and commercial zones, the creation of parking bays is essential. This will help alleviate parking-related issues and ensure smoother urban mobility.
Lastly, when planning public buildings like marriage halls, schools, hospitals, and small-scale industrial areas, it is crucial to allocate higher margins for exclusive parking. This foresight will prevent parking chaos and ensure safe access to these facilities. In combination, these measures will contribute to the orderly and sustainable development of Pune City’s peri-urban areas, fostering a balanced and efficient urban environment.
Experiences from Other Countries:
In the United State, through Federal and State initiatives long term land use planning is coordinated through important actions like air quality controls and transportation facility planning. There is emphasis on clear policy of compact physical development around transit stations and their routes. The problem becomes one of achieving a balance between efficient road and public transport systems in the future city.
Most of the planning authority varies from city to city and region to region. Pune Municipal Corporation has its limit and beyond it the regional planning is applicable. It has a control of collector of that district. But there no any governance to control the development as per proposed land use planning. Before the proposed plan will come into enforce all the constrictions are developed without any bye laws & infrastructure.
Other countries have a strong mechanism to control the land use planning as per guided policy of those local planning authorities. As after the certain limit of municipal council there are buffer areas or green area where no construction will be permitted. The road proposed in development or regional plans are initially developed along with the integration of old cities to peri-urban area of next areas become comfortable and sustainable.
British cities are different from Australian in terms of their nature and lifestyles. European cities have much higher densities than in Australia. From the previous experience the green belt barrier has produced limited success in Britain to control development of urban sprawl. To achieve a balance between efficient road and public transport systems in the future city is a prime task to develop peri-urban or fringe areas.
Road Accidents and Emerging Social Issues
One of the most significant negative consequences of the increasing traffic on Asia’s roadways has been the surge in road accidents and the resulting congestion due to traffic jams.Beyond the fringe area the roads become irregular in shapes and sizes as well poor qualities. It does not follow the concept of road hierarchy. The entire road is mostly 3.0 m to 6.0 m wide. Some of the incoming roads are state highways, major district roads or national highways. As soon as we entered in the peri urban or fringe all these roads become narrow leading to the slowdown the traffics and increase in accidents. This leads further time consuming as well wasting of money on fuel.
Another part of this development is increase in parking problems. All the building which constructed is mostly without parking faculties and inadequate marginal spaces leads to park the vehicles on the roads. The budlings which are developed are not as per principles of land use planning. This creates traffic jams in each sector of the peri urban areas.
Social issues such as marriages, political rallies, funeral functions, cultural activities and festival’s time this area become highly overcrowded so the road become dead till activates are not finish. This may lead to increase community quarrels and developed the criminal region [29].
Verification of Pune City’s Issues
Generally, the situation in the transport sector around the Pune city can be described as follows:
•Increase in traffic of individual modes of transport is unbalanced and this imbalance among them still Increasing day by day due to non-availability of public transport. Congestions occurs on main roads and at entry junctions immediate at entry and exist points.
•The existing transport infrastructure is in bad and not adequate repair unplanned development in the fringe areas.
•The control of roads is under various planning authorities. Highways and state highways are under the control of ministry of transportation government of India. Some roads are belonging to the ministry of state highway government of Maharashtra. Some roads are under the control of Zillaparishad and Panchayatisamiti and cantonment zone. That all should be brought under one umbrella as a window approach for control and development.
•The development is as per size and shape of land pocket and need of the stake holders. The amalgamations and group development are highly neglected. This may lead very low-quality work and without applications of rules and regulations.
Set of Guidelines to Control Unregulated Development
Presently there are no adequate guidelines for the development of fringe areas. Only areas beyond the municipal limit of the regional plan are on the paper. If it is a judicial matter, the respective department observes it and takes action. Otherwise, for several years, the cycle of unregulated development will continue. The guidelines for such control should be:
•To confirmation of the boundaries of the peri-urban area to distance or natural resources.
•To identify the settlements within these pockets to create a special development plan of the areas in consideration with the city as well peri-urban areas.
•Incorporate and align the all the infrastructures such as roads, water supply, drainage and garbage disposals within the peri urban areas along with city development plan.
•The development plan of peri urban is needed to publish at the time of the development plan of the parent city for the stake holder’s perception and opinions.
•The focus must be given to the infrastructure and land use along with the development of amenities and facilities pocket before the commencement of other built areas.
•The proposed roads in the development plans and regional plans must demarcated with visible road boundaries along with equal width throughout to have control of development.
•As far as possible the development after the road boundary must be controlled digitally and impose heavy penalty for such unauthorized growth.
•The roads within city and the fringe must be constructed as per standards of constructions. Care should be taken for storm drain out system easy way which will not damage the road network.
•All the public building such marriage /multipurpose halls and industrial areas must be approved as per MRTP act –1966 to avoid the traffic congestions.
Hypothesis Testing
Hypo-1: The roads within the peri-urban area developed as far as possible straight and equal width. Needs to provide adequate parking areas for the various types of buildings and structure as per the rules.
Hypo-2: Unauthorized structures and development must be controlled by imposing strong governance. The parking provision was made mandatory with minimum basic facilities.
Findings
The current state of roads within the fringe areas around Pune City reveals several challenges. Firstly, the existing road infrastructure is inadequate to accommodate the growing traffic demands in these areas. Secondly, the roads themselves often exhibit a zig-zag pattern, lacking uniformity in width at various intervals, which disrupts the flow of traffic. Moreover, the absence of adequate parking facilities along these roads, as well as at the building level according to typology, compounds the transportation issues. Furthermore, a significant portion of the buildings in these areas are unauthorized constructions, built without adhering to basic building rules and often lacking essential marginal spaces. Addressing these issues is paramount to enhancing transportation and overall infrastructure in the peri-urban regions, and promoting safer and more efficient urban development.
Research Methodology
The block diagram of the proposed methodology shown in Figure 2.

Data Collection
For data collection of satellite images, we have referred to the Landsat database, which is a combined program of the US Geological Survey (USGS) and NASA [30]. It is a free database. It has data from year 1972 and provides the fair spatial resolution (30 meters) needed for LULC. The Landsat satellites are a series of Earth-observing satellites orbiting in a sun-synchronous, near-polar orbit and have been operational since 1972.
Particularly, we have referred to the Landsat 5 satellite data, which provides images from 1984 to 2013, and the Landsat 8 dataset, which provides data from 2013 to 2021. There is a difference in the sensors carried by Landsat 5 and Landsat 8. Landsat 5 carries the Multispectral Scanner (MSS) (visible and near-infrared) and the Thematic Mapper (TM) (visible, near-infrared, thermal, and mid-infrared) sensors, while Landsat 8 carries the Operational Land Imager (OLI) and the Thermal Infrared Sensor (TIRS) instruments. We have taken data from collection 1 (a consistent archive of known data quality), the Surface Reflectance (atmospherically corrected surface reflectance dataset) and Tier 1 (data that meets geometric and radiometric quality requirements) dataset.
The shapefile for the administrative boundaries of the study area is taken from the Pune Municipal Corporation website. We have employed the Google Earth Engine Developer software for image preprocessing and supervised classification of the data points.
Pre-processing using Coherence Shock Filtering
In this step, Coherence shock filtering (CSF) performs the data pre-processing, which is utilized for reducing the noise in the dataset. By the CSF filter,the data is conserved, and then noise is detached [31]. The approach extracted the pre-processed output-data. Additionally, the values of the collected data are based on a range-decreasing technique, which is followed by the data using the values of output. This approach produces data with a significantly broad variety of species and biological systems while maintaining the accuracy of its characteristics. Consider 2 distributions have qualitative data of and , here represents quantitative data, scale is strictly lower than the scale , CSF filter-template, is computed in equation (1),
where 𝛽 denoted as digital landscape planning, represents the landscape design paradigm, , represents qualitative data and the distance from the ideal error wherein CSF filter final design is computed by equation (2),
where, implies the co-variance matrices, the landscape information, and local landscape for data identification is shown in equation (3),
where, and implies spatial representations, implies the actual circumstances. When the peak filter becomes wider and shorter, the negative lobe deepens and improves far from the origin.
Feature Extraction using PCA
Principal Component Analysis is a mathematical method for feature extraction and dimensionality reduction [32]. It finds a collection of new variables, known as principle components, by combining the original variables in a linear fashion to capture the highest variation in the data. Here, the equations and steps for PCA is given below:
Let’s assume we have a dataset with data points and original variables are represented as matrix , from which, each row specifies the data points and each column specifies a variable.
Step 1: Data Standardization
Standardize the data by subtracting the mean of each variable from every data points and dividing it by the standard deviation of that variable eqn (4):
where implies the value of standardization of the -th data point for the -th variable
Step 2: Covariance Matrix
Compute the covariance matrix of the standardized data eqn (5):
where is the transpose of the standardized data matrix.
Step 3: Eigen value Decomposition
Perform eigen value decomposition on the co-variance matrix to find its eigenvectors and eigen values. The eigen values specifies the variances described by each principal-component, and the consistent eigen-vectors implies the directions (loadings) of these components in eqn (6).
Step 4: Sort Eigen values
Sort the eigenvalues in descending order and arrange the corresponding eigenvectors accordingly. This orders the principal-components by the quantity of variance they explain.
Step 5: Select Principal Components
Choose the top eigen-vectors, from which implies the counts of principal-components you want to retain. Typically, you might choose to retain a certain percentage of the total variance (e.g., 95% or 99%).
Step 6: Feature Transformation
Transform the original data into a new dataset by projecting it onto the selected principal components eqn (7):
where is the matrix of transformed data, is the standardized data matrix, and is the matrix of the top- eigenvectors
Step 7: Interpretation
Analyze the loadings of the principal components to understand which original variables contribute the most to each component. These loadings can provide insights into the meaning of the principal components.
PCA is a powerful technique for reducing dimensionality and extracting features from data while retaining as much information as possible. The transformed dataset can be used for various data analysis and modelling tasks.
Prediction of Effects on Fringe Area Development Status Using CNN
In this section, the structure of the Convolutional Neural Network (CNN) used for predicting the effects of fringe area development status is shown [33]. The CNN is designed to analyze spatial data, such as satellite images or land use grids, and capture spatial features that influence transportation scenarios.
Input Layer
The input layer receives spatial data with dimensions (height, width, and channels). Let’s denote the input data as .
Convolutional Layers
The convolutional layers apply convolutional-filters to the input data to improve spatial features. Each filter scans the input data and produces a feature map. The operation can be represented as follows:
For the first convolutional layer:
where is the output feature map of the first convolutional layer, is the number of filters in the first layer, is the size of each filter in the first layer, ReLU is the Rectified Linear Unit (ReLU) activation function, which introduces non-linearity.
Additional convolutional layers can be added to capture more complex features. The eqn for the i-th convolutional layer,
Pooling layers
Pooling layers down samples the feature maps to reduce dimensionality and computation. The most common pooling operation is max-pooling. It can be represented as eqn (10):
For the first pooling layer:
where, : Output of the first pooling layer, : Pooling window size in the first layer. Additional pooling layers can be added as needed.
Flatten Layer
It converts the 2D feature-maps from the last convolutional layer into a 1D vecto, making the data for fully connected-layers. This can be represented as eqn (11).
where: : Flattened vector.
Fully Connected Layers (Dense Layers)
Fully connected layers are used for feature learning and prediction. For the first fully connected layer eqn (12):
where: : Output of the first fully connected layer, : Number of neurons in the first layer, Additional fully connected layers can be added as required.
Output Layer
The output layer produces predictions based on the problem being solved. If it’s a regression problem (e.g., predicting a continuous value), a single neuron with a linear activation function may be used. For classification problems (e.g., categorizing development status), multiple neurons with ‘softmax’ activation may be appropriate. The output can be represented as eqn (13):
where: : Final prediction, : Number of output neurons, : Activation function (e.g., ‘softmax’ for classification).
Optimization using Komodo Mlipir Optimization Algorithm (KMOA)
The parameter of the proposed APCNN is optimized using the proposed KMOA [34]. In this section, the metaheuristic optimization approach of KMOA using komodo intelligent behaviors is expressed. The Mlipir, a Javanese stride, and the behaviours of Komodo dragons in East Nusa Tenggara, Indonesia, inspired it. The few Komodo dragons in the KMOA population are divided into three categories based on their foraging and reproduction habits: big males, females, and little males.
Stepwise procedure of KMOA
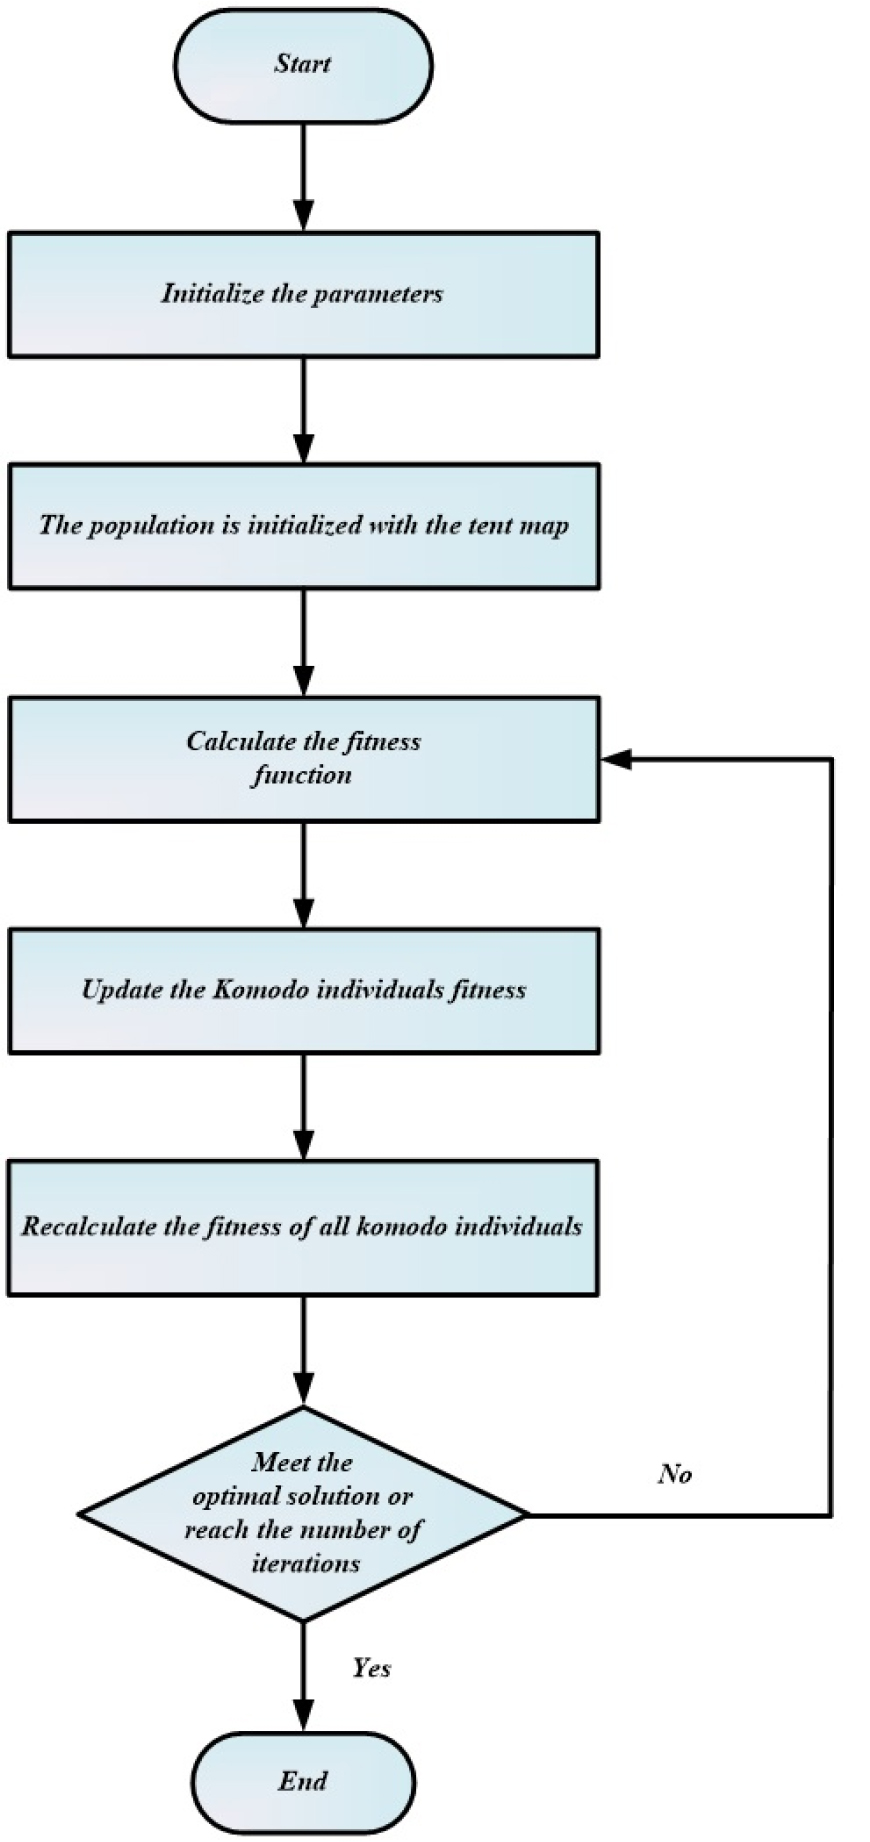
Here, a step-by-step procedure is defined to get ideal value of CNN based on KMOA. Initially, KMOA makes the populace equally distributed to optimize the optimum parameter of CNN. The ideal solution is promoted by utilizing the KMOA algorithm, and the related flowchart is given in Figure 3.
Step 1: Initialization
The Individual Komodos are classified into 3 collections: middle-quality females, higher-quality larger males, and lower-quality smaller males, with a fraction that is in (0, 1) range and set as 0.5 for each particular situation. The populance of Komodo is divided into big-males, 1 female, and tiny-males, as expressed in equation (14).
where is the number of big male komodos. However, a percentage is too tiny or too large can result in zero for . As a result, a straightforward strategy is utilised to entice both large and tiny males to interact with at least two Komodos.
Step 2: Random generation
The input-parameters are created at random. The best fitness value selection is relies on its explicit hyper-parameter condition.
Step 3: Fitness Function(FF) Estimation
The initialized evaluations are used to generate a random solution. The FF is assessed with a parameter optimization value for optimizing the parameter of the CNN. This is given in equation (15),
Step 4: Exploration phase
A female is designed as a middle-class individual to engage in discovery simultaneously. It happens with a predetermined probability of 0.5. By mating with a huge male and producing two children, the female in this expedition increases the practicable area around the global ideal solution. On the other hand, parthenogenesis widens the search area by diversifying the solution. The best-generated offspring eventually update the female. Furthermore, the mating of two Komodo is described in equations (16) and (17),
where and implies the dimension of , and ; and are the dimensions of two young ones. The symmetric normal distribution exhibited in equation (18), generates the little number at random.
where and are the lower and upper bounds of the dimension, random number, 𝛾 is the radius its value is 0.1,
Step 5: Exploitation phase for optimizing
In addition to engaging in some exploitation as low-quality persons, little males are expected to look for solutions across a wide range of areas. Each little guy backs away by randomly selecting a section of the large men’s dimensions with a predetermined probability rate. The Komodo movement is used to track the one is stated with a Milpir rate in the interval (0, 1) and is given in equations (19) and (20),
where , are random numbers, is the dimension, implies randomly chosen dimension, is the number of big males. The exploration is certain to be more likely than exploitation in this Milpir movement.
Step 6: Termination
The parameter values of the generator from the convolutional-neural-network are enhanced using KMOA, which will iteratively repeat until the termination criterion, .
Result and Discussion
Here, the result of the proposed FADTS-CNN-KMOA is discussed. The simulations are done in PC along keras and tensor flow. The outcome of FADTS-CNN-KMOA is analyzed with existing FADTS-RNN, FADTS-RFA, and FADTS-SDRN methods.
Accuracy
It is measured by following equation (21),
Precision
This is computed by following equation (22),
Figure 4 depicts the comparison of accuracy with existing and proposed amethods. The FADTS-RNN method has an accuracy of 85%. The FADTS-RFA method has an accuracy of 65%. The FADTS-SDRN method shows the accuracy of 78%. The proposed FADTS-CNN-KMOA method shows an accuracy of 99%, which is very high when compared with other existing methods. Figure 5 depicts the comparison of precision with proposed and existing methods. The FADTS-RNN method shows 75% precision. The FADTS-RFA method shows 90% precision. The precision of the FADTS-SDRN method is 63%. The proposed FADTS-CNN-KMOA method shows the highest precision of 98% when compared with other existing methods.
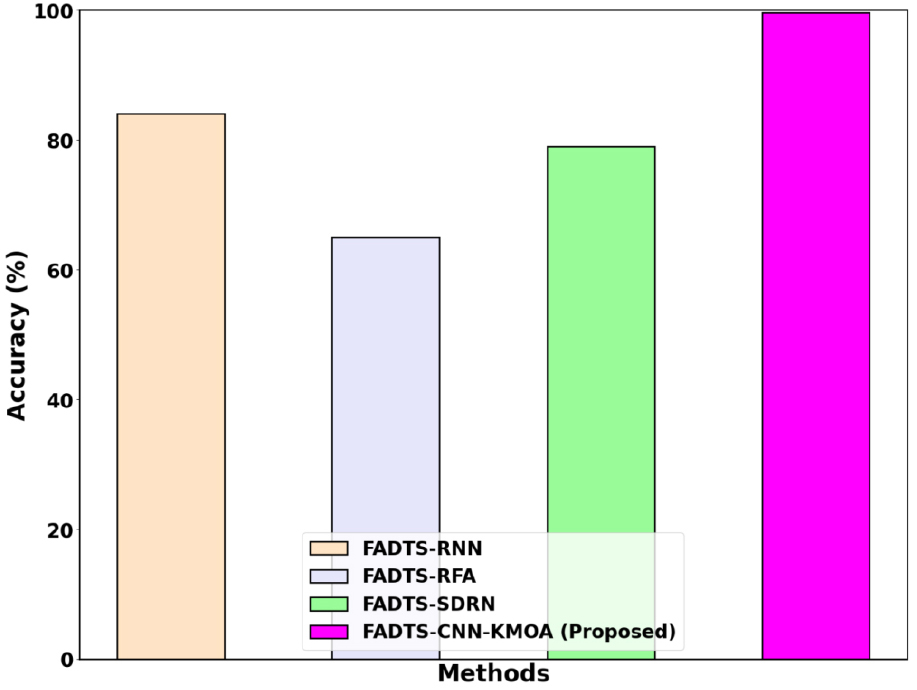
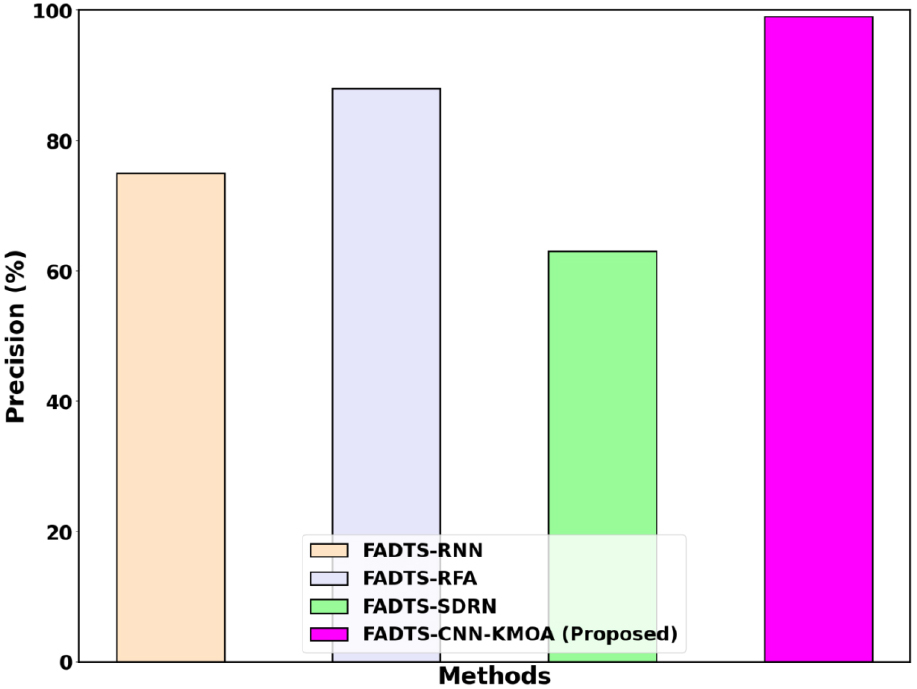
Figure 6 depicts the prediction of traffic congestion compared with existing and proposed methods. The FADTS-RNN method gives 69% of the prediction. The FADTS-RFA method gives 90% of the prediction. The FADTS-SDRN method gives a prediction of 76%. The proposed FADTS-CNN-KMOA method gives the highest prediction of 98% when compared with other existing methods. The prediction of economic growth compares with existing and proposed is shown in Figure 7. The FADTS-RNN method shows 79% of prediction. The FADTS-RFA method shows 65% of prediction. The FADTS-SDRN method shows a prediction of 90%. The proposed FADTS-CNN-KMOA method shows a 99% prediction. The prediction given by the proposed technique is very higher than the other existing methods.


Conclusions
The peri-urban area, extending over 10 kilometers beyond the municipal limit boundary, currently lacks any proposed land use plan, relying solely on the regional plan. This unregulated development occurs before the formulation of zoning and land use plans, resulting in reduced oversight from the parent city. Consequently, the burden on infrastructure often falls on the existing services within the parent city, as amenities and facilities for stakeholders beyond the peri-urban area remain uncertain. This uncontrolled and unauthorized development further exacerbates the situation by failing to generate revenue for the local planning authority, hindering the implementation of necessary proposals. Political pressure and the demand for affordable housing and other facilities have also played a significant role in this scenario. The management of garbage collection and disposal poses serious challenges both within and around the main municipal limits, adversely affecting the overall health of the city. Additionally, there has been inadequate consideration for meeting the demand for essential services such as water supply and storm water drainage in peri-urban areas. Furthermore, unchecked development has the potential to elevate crime rates, posing a future threat to the growth and development of the parent city. In addressing these critical issues, comprehensive planning and effective governance are imperative to ensure the sustainable and balanced development of the parent city and its peri-urban surroundings. This research proposed a FADTS-CNN-KMOA approach based on the prediction of effects on fringe area development status around Pune city on the transportation scenario. The proposed technique achieves higher accuracy than the existing one. In particular, it is confirmed that the use of feature extraction using the Principal Component Analysis (PCA)approach enhances the accuracy and precision. The proposed technique is executed in MATLAB. The outcome shows that the proposed method shows the highest precision and accuracy of 98% and 99%, respectively when compared to existing FADTS-RNN, FADTS-RFA, and FADTS-SDRN methods.
