

Introduction
Importance of visual place quality: a Review
Identification of Visual Quality of Place (VQP) Parameters
Case study of Dharamsala region
Methods and Tools
Research Tools
Application
Results and discussion
Conclusion
Introduction
The “Place quality” of urban space is considered the most valuable parameter of a developed or developing urban landscape. Natural elements play a crucial role in improving the aesthetics of constructed ecosystems, specifically in degraded urban and rural areas [1]. Similarly, both landscape elements and urban furniture in rural-urban areas are also very significant in enhancing the visual consistency of urban areas. The importance of urban infrastructure has a particular role to play in increasing the visual quality of place. Research studies in this context have discussed the effects of psychological and behavioural perceptions of visual artistic quality in urban areas [2, 3]. An urban town may consist of the industrial, tourist, religious, commercial, or educational setup of a city, which create the first image of a city. In this, major elements of urban design not only improve the city’s image but also the basic infrastructure for urban cities. If a city or town lacks basic infrastructure, it will lead to a degraded aesthetic value and increase the problems faced by its users in the future. Researchers have shown that the general principle of the formal organization of urban areas is the most valuable attribute for perceptions and the evolution of visual place quality [4]. People’s perceptions change over time to enjoy a pleasant environment and view. Research studies have worked towards fostering awareness of the visual quality of the place in the built environment [5]. In Europe, during the 1990s, social movements like “Reclaim the Streets” held demonstrations to highlight the factors influencing people’s understanding of public spaces. Some researchers employ the ancient Roman phrase “the genius loci” to express a “sense of place” [6]. This idea is crucial in city and regional planning and place management today. Planners can’t change a location without destroying its best features if they don’t grasp the different elements that make up the essence of the area. Some research studies have suggested ways which can help in augmenting tourist potential and accelerate economic development by considering the physical appearance of a location [7, 8].
A city’s visual image is a significant tool for attracting tourists and projecting the overall image of the city at a regional and national level. This further attracts investors for the purpose of harnessing funds for social, physical, and economic development, bringing the city to people’s attention. Therefore, it gives the city a visual identity and gives visitors an unforgettable experience, as well as natives with a sense of civic pride. The purpose of the study is to develop a visual place quality framework for the hilly urban areas of Dharamsala, located in the northern Indian state of Himachal Pradesh, India. For this purpose, the methodology involves the use of parameters of visual place quality (identified through extensive literature review since 1972) for identifying the problems and problematic areas in the study area through a questionnaire-based pilot survey and case study. The data on the degradation of visual place quality aspects was analyzed using the Analytic Hierarchy Process technique and the consistency index to develop the visual place quality framework, where, based on scientific rationale and approach, the proposal was framed to address the visual place quality degradation of hills in order to improve their urbanscape and aesthetic value.
Importance of visual place quality: a Review
Visual-Quality-of-place (VQP) through elaborative factors explains Quality-of-life (QOL) in the outer environment. These factors are the sense of well-being, happiness, or satisfaction of local citizens/ tourists with variables like culture, crime, open surroundings, and traffic clogging which influence the local Visual Quality of Place (VQP). Visual Quality of Place (VQP) is directly connected with the whole livability concept [9]. According to the World Commission on Environment and Development (WCED) chair Brutland report; sustainability is an important aspect of the livability concept, combining the development of the economy with an emphasis on the preservation of environmental factors and the observance of equity in society [10]. An urban environment contains several variables, in which visual consistency for a setting has a remarkable perceptual and objective structure. Due to this attribute, ‘visual quality’ is possibly one of the most difficult phenomena in a setting to analyze and quantify in an environment. Visual quality is a term that refers to the degree to which individuals have ideas and aesthetic regard for existing things, objects, and their surroundings (Kalin, 2004). The distinctive urban environment is the product of the interweaving terrain, architecture, street layout, urban space design, and views. Significant architectural structures, landmarks, and regions with a particular character or history all contribute to the ‘sense of place’ that makes a city noteworthy [11, 12, 13].
Lack of planning for urban areas causes degradation of visual quality in hill settlements. The main issues of degradation are caused by crowded urban areas, transport mobility hazards, an excessive concentration of the inner city centre, unauthorized construction, land degradation, unplanned urban sprawl, and poor quality of infrastructure. Various reasearch studies have pointed out that an ordered arrangement has more aesthetic value [14]. According to Gestalt psychology principles, a public space’s realistic quality is determined by the city’s ‘good shape’ or ‘pragnanz’ [15]. Alternatively, the low visual quality of a place is associated with disorganized places [16]. According to Lang; an unstructured environment is one in which all of the elements have no link to one another and have no general concept guiding their formation [17]. Therefore, order is essential in all configurations, whether they are physical or mental configurations (R. Weber, 1995, Arnheim, 1977). Moreover, organized content leads to favourable user reactions and feedback. Another study by Nasar suggested that individuals from many cultural backgrounds like orderly streetscapes, as the author compared perceptions of people who lived in Japan and the United States [18]. [19] Visual appeal alone may not be sufficient to support environmental changes. At the same time, it should not be dismissed on the basis that it is a small question or an issue of personal preference. The evaluative maps demonstrate that in modern society, everybody interacts with one another and has a contextual perception of urban aesthetics. The evaluative image should be addressed with other issues which help to formulate a plan, such as public transport, social structure and mixed land-use. People have been affected by unappealing architectural aesthetic difficulties such as unpleasing forms, shapes, and styles that have created an impression of disordered surroundings for decades [20]. This is an indication of inadequate aesthetics on a comprehensive scale when buildings are laid out as monuments in a repeated manner and there is a lack of urban fabric and harmony. Today’s cities are little more than amusement parks, devoid of individuality, consumer culture, city management, tourism, and marketing [21]. There are non-physical variables related to the urban deterioration process. In many city centres, the fragmentation of building facades contributes to the creation of unappealing public spaces [4, 22]. Carmona looked at different ways to think about urban place quality and how a place’s aesthetic appeal can affect its surroundings [23]. The study found that there is a strong connection between the quality of a location and the value it has, which makes the built environment look better for the people who live there.
A brief review of different research studies since 1972, in visual quality of the place have been presented in Table 1.
Table 1.
Exhaustive literature review of different research studies in visual quality place (1972-2017)
| Author | Study theme | Dimension | Aspects identified |
| [24], [25] | Street liveability & traffic | Intensity of traffic on Urban town | The degrees of human engagement, territorial scope, and environmental sustainability, as well as safety, all connect inversely with perceived liveability (with more traffic). |
| [26] | Importance of neighborhood street design | Layouts of dead end street | Added value to grid street layouts |
| [27] | Disabilities and pedestrianisation | Pedestrianisation | Allow more mobility handicapped groups |
| [28] | User satisfaction & social housing relationship | Modernization of public housing complexes | Improved morale among estate inhabitants, as well as increased social capital |
| [29], [30] | Social structre of the street intercession | A functional, morphological, and architectural blend of narrow plots and small street sections. | Street life, pedestrian movements, and co-existence of social life. |
| [31] | Quality of life & Green links | Greenway paths in urban centers | Improved neighbourhood life quality including citizen fitness, citizen pride, pollution reduction, cost savings on transportation, and improved connectedness. |
| [32], [33] | Design & occupier productivity | Well-designed buildings (that better meets occupier needs) | Well-designed buildings deliver substantial productivity boosts |
| [34] | Essential neighbourhood areas | Provision for green area vs. desolate places | Increased use of social experience, especially in women, and also a decrease in antisocial activities |
| [35] | Quality life & Urban woodlands | Woodlands in settlements | Tends to increase equity for quality-of-life & child development |
| [36] | Disablement & built environment | Limited land-use diversity | Increased dependence on elderly persons and greater dependency on vehicles |
| [37] | Street safety and walkability | Vibrant streetscapes | Improved road safety |
| [38] | Heterogeneous design | Planned districts have strong borders, grid systems with commercial avenues, and a diverse mix of dwelling types | Facilitates diversity in social community and cultural community |
| [39] | The value of well- designed street | Qualities of the open spaces | Retail rentals and residential unit prices rise directly as streetscape quality improves. Pedestrians are prepared to pay more in taxes or bus fees for upgrades. |
| [40] | The built environment, mobility & disability | Poor condition of streets in (as evidenced by fissures, pits, and damaged curbs) | Adult with neuromuscular and movement-related impairments lead to higher mobility difficulty |
| [41] | Species richness & urbanization | Density of urbanization | Species richness is nearly always reduced in areas of extreme urbanisation (typical of urban centres). Moderate (suburban) urbanisation results in more diversity. |
| [42] | Qualities of a neighbourhood and civic engagement | User-friendliness perceptions | Higher social participation |
| [43] | Neighbourhood Contiguity & Congested transport | Sluggish congestion of vehicles | Increased self-awareness, happiness, and social inclusion |
| [44], [45] | Adult health and neighbourhood quality | Higher quality of neighbourhood | Better general health |
| [46] | Social significance of public places | Everyday presence of native population in public places | The opportunity to socialise, play, or just ‘hang out’ with others to share their culture and identities. |
| [47] | Shared impact, use and space | Co-designed streets | Improved visual aesthetics, economic strength, and safety concerns. Difficulties for certain visually challenged individuals. |
| [48] | Shared areas in operation | Designing streets with shared place | Slower traffic and more cautious driving are the results of these changes. |
| [49] | Shared places & public perceptions | Designing streets with shared place | An unpleasant experience for users, with tendency for clearly delineated zones for automobiles and pedestrians |
| [50] | Cities for people | More pedestrianisation, reduction of traffic and congestion, and availability of cycle paths | Increased usage of public areas for longer time and in more social manner, as well as increased bicycle usage |
| [51] | Assistance from the public for street-level urban design practises | The characteristic standard of local street network pattern | It has an effect on public participation and civic involvement in the built environment, as well as on the quantity of rehular activity. |
| [52] | Factors affecting burglaries | Areas that are inteligible (legible) and have a high degree of permeability (physical & visual) | Reduced vulnerability to crime |
| [53] | Social interaction & Traffic | Intensity of congestion on city | Decreased social interaction and individual development with more traffic. |
| [54] | disability and mobility in the physical environment | Improved connection on the streets. Improved street quality as well as increased safety from vehicles. The location’s proximity to facilities. | Greater mobility |
| [55] |
Urban design & Eco hydrology (water & vegitation) | Placemaking, ecohydrology, and green areas | Incorporating more absorbent surfaces and greenspace into the urban environment helps control storm water |
| [56] | Place perceptions and mental health |
Place-consciousness (Sense of place) | Psychological well-being as experienced by the individual |
| [57] | Streets as economic catalysts | Availability of high-quality street space | A well-designed street space is critical for productivity, infrastructural development, ecological sustainability, life quality, and equitable / social integration. |
| [58] | Space utilization and usage factors | Increased amountof transient usage, climate management, green space, moveable sitting, and existance of ‘infrastructure’ – eatery spaces, stores, large screens, music stands, kiosks, market, restrooms, seats, etc. |
Space movement, learning via play, informal social interaction, and extended usage (Invisible visual permeability in spaces) |
| [59] | Relationship between Physical activity, urban sprawl & health. | Expansion of urban areas growth | Less walking, more obesity, and hypertension |
| [60] | Housing values and preferences | Urban living, mixed communities, and modern approach | Increased regional autonomy (less regard about safety, family and traditional design) |
| [61] | Walkability in a high frecuency area & built-environment | Better access to public transport & Intesive land-use mix | Better levels of walking |
| [62] | Bringing people together and building communities | Secure streets, high-quality streets and public areas, as well as interaction with nature | Health, social connection, and community development benefit |
| [63] | Women’s liberation & the city | High - quality urban amenities and pedestrian-friendly street lighting | Empowering women in cities |
| [64] | Significance of mix-use street corridors | Mixed-use streetscapes | Encouraging large scale occupation, social welfare, physical and monetary growth |
| [65] | Social resilience & Walkability | Walkability | Less foreclosures, less crime, and better home values |
| [66], [67] | Socializing and dense vegetation | Quantity of forest vegetation in urban areas | Increased social equity |
| [68] | Reduced use of prescription anti-depressants w.r.t. desnity of streetscape trees & anti-depressants | Existing of street trees | Reduced dependence on anti-depressants prescribed. |
| [69] | Place-based urban rejuvenation & health | Programs focusing on the urban environment for regeneration | Improvements in overall well-being health |
| [70] | Well-being and urban morphology | Green spaces, historic buildings, a dense road layout, grid-shaped | Increased happiness, physical activity, social structure, less level stress and pollution, a sense of security and healthier choices. |
| [71] | The importance of placemaking | Contributing in the creation of places | Initial investment in high-quality placemaking increases values. |
| [72] | Urban layout, vibrant social spaces, and activities that promote well-being | Small-scale improvements to the public domain | Greater public usage and quality of life |
| [73], [74] | Quality-of-life (QoL) as a result of sustainable growth | Construction with decreased air environmental and waste consumption | Improvements in quality-of-life |
| [75] | Social Value of public | Enhancements to public area | More value (often significant) as a result of enhanced vision and character, a new space for commercial facilities or recreational facilities, increased adaptability for events, and enhanced understanding |
| [76] | The outdoors, the human brain & ICT | Outdoor leisure and play | Perceptual fulfillment in humans |
| [77] | Urban Greenbelts’ Impact | Adjoining to greenbelts | Enhancing property values through the provision of outdoor leisure areas and social meeting locations |
| [78] | Urban design & amenity benefits | Green space quality, heritage proximity, walkability, linked street networks, shape, urban land-use, and transportation heterogeneity | Affordability is a cost associated with high-quality street-based urbanization. However, residences near to minimal green space have decrease value. |
| [79] | Social life takes place in public places. | Access (to the roadway network), security, and flexibility | Additional social places |
Identification of Visual Quality of Place (VQP) Parameters
These research studies have further contributed towards the identification of visual place quality parameters relevant to the context of the study area as shown in Table 2 and Figure 1. These parameters have further been used in a case study and a questionnaire-based pilot survey of the study area, the Dharamsala region.
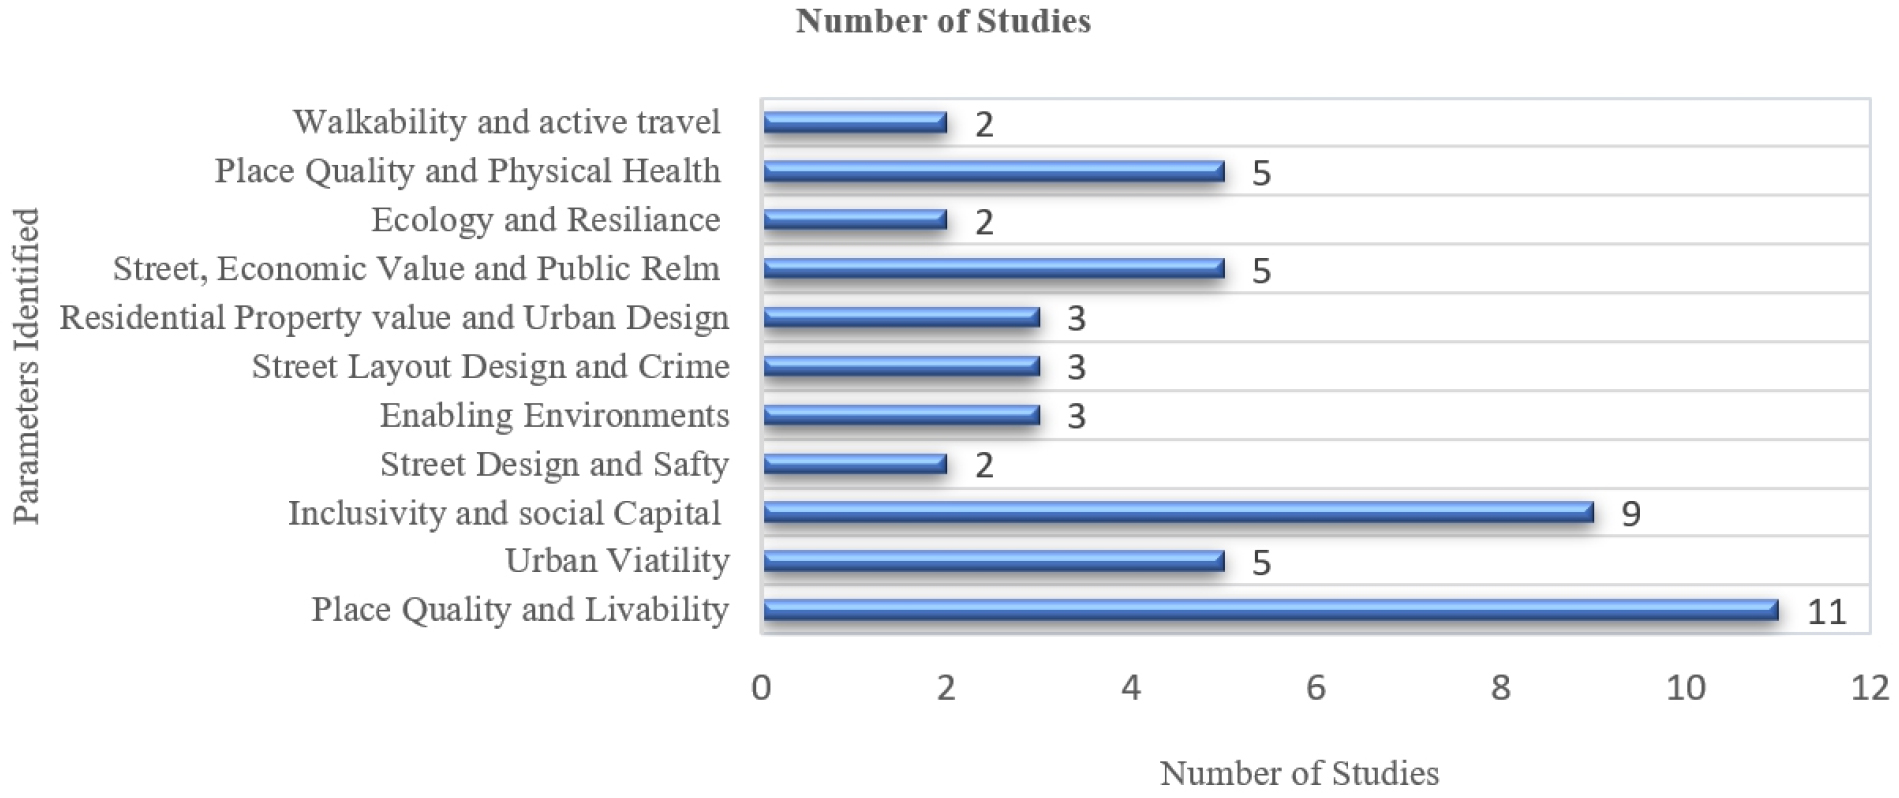
As is apparent from Figure 1; most of the investigation is concentrated on certain types of intervention and specific outcomes related to Visual Quality of Place (VQP). An extensive study of interrelated problems of walkability has been studied and investigated with an emphasis on whether the built environment might entice people out of their vehicles by creating beautiful, safe environments that allow them to stroll to a range of neighborhood conveniences and attractions. There is a conflict betweem both these concerns, since low-density car-dependent areas incorporate more vegetation (typically on private land) yet discourage walking. Walkable places with a lot of people in them, on the other hand, can be more active, but they can also be unhealthy because of noise, pollution, and not enough vegetation.
A more diverse body of research focuses on the built environment’s effect on broader economic development and regeneration processes, such as public expenditure, while a smaller but more cohesive set of studies explored the impact of streetscape alterations on the surrounding regions. Some research studies in the context of sustainability have focused on technical concerns in building design [80], while many transportation-related studies are focused on transportation models in the process [81]. There was significant convergence in the studies in this policy area, with very little contradictory data. It is becoming more and more clear that good places have both private and public benefits. This is, again, overwhelming because of the amount of data that is available.
According to Figure 1, the following parameters must be explored and considered when designing locations in terms of visual place quality:
•Safety, walkability, vegetation, and enclosure: Greater pleasure, less fear, and better energy levels are all associated with an improved quality of life. Increased integration of green spaces and walking places has good health implications for people.
•Physical capital: lower public spending as a result of lower road network construction and maintenance costs, which reduces public realm upkeep management costs, including security, and provides more assistance for historic built environments and public redevelopment [81].
•Traffic volume, mixed neighborhoods, street layout pattern and Human scale: The use of less automobiles and more cost-effective public transportation, as well as lower energy usage and lesser carbon footprints from conveyance, infrastructure, and constructions, all contribute to lowered living expenses. This has been seconded by [82, 83].
•Accessible space, and transparency: Improved productivity is achieved through more efficient management of property and workers, the facilitation of greater density development and much more well-organized land use, the ability of buildings and spaces to be more adaptable over time, and the avoidance of the extra costs associated with poor design and construction.
•Skyline and imageability: Adaptive reuse is the process of making buildings, spaces, and urban infrastructure more flexible over time in order to better meet the changing needs of society while preserving the current constructed fabric and its embodied energy.
•Livability and imageability: Local exchange networks that are feasible are those that are based on local facilities, amenities, and job possibilities, which reduce the need to go further afield while also promoting overall socio - economic sustainability.
•Livability, quality of life and complexity: Decreased pollution, particularly air pollution and noise pollution, which have positive consequences for human health and well-being [84].
•Livability and complexity: Higher levels of resilience are achieved through adapting and controlling hydrological cycles and cooperating with natural occurrences, among other things.
•Vegetation and complexity: Environmental diversity through fostering a wider variety of species and creating a more environmentally friendly constructed environment.
It can be summed up here that walkability, mixed neighbourhoods, street layout patterns, quality of life, social life in cities, shared spaces, sense of place, and health of human wellbeing have profound connections with smart growth patterns [85]. Futhermore, an in-depth review of visual place quality studies was undertaken to identify the parameters that affect the visual aspects of an urban place, as presented in Table 2.
Table 2.
Review of visual quality place studies in context of Urban spaces
| Author | Parameter | Study Focus | Methodology |
| [86], [87] | Visual Quality of Place w.r.t Urban Spaces | To establish a relationship between the quality of urban form and its value in terms of social, health, and environmental, economic factors impacts through place value & place quality. | A systematic review using metrics that enhance place value be utilized to assess place quality. |
| [88] | Visual Quality of Place w.r.t Urban Spaces | An approach to studying diverse cities via the perspective of sociohistorical analysis in the context of an investigation of the Judeo-Arab communities’ urban environments. | Max Weber’s causal analysis principles are adopted with the ability to successfully handle diverse places, populations, and time periods. |
| [89] | Visual Quality of Place w.r.t Urban Spaces | Determine its dimensions, how it is mentally split into units, and the apparent hierarchical relationships between these units, based on the physical, practical, and nonphysical aspects of space that shape this perception. | The user analysis conceptual framework concentrates on a user’s observed Impulses (I), Usage (U), and Assessments (A), as well as basic demographic classifications like gender and age (C). |
| [90] | Visual Quality of Place w.r.t Aesthetic Controls. | The built environment can have physical (e.g., property value) and intangible (e.g., emotional or psychological stress) effects on individuals. | Comparing categories of interests is one level of arguing about freedom of expression. The author contrasts between three layers of freedom of expression debate: interests, rights, and policies. |
| [91] | Visual Quality of Place w.r.t Visual pollution in natural landscape. | Preparation of global and Lithuanian expertise in visual impact assessment (VIA) and environment visual-aesthetic possibilities. | Using logical analogies, we may define empirically legitimate visual pollution, compare landscape and visual pollution criteria (physical and visual attributes), and define the major stages of VPA. |
| [92] | Visual quality of Place w.r.t Urban Quality | Develop a framework for understanding and integrating components of residents quality of life in urban and environmental structure. | Value of urban life measured objectively and subjectively. |
| [93] | Visual quality of Place w.r.t Visual Characteristics | This research investigated the degree to which “aesthetics” leads to the improvement of urban arcades and urban outdoor areas when combined with other variables such as geographical centrality, service availability, and utilities. | To identify important visual features, photo elicitation and focus interviews conducted, and sampling techniques included a questionnaire method and the use of semantic differential assessment scale as a measurement tool. |
As from the interpretation of Table 1 and Table 2, two types of parameters were identified: Physical parameters and Perpetual parameters for visual place quality as shown in Table 3. It can be interpreted from Table 3 that while Physical parameters are tangible and are 1) Street Sidewalk, 2) Liveability, 3) Traffic Volume, 4) Vegetation, 5) Skyline, 6) Accessible Space, 7) Number of Users, 8) Street Width, 9) Physical Capital, 10) Building Height, 11) Safety, 12) Walkability, 13) Street Square; Perpetual Parameter are non-physical parameters which are non-tangible like 1) Imageability, 2) Enclosure, 3) Human Scale, 4) Transparency, 6) Complexity. Physical parameters are identified by decision matrix whereas the perpetual parameters are identified by expert choices and visual pixelwise segmentation. The research work has employed physical parameters for preliminary pilot survey for identification of problematic areas and problems therein. The research work involved use of Analytic Hierarchy Process(AHP) as scientific tool to complement the identification of context specific parameters and their thematic areas and related problems for enhancing/ improving visual place quality of study area; Dharamsala. In order to identify the physical parameters in the study area, the experts from different government organizations working on the Dharamshala Smart City project were communicated & interacted with through DELPHI technique. With the help of Delphi technique; opinion and perception of stakeholders and experts was explored. This was further used to identify the required parameters in Dharamshala city to achieve the Visual Quality Place (VQP) through the Analytical Hierarchy Process (AHP).
Table 3.
Parameters identified from the review literature (1972-2017)
Case study of Dharamsala region
In present research work, the case of Dharamshala, a hill town in the north-western state of Himachal Pradesh, has been studied in order to recognize the degradation of visual place quality aspects. The hill town is incidentally also the summer capital of the state of Himachal Pradesh and administrative headquarter of Kangra region [94]. Dharamshala is a settlement in the Kangra Valley’s higher reaches, surrounded by lush coniferous woods dominated by majestic Deodar Cedar trees. McLeodganj, Kotwali Bazar, Kachehri Adda, Dari, Ramnagar, Sidhpur, and Sidhbari are just a few of the suburbs. Dharmashala is densely populated area in terms of permanent population and also receives a heavy influx of tourists. There are numerous factors that lead to the chaotic and congested state of hilly town of Dharamsala. These factors are: 1) Dharamsala’s being the summer capital of the state of Himachal Pradesh, 2) a profound and famous tourist destination, 3) administrative headquarters of Kangra, 4) location of international cricket stadium, and 5) a pilgrimage place with famous temples. Given the overall contribution of gamut of factors, the area attracts a huge influx of tourist population and permanent dwellers, in addition to having a noticeable population of Tibetan refugees who flocked the area after the 14th Dalai Lama’s visit. As a consequence, Dharamshala has become a renowned tourist attraction for indigenous and international visitors due to his stay and the Tibetan community. Municipal Area covers 27.62 sq. km. of Dharamshala urban town and the planning area covers 41.63 sq. km. Population of Dharamshala rose from 10,255 in 1961 to 22,586 in 2011 which is rather a modest rate of development (120 percent in 50 years). According to census data from 1991, 2001, and 2011, as well as demographic statistics from prior development plans, the urban growth rate decreased from 37.52% in 1981 to 9.32% in 2001 then again increased in 2011. However, the net rate of population growth (urban and rural) varied from 33.82% in 1981 to 32.92% in 2011 [94].
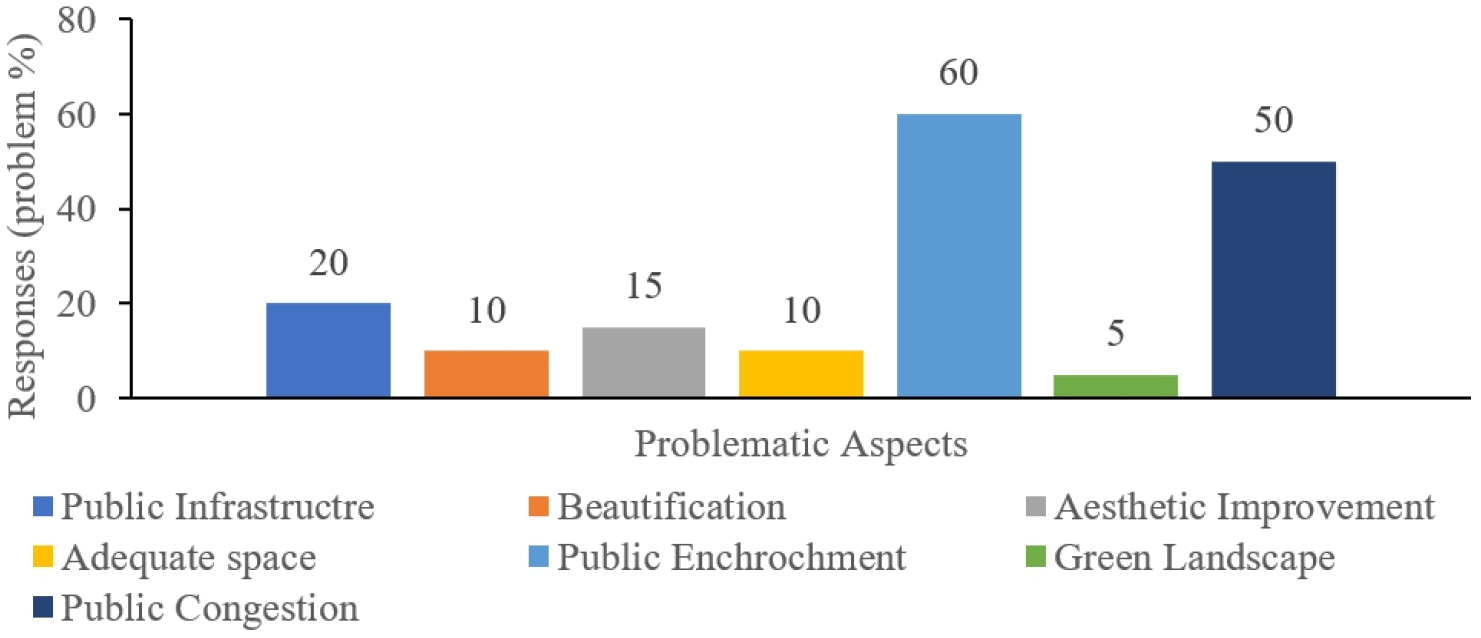
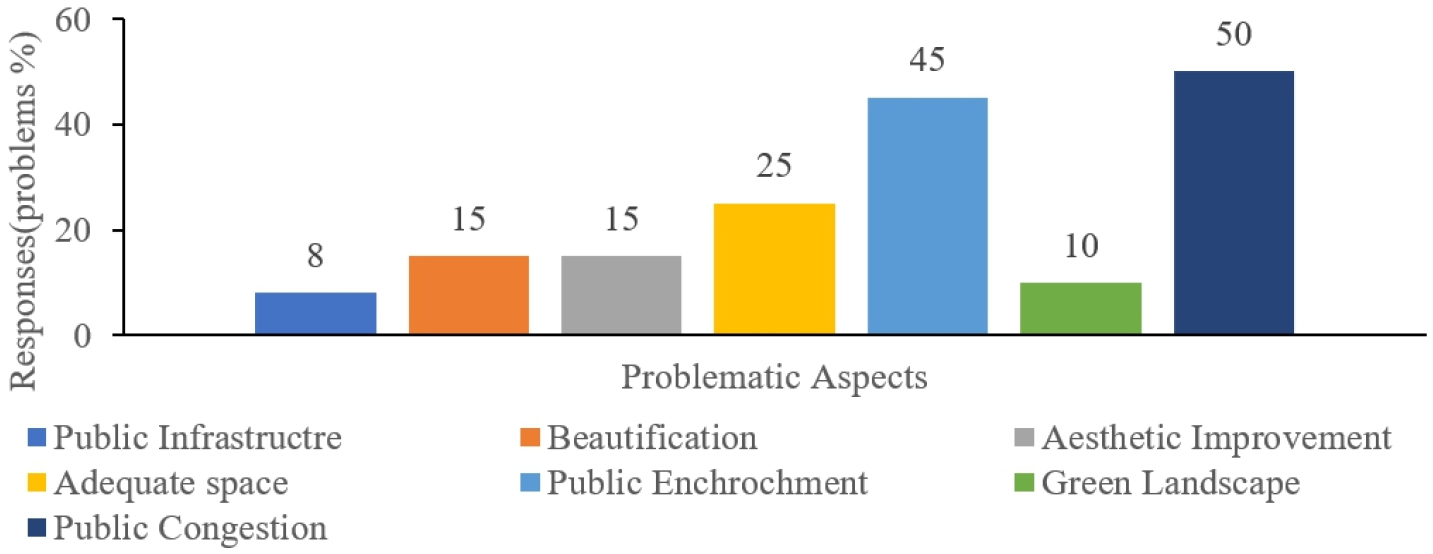
The survey conducted helped to identify the public requirements that could help to create the positive image of the city/ town from the perspective of the residents, stakeholders, and tourists coming to visit the city. The analysis of the above mentioned parameters have been discussed from Figure 2 to Figure 6. The data from the survey was analyzed by assuming weights to the aspects treated as criteria based on respondents’ responses to improve the city’s infrastructure and its urban aesthetics.
It can be interpreted from Figure 2 that; public encroachment is the aspect with highest weightage of problems followed by aspect of public congestion further followed by problems in public infrastructure. This is because it is the core area near transport terminal ISBT, and due to this tourist inflow is high. This leads to high public congestion in the area. Therefore, this gives the idea that the problems related to public encroachment and public congestion needs to be prioritized for location of ISBT Dharamsala.
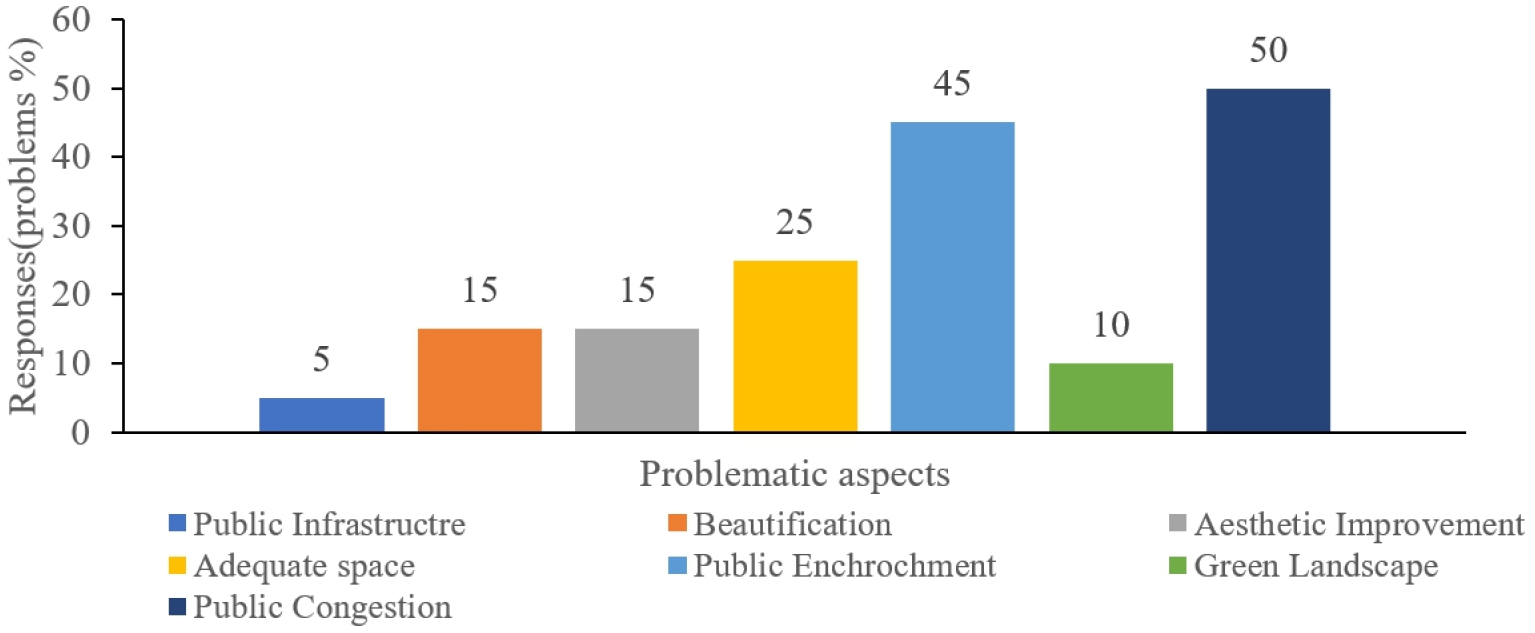
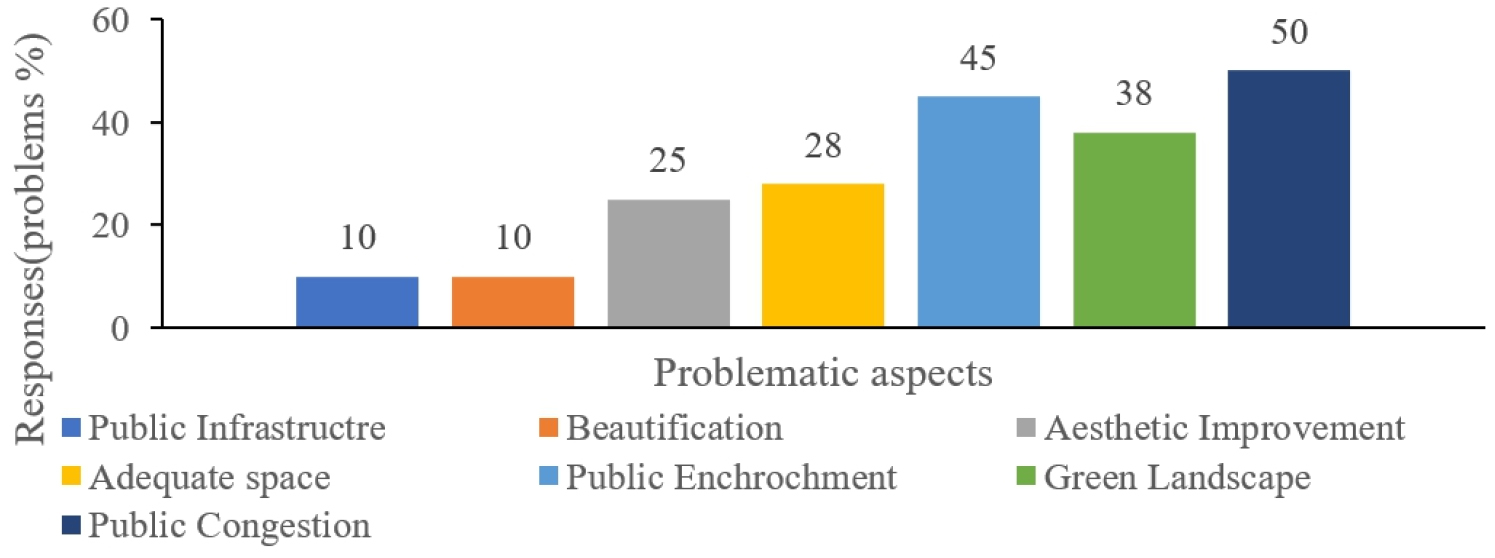
It can be interpreted from Figure 3 that public congestion is the aspect with the highest weightage of problems, followed by the aspect of public encroachment and further followed by adequate space. This is because Kotwali Bazar has high place value owing to its historical and heritage importance. Tourists and the general public visit the area built in the British era. Such a huge influx of tourists attracts small informal market spaces and street vendors alike and leads to public encroachment in the area, which further leads to high congestion in the area. Therefore, this gives the idea that the problems related to public congestion and public encroachment need to be prioritized for the location of Kotwali Bazar, Dharamsala.
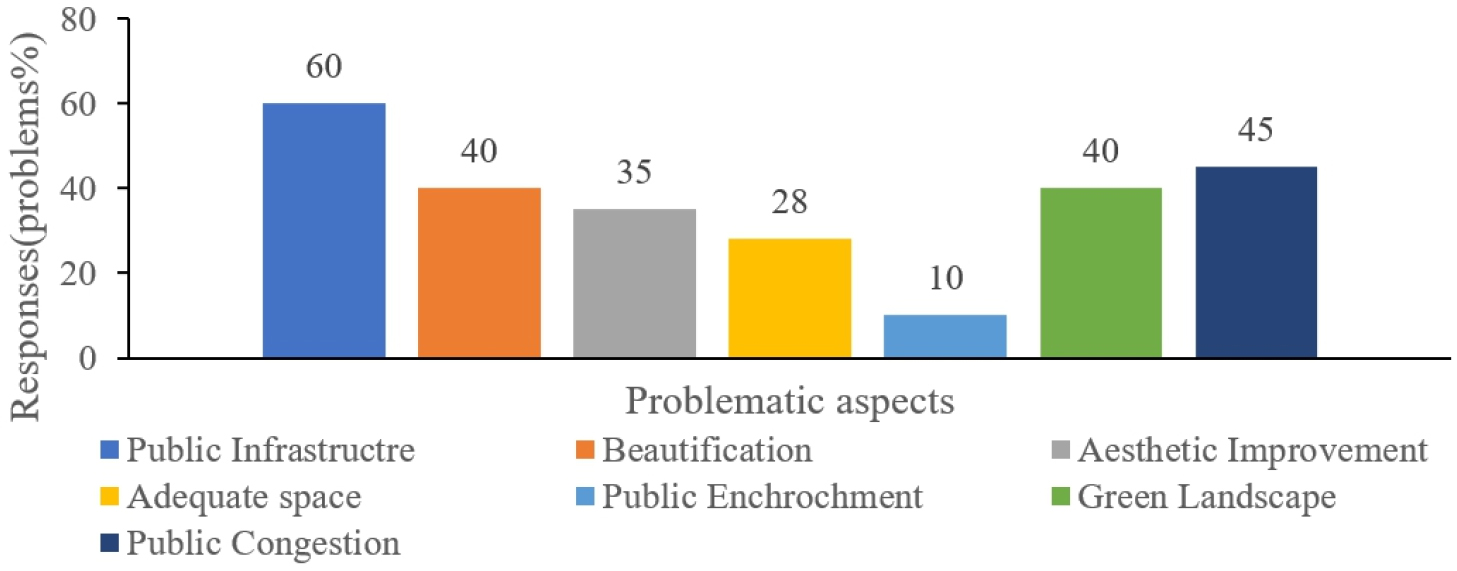
It can be interpreted from Figure 4 that public infrastructure is the aspect with the highest weightage of problems, followed by the aspect of public congestion, further followed by the aspects of green landscape and beautification. This is due to the fact that the core area of Chilgari has a location of heritage structures and some administrative buildings, but a lack of basic amenities and infrastructure. This doesn’t give a good impression to tourists who visit the place. Therefore, this gives the idea that the problems related to public infrastructure and public congestion need to be prioritized for the locations of Chilgari and Dharamsala.
It can be interpreted from Figure 5 that public congestion is the aspect with the highest weightage of problems, followed by the aspect of public encroachment, further followed by the aspects of adequate space and beautification. This is due to the fact that the core area of Depot Bazar has mainly administrative and some heritage buildings, which sees many residents flocking to the area for different administrative tasks, which creates congestion in the area and also serves as a hindrance to the convenient movement of tourists. To serve this large proportion of the population coming for administrative purposes, small informal market spaces and street vendors have encroached on the area. It is important to mention here that this location, with many administrative offices, lacks basic amenities and infrastructure. Therefore, this gives the idea that the problems related to public congestion and public encroachment need to be prioritized for the location of Depot Bazar, Dharamsala.
It can be interpreted from Figure 6 that public congestion is the aspect with the highest weightage of problems, followed by the aspect of public encroachment, further followed by aspects of green landscape and adequate space. This is because Sheela Chowk/Dari is an underdeveloped region and growing fast due to its proximity to Dharmshala, which requires early consideration by the authorities to act on the area measures. Therefore, the curves give an idea that the problems related to public congestion and public encroachment need to be prioritized for the location of Sheela Chowk and Dari, Dharamsala.
Analysis of problematic aspects thus identified from literature review and practically surveyed for the five locations in the study area, as also revealed from curves, showed that out of seven problematic aspects, four need to be addressed on a priority basis for the worst prevalent conditions in terms of degrading visual place quality: 1) public encroachment, 2) public congestion, 3) public infrastructure, 4) adequate space, 5) beautification, 6) green landscape, and 7) aesthetic improvement.
Aesthetic improvement aspects were further studied in depth to understand aesthetic concerns with the help of questionnaires. The aesthetic concern responses in context to new development in the city of Dharamshala were calculated and analyzed by assigning weights based on responders’ choice requirements to improve the city aesthetics, visual image, city safety, and traffic congestion as shown in Figure 7.
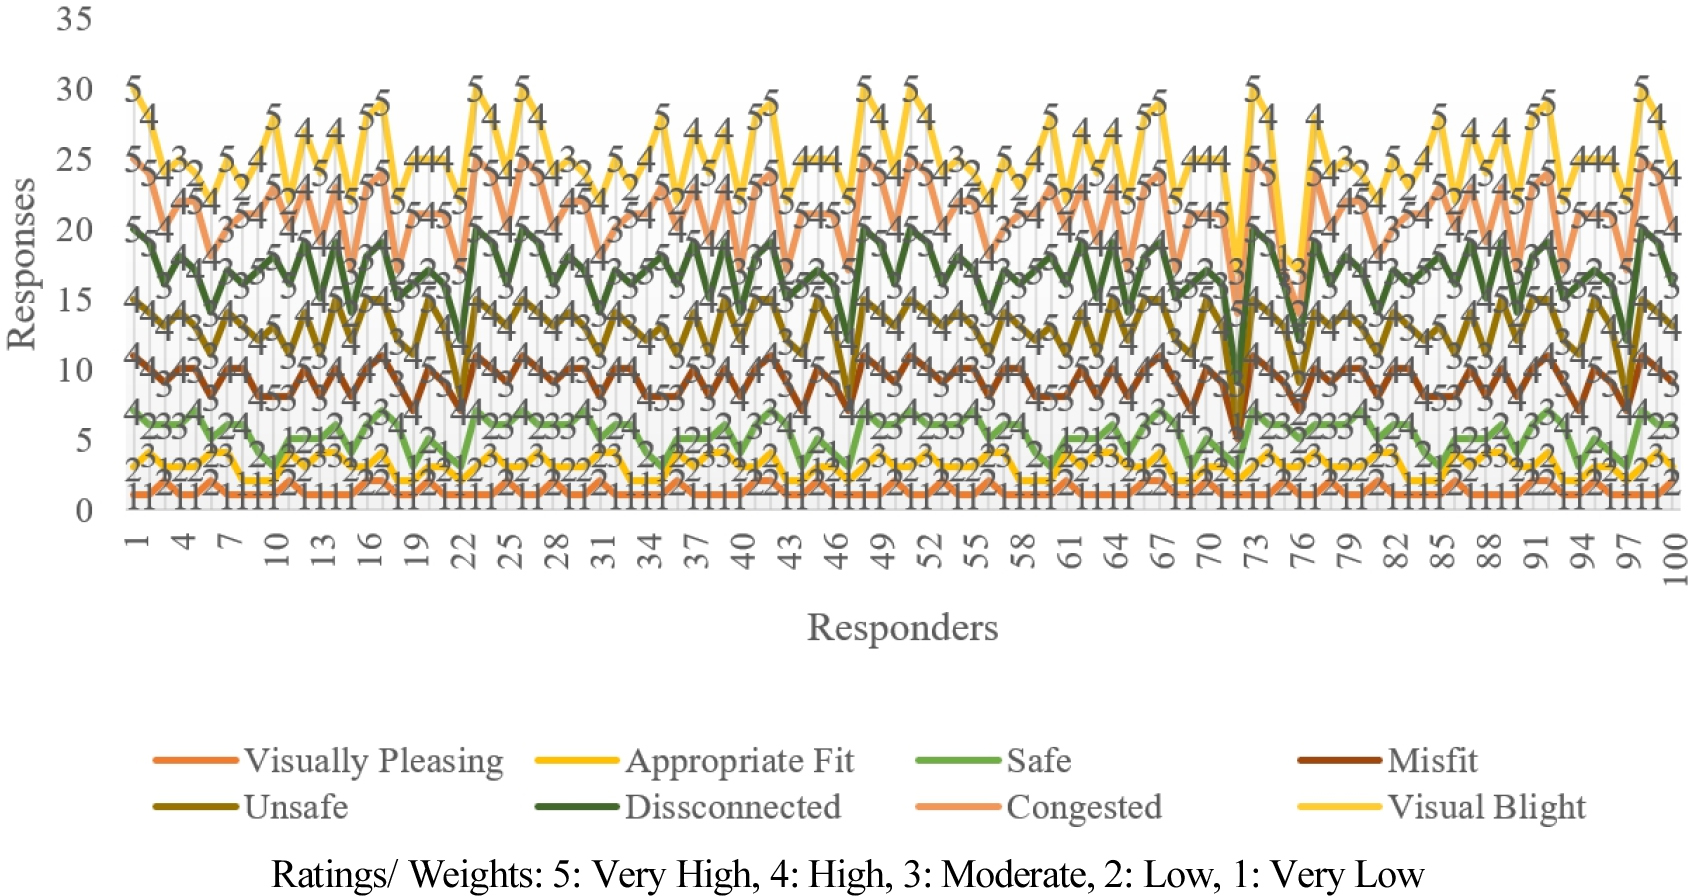
Aesthetical concerns have been shown in Figure 7, which gives information about respondents’ responses to the dimensions of visual appeal, appropriate fit, city safety, misfit, unsafe, disconnected, congested, and visual plight concerns of Dharmashala city. Analysis of these dimensions showed that safety for the people and building safety during the British era, and enhancing the visually pleasing asthetics are the users’ needs of Dharamshala.
The survey results were further analyzed in terms of providing adequate spaces, decongesting core areas, reducing encroachment through proper provisions, improving the city’s infrastructure, and its urban aesthetics. These aspects were studied from the operator’s perception, which was the local public. These problematic aspects were further analyzed with the help of the AHP technique for a detailed and exhaustive collection of a set of problematic aspects which can be addressed specifically at ground level.
Methods and Tools
Research Tools
Present research work involves the use of scientific tests for analyzing Visual Quality of Place aspects. In general, Like AHP When an object belongs to a crisp set or classical set, its consistency is precisely defined, whereas in a decision matrix, its membership is ambiguous. One of two possibilities exists when dealing with a collection of elements: either they are consistent or they are not. To express a crisp set mathematically, we use the indicator function.
Definition 1. A comparison matrix A i.e equation (1) is positive reciprocal matrix if aij = 1, aij > 0 and aij =1/ aji for all positive integer i and j .
Definition 2. A positive reciprocal matrix is entirely constant if aikakj = aij for all i, j and k.
Definition 3. A positive reciprocal matrix is nearly constant if aikakj ≈ aij for all i, j and k, where ‘≈’ denotes approximately or close to.
Definition 4. A positive reciprocal matrix is transitive if A > C can be obtained from A > B and B > C rationally.
Definition 5. The pairwise comparison matrix can qualify the consistency test, if the Consistency Ratio CR = CI/ RI < 0.1, where the Consistency Index CI = λ max-n/n-1 ,
RI = average Random Index based on Matrix Size as shown in Table 4,
λ max = the maximum eigenvalue of matrix A.
n = order of matrix A [95].
The Analytic Hierarchy Process (AHP) is also known as the Saaty technique [95]. It is frequently utilized and well-liked in decision-making and a wide range of applications. The same study has also given an average random index (RI) which has shown successful results for analytical processes for measuring degradation of visual place quality aspects using AHP techiqnue and same has been used in the present study for similar purposes.
In the present research work, the main aim is to create a matrix that expresses the relative values of a collection of criterias. This strategy can incorporate both qualitative and quantitative data into the decision-making process [96]. However, it has been condemned due to a number of drawbacks connected with pure AHP for: (i) it uses a linear scale of 1-9 and is unable to account for decision-making ambiguity (ii) the AHP technique is incapable of dealing with an imbalanced judgement scale. (iii) it is more relevant for small sets of information. The above Table 4 shows the application of the AHP approach to the multiple attributes or criterias.
Table 4.
Average random index (RI)
| n | 1 | 2 | 3 | 4 | 5 | 6 | 7 | 8 | 9 | 10 | 11 | 12 | 13 | 14 | 15 |
| RI | 0 | 0 | 0.52 | 0.89 | 1.11 | 1.25 | 1.35 | 1.4 | 1.45 | 1.49 | 1.51 | 1.54 | 1.56 | 1.57 | 1.58 |
Source: Wind & Saaty, 1980 [95].
Application
On the basis of consultation with the group of professionals about the approach of AHP using Delphi technique, it was found that the eigenvector can be calculated in a variety of ways. Multiplying the elements in each row of the matrix together and then calculating the nth root of that result offers an excellent approximation of the correct response. The nth roots are added together, and the result is used to normalize the eigenvector values such that they add up to 1.00. This procedure was adopted in the present research work and has been shown in Table 5.
Table 5 clearly shows that the eigenvector of the relative importance/rank value of 13th criteria is 0.1639 and for 1st criteria it is 0.1546 and so on. Thus, the 13th rank/ criteria is the most important. The 1st rank/criteria and 2nd rank/criteria are in decreasing order, but are nearly equal, whereas the 3rd rank is far less significant on the basis of ranking percentage of Principle Eigen Value. It can be interpreted from the Table 5 that according to the rank values of different criteria /aspects under study; the street sidewalk and aesthetically pleasing architecture have been identified as the needs of the people of Dharamshala. Also, it was found that there is a prime need for a street square to enhance the visual aesthetics and attract tourists and locals alike.
Table 5.
The Analytic Hierarchy Process Comparison Decision Matrix for Criteria
Results and discussion
As discussed and shown in Table 5; Consistency Index was computed using formula (λ max‐n) / (n‐1), hence Delta (λ) = 7.1E-9. It was found that 78 number of comparisons had taken place and the principle Eigen Value was found to be 14.862. Hence, the consistency ratio (CR) was 10.00% achieved through the decision matrix, i.e., CR > 0.1. These results are in consonance with results shown by study conducted by Wind and Saaty [95], which further validates the results of persent research work. The findings show that the result is maintained within the system. Also, the positive and negative variations of criterias (rank values) according to the priority are mentioned in the Table 6.
It can be interpreted from Table 6 that aspects of Street Square have a priority level of 16.4%, street sidewalks have a priority level of 15.5%, followed by street width with a priority level of 14.6%, and creation of accessible space with a priority level of 11.3%, and walkability with a priority level of 10.20%, with maximum ranges of priority levels. This shows that these aspects have been ranked as top priority aspects that require immediate consideration for upgradation on overall aspects. It is also evident from Table 6 that the findings on place quality are a complicated series of connections between different people or things and their significance and quality of the logic evidence of the collective evidence.
Table 6.
Priority ranking of criteria
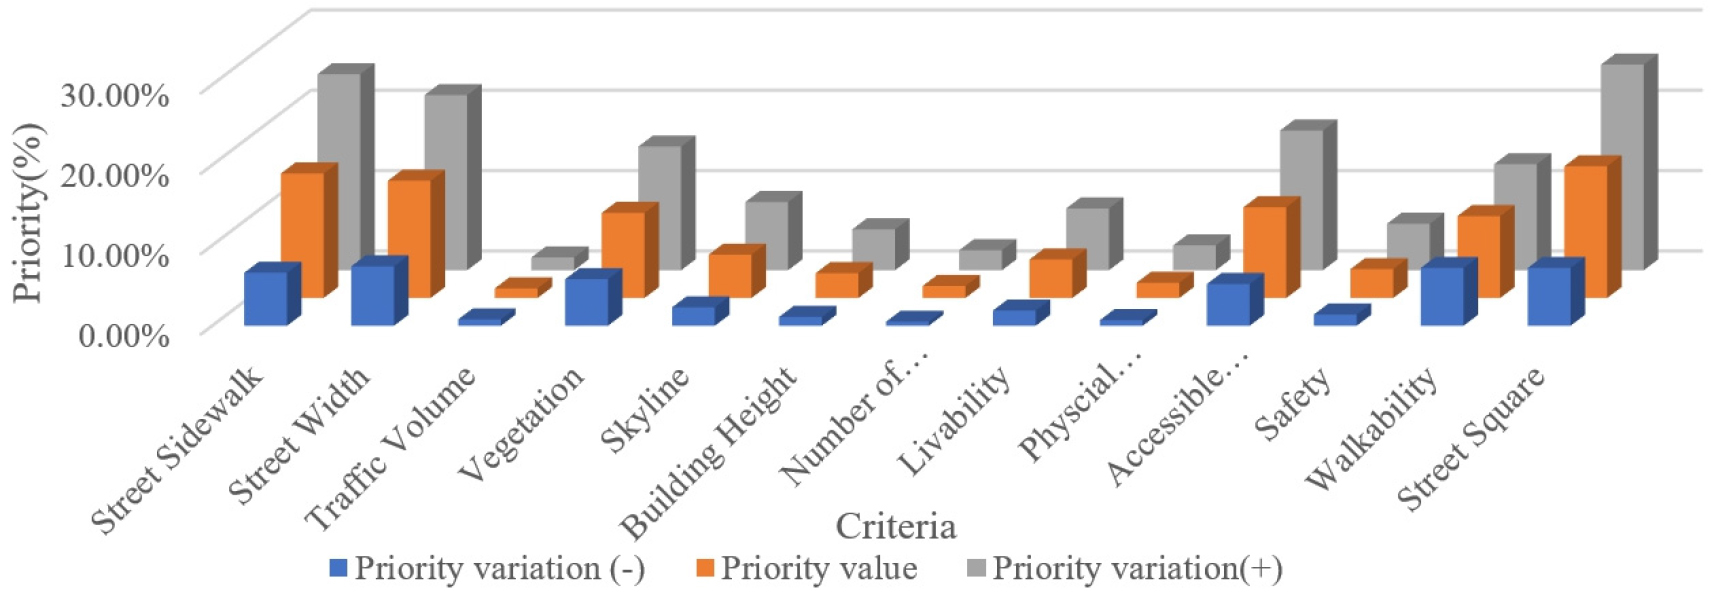
It can be clearly interpreted from Figure 8 that positive priority variations show the level of improvements that can be incorporated into the aspects to their maximum extent for benefits and visual place quality aspects, and negative priority variations show the failure modes and the harm or damage that the specific failure mode can cause to overall visual place quality scenarios. As is evident from Figure 8, the aspect of Street Square has the highest positive priority variation (9.2%) and negative priority variation (9.2%), which means that the aspect has the maximum scope of improvement and if not attended properly, its failure mode would constitute maximum harm or damage to aesthetics and visual place quality scenarios and would become the main factor in degrading the overall urban form and urbanscape of the Dharamsala region. Closely followed by street square is the aspect of street sidewalk with high positive (8.9%) variation and negative priority variation (8.9%). It is further followed by street width with comparatively high positive (7.2%) and negative priority variation (7.2%), followed by the accessible space aspect with significant positive priority variation (6.1%) and negative priority variation (6.1%). This priority ranking and priority variations show that these different aspects are important and vital to be addressed for addressing the degradation of visual place quality aspects of the hilly region of Dharamsala based on priority.
Therefore, present research work shows that the methodologies for growth need to be customized contextually, which further needs to be done by the specific state governments and city municipalities. Based on these results, the following recommendation as results have been carved out from the present research study for site specific Visual Quality of Place Development of Dharamshala:
1.Updating of provisions of public utilities and facilities in Himachal Pradesh Housing and Urban Development Act, 2004, Chapter III, Section-17 is required: Himachal Pradesh Housing and Urban Development Act, 2004; Chapter III, Section-17, was introduced a decade back. It is seen that although there are certain provisions that have been updated in HPHUDA, 2004 and are in sync with the recent advancements in the development authority law, still provisions such as public amenities, parks, green areas, public safety, transportation-oriented development, and place accessibility are suggested to be considered in the the act.
2.Modifications related to aspects of visual place quality in the present Himachal Pradesh Town and Country Planning Act, 1977 are required. The Himachal Pradesh Town and Country Planning Act, 1977 was implemented in 1977, nearly 30 years ago. Since then, many legislative amendments have been made based on spatial planning instead of public infrastructure. New amendments should now be introduced based on the study related to the visual quality of a place.
3.The study showed that a street square gives a city its unique character. It adds to the tourism and economy of the area and becomes a hub for public gatherings and celebrations. Currently, the city lacks a street square area, and events and administrative gatherings are mostly done in the open areas of many public buildings, which have a different kind of formal environment. There is a need for a more inetractive space for such gatherings.
4.The study revealed congestion in public spaces, especially in and around the existing inter-state bus terminal (ISBT). There is a need to shift the existing inter-state bus terminal (ISBT) to the outskirts of the town. A proposal for the same is already under process in this respect, and with its practical realisation, the core area would be decongested effectively. Moreover, the old ISBT, which lies in the heart of the city, can be revitalised as a better place for such a kind of plaza.
5.In the core area of the town, it is seen that sidewalks along the roads are not present, which adds to the plight of pedestrians during peak traffic hours. It is suggested that the street sidewalks around the roads be developed as per the municipal standards.
6.According to the Indian Road Congress (Code IRC:3-1983), the minimum width of the road should be 4.25 meters. But it has been found from the study that in the town, the width of the roads in core areas is less than 3 meters near core areas like Kotwali bazar. It is preferred that the road width be increased in accordance with the IRC:3-1983 code.
7.A barrier-free environment is required for better access for disabled people. According to a study, it has been found that there are very few places that provide facilities for disabled people. It is suggested that more barrier-free urban spaces designed for the public should be incorporated into the overall infrastructure of the city.
8.Study results revealed that there is a need to introduce a “Citizen Charter” at the state level to bring accountability and transparency to the new development in the town.
9.The City Infrastructure Fund might be established to gather revenues from direct and indirect taxes that are precisely related to urban and state areas, later being utilised primarily for urban infrastructure.
Conclusion
A visual place quality study for the hilly region of Dharamsala was conducted to arrest the degradation of aesthetics and urban spatial quality in the area with the help of a questionnaire-based pilot survey and visual place quality assessment measures. The parameters used in the survey were physical parameters as identified from literature review and were modified to suit the contxet. In addition, the Delphi technique was also used to collect data. The data collected was subjected to analysis using the AHP Technique. The average random index (RI) as obtained from an exhaustive literature review was used to obtain an Analysis Hierarchy Process Comparison Decision Matrix for Criteria and a Consistency Index for the study area, which further helped in processing and analysing. Finally, a priority ranking of criterias/aspects was obtained, which clearly showed the aspects which are presently in the worst condition and require immediate attention for improvement by the authorities.
According to the outcomes, in order to recover the degrading visual place quality and aesthetics of the Dharamshala region, street square, street sidewalk, and street width require to be improved upon, in addition to the provision of a barrier-free environment, the introduction of the Citizen Charter at state level, and the mobilisation of the city substructure fund for the maintenance of these planned urban spaces and facilities/services. Furthermore, amendments to the existing Town and Country Planning Act, the Himachal Pradesh Housing and Urban Development Act, and existing bylaws in the areas of spatial planning, public infrastructure, and public amenities- facilities are required.
The present study is context-based, and no similar generic study on visual place quality has been done so far for the research area. Most studies are human perception based, where generally two types of approaches are used: 1) interviewing the stakeholders and then ranking is done on the basis of their responses; and 2) constituting an expert panel for decision making, whereby further research is carried out on generic importance of the parameters and context-based identity of a place. The development authorities can use the results to produce guidelines and action plans for improving the look of a street.
