

Introduction
Preliminary Research
Risk Management
Risk identification
Risk analysis
Risk response
Control chart
Case Study
Target
Application
Results
Discussion
Conclusions
Introduction
The number of high-rise buildings taller than 200 meters is increasing every year. Before the 2000s, high-rise buildings were designed and constructed in a relatively uniform way; but from the 2000s on, high-rise buildings have been constructed with various shapes with improved design, construction, and management technologies [1, 2, 3].
Since high-rise buildings are large-scale construction projects, which require huge construction costs, large-scale resources, manpower, and long construction periods, unexpected risks are more likely to occur during the construction process, than for the middle- or small-scale construction projects [4, 5]. Here, unexpected risk refers to risks that were not extracted in advance in the risk identification stage. As a recent example, a world-class landmark high-rise building has been successfully completed in Jamsil, Seoul, South Korea. However, some unexpected risks occurred during the construction process, which attracted a lot of public attention, and as a result, there was concern about delayed construction. As such, the risk of the construction of high-rise buildings not only affects the construction cost of the construction project and the construction period, but also the image of the construction companies and subcontractors [6, 7]. Therefore, if severe risks that may occur during the construction of high-rise buildings can be anticipated in advance, huge opportunity cost, time, and manpower that are required for construction can be saved [5, 8]. To this end, it is necessary to identify risks that can occur both internally and externally, and to analyze them based on similar projects that have already been completed. Especially, most of the existing studies merely suggest concepts and methods to focus on the production cost management among the cost, process, and quality, which are considered in the management of construction projects, but no methods for using the concept of risk recognition concretely were suggested.
Therefore, the objective of this study is to analyze the risk cases of schedule management for high-rise buildings using a control chart, which manages target management information within upper and lower limits. For this purpose, this study examines the process of high-rise building projects that were actually constructed in Busan, and analyzes the risks of the high-rise building projects using the control chart. By simultaneously presenting important and threatening elements to the schedule management of high-rise building projects, the present study is expected to help the risk management of similar projects in the future.
Preliminary Research
Risk Management
Risk management is a management technique that includes the process of classifying, analyzing, and responding to project risks to maximize the effect of the factors that have a positive impact on the project, and to minimize the results of adverse factors [7, 9, 10, 11, 12, 13].
The risk manager establishes a risk management plan, obtains the approval of the employer, and identifies the issues on the risk with the risk committee and the project manager. In general, the results of the identified risks are assessed by the risk committee, and proper decisions are made to counteract the risk. At this time, countermeasures against risks that can be managed will be established with business managers, and risks that are difficult to manage are registered in a risk list by the risk manager to continuously monitor and manage them.
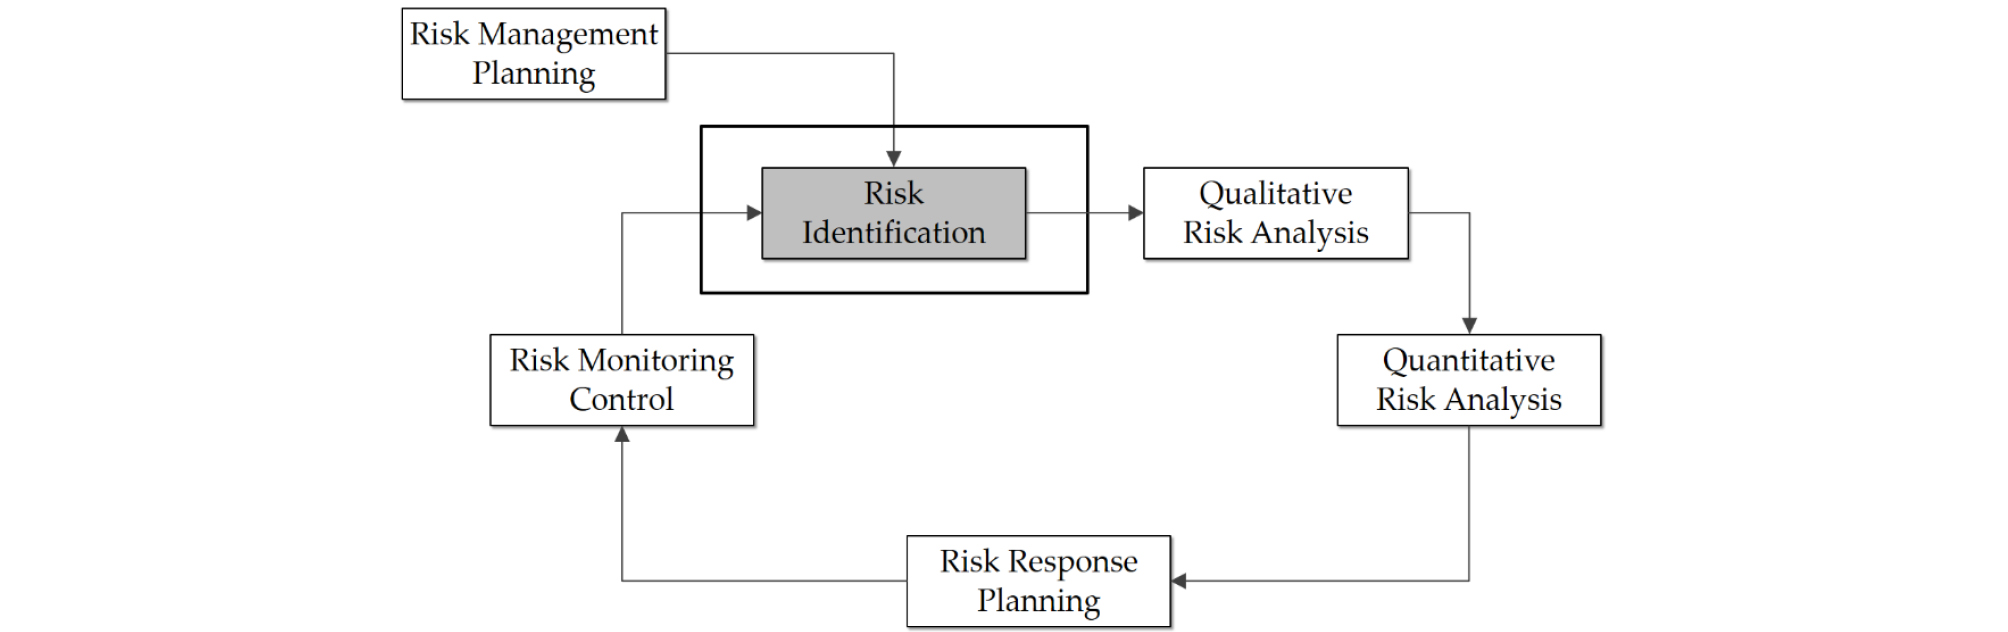
The employer reviews the risk list that is registered in the risk register, and requests that the person in charge carries out the necessary plan for the response, and the risk manager constantly monitors the risk list, and makes efforts to eliminate risks through control actions. The risk eliminated by this effort is assessed to determine whether the risk has been terminated based on the employer’s evaluation results. If the risks that are not easily eliminated occur, the risk countermeasure plan is re-established, and feedback is provided. If the risk is determined to have been completely eliminated, the risk register is revised, and elimination of the risk is reported to the employer. When the employer approves and terminates this process, the risk manager updates and manages the result to the company environmental factors. Figure 1 shows that the risk management procedure is composed of risk identification, risk analysis, and risk response steps [12].
Risk identification
Risk identification is a process of predicting situations that can adversely impact the project, and analyzing and documenting the causes. This consists of risk derivation and risk classification. The risk identification process continues from the pre-launch phase to the launch phase and the planning phase, which is continuously performed during the project by the project team, the project’s risk management organization, stakeholders, and external experts, all working together.
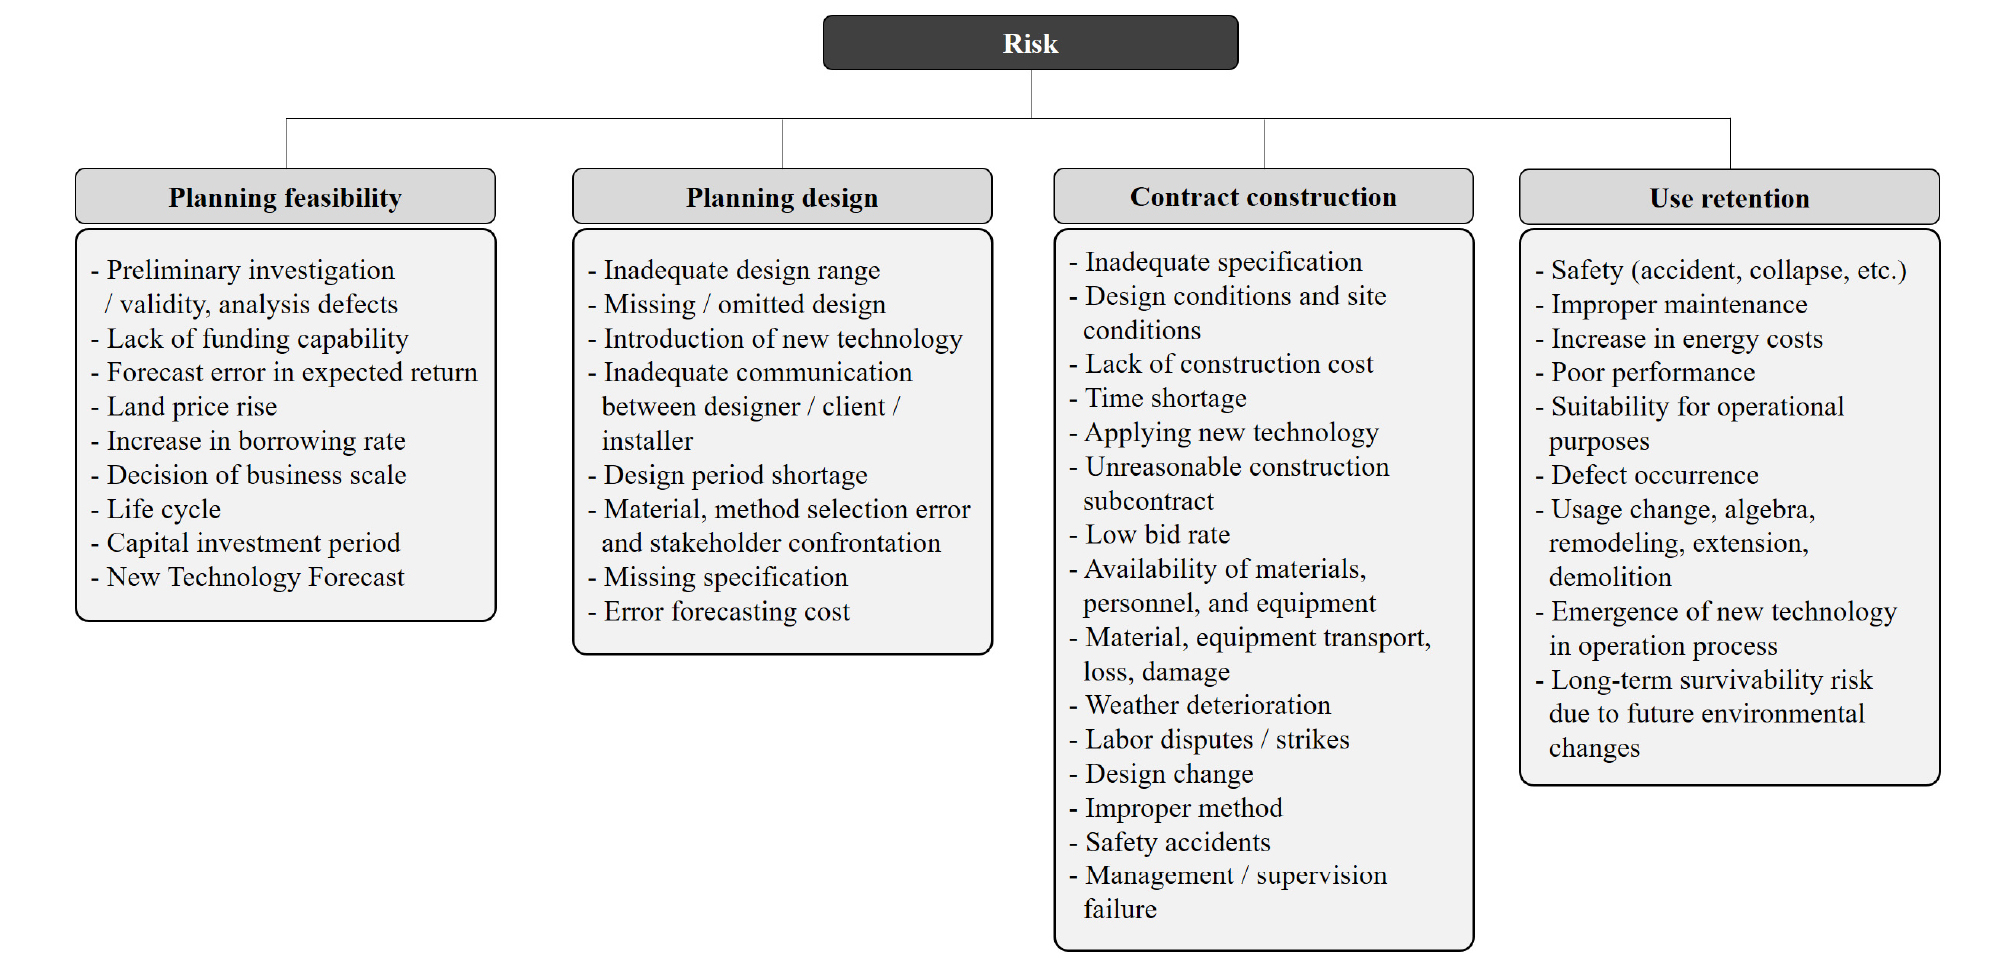
In the case of construction projects whose costs and processes are difficult to determine, the risk factors that can occur during the progress phase can be extracted in advance by internal and external risk experts. In other words, as shown in Table 1 [7, 12], data are collected by referring to the main risk factors that occur according to the risk type, and the collected data are analyzed and accumulated in the risk register [14, 15]. The accumulated risk register is used to develop the project’s risk management model. If the risks are appropriately distributed in a definite range and form, results that are close to the original objective can be obtained with relatively low cost, time and effort.
Table 1. Risk types and factors
If the risk identification is conducted in the early stage of the project, the risk cost of the project can be saved through a proper response. Furthermore, it is very important for risk identification to create an environment where everyone can communicate consistently, so that many experts and stakeholders come together and share their opinions freely.
Risk analysis
Risk analysis is a process of analyzing the importance of risk factors that have been recognized in the risk identification phase using various qualitative or quantitative analysis techniques, and also analyzing the scope of alternatives, or the possibility of establishing a strategy to solve the risk [12]. In other words, at the risk analysis phase, the magnitude and variables of risks are considered as individual effects, and the ripple effects of the risks are comprehensively measured and evaluated. At this time, it is advantageous to analyze the risks using available objective data, but the risks may be analyzed using subjective data, depending on the risk type and other factors.
The rating method is mainly used as a qualitative method of analyzing the risks. This is because it is easy to understand the importance of risk, and practical convenience is excellent when there is a sudden change of situation where there is insufficient data. However, since the rating method is determined by the subjective judgment based on the evaluator’s experience, a quantitative risk analysis method is utilized to complement it. Quantitative risk analysis methods include statistical methods that use statistical data, sensitivity analysis that analyzes the causal relationship of risk factors, impact methods that predict the mutual impacts of risks using probability models, and the Monte Carlo simulation method [7].
Risk response
Risk response aims to eliminate the negative and threatening elements of risks as completely as possible, and to increase control over the risks [7, 12].
The risk response is conducted by establishing and executing a strategy, and the response is implemented by the following four methods: risk transfer, risk avoidance, risk reduction, and risk retention. Risk transfer is a method of passing the potential consequences of a risk to, or sharing them with, other groups through contracts. Risk avoidance is a method of avoiding the potential losses that may occur by avoiding exposure to the risk. Risk reduction is a method of responding to potential risks by reducing the possibility of the risk through a variety of possible means. Risk retention is a method of taking a risk when risk transfer or risk avoidance is not possible. As the risks are generated in various types, it is necessary to appropriately select or utilize these four methods for each risk.
Control chart
Figure 2 shows that the control chart is an efficient management tool. It displays approximate areas for the upper control limit (UCL) and the lower control limit (LCL) in the chart, and easily identifies the information to be managed in the project [9, 16].
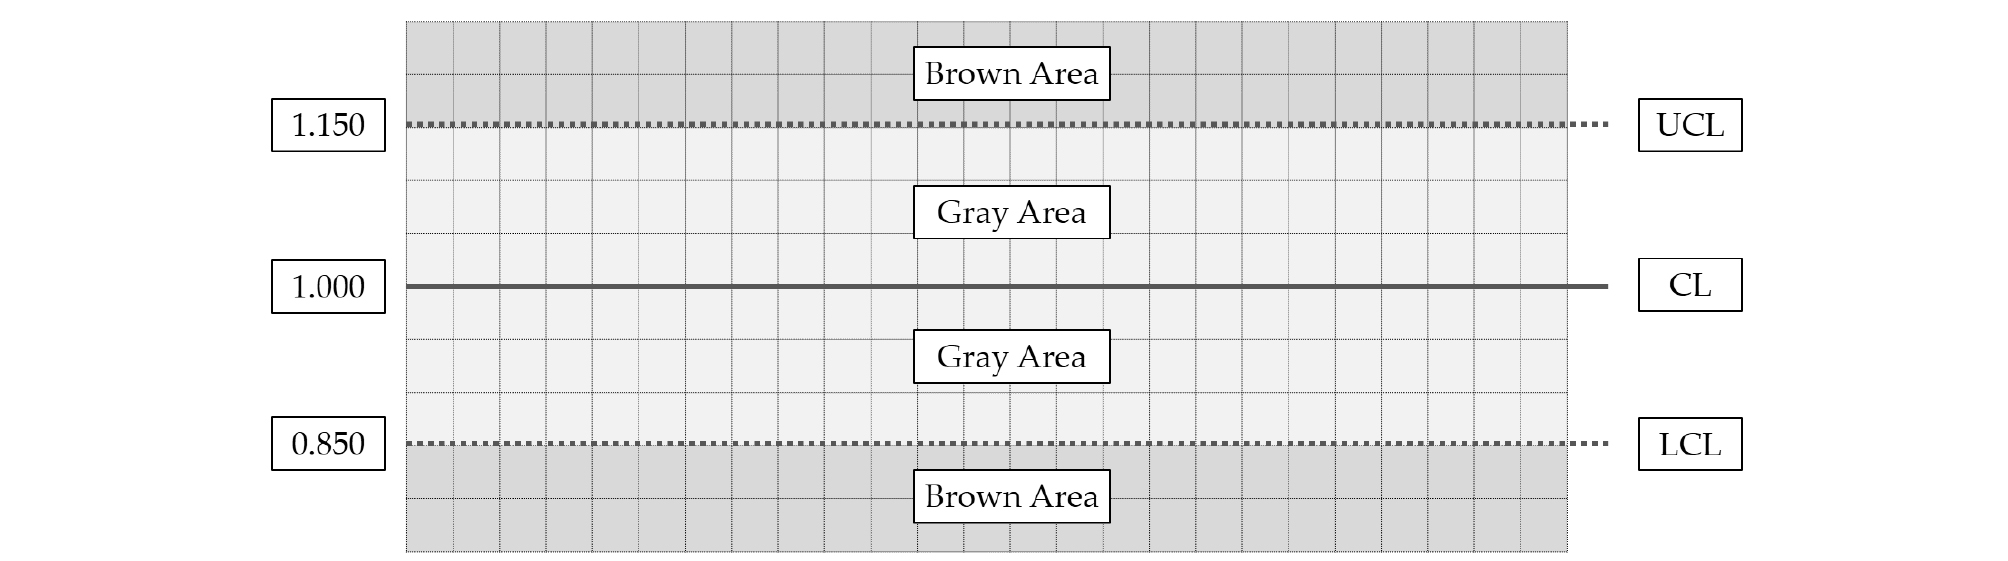
When the Project Management Subject Information (PMSI), which is an index of field data, is used to create a control chart, the UCL and LCL are defined according to the elements of the PMSI, instead of the existing individuals and moving range chart (I-MR chart) [7, 17]. In other words, the meaning of each UCL and LCL can be pessimistic and optimistic depending on the contents of the PMSI element and the exponential formula established through it. Therefore, since the management criteria of UCL and LCL can vary depending on the characteristics of the PMSI element, the field data should be converted to the PMSI, and reviewed, before appropriately setting the UCL and LCL.
Case Study
Target
A case study was conducted on the M tower residential apartment complex, which was constructed in Haeundae, Busan, South Korea. This building is a high-rise building of 40 stories with a height of 220 meters above ground level. Table 2 describes the main properties of this targeted building.
Table 2. Overview of Busan M Tower residential apartment complex
Application
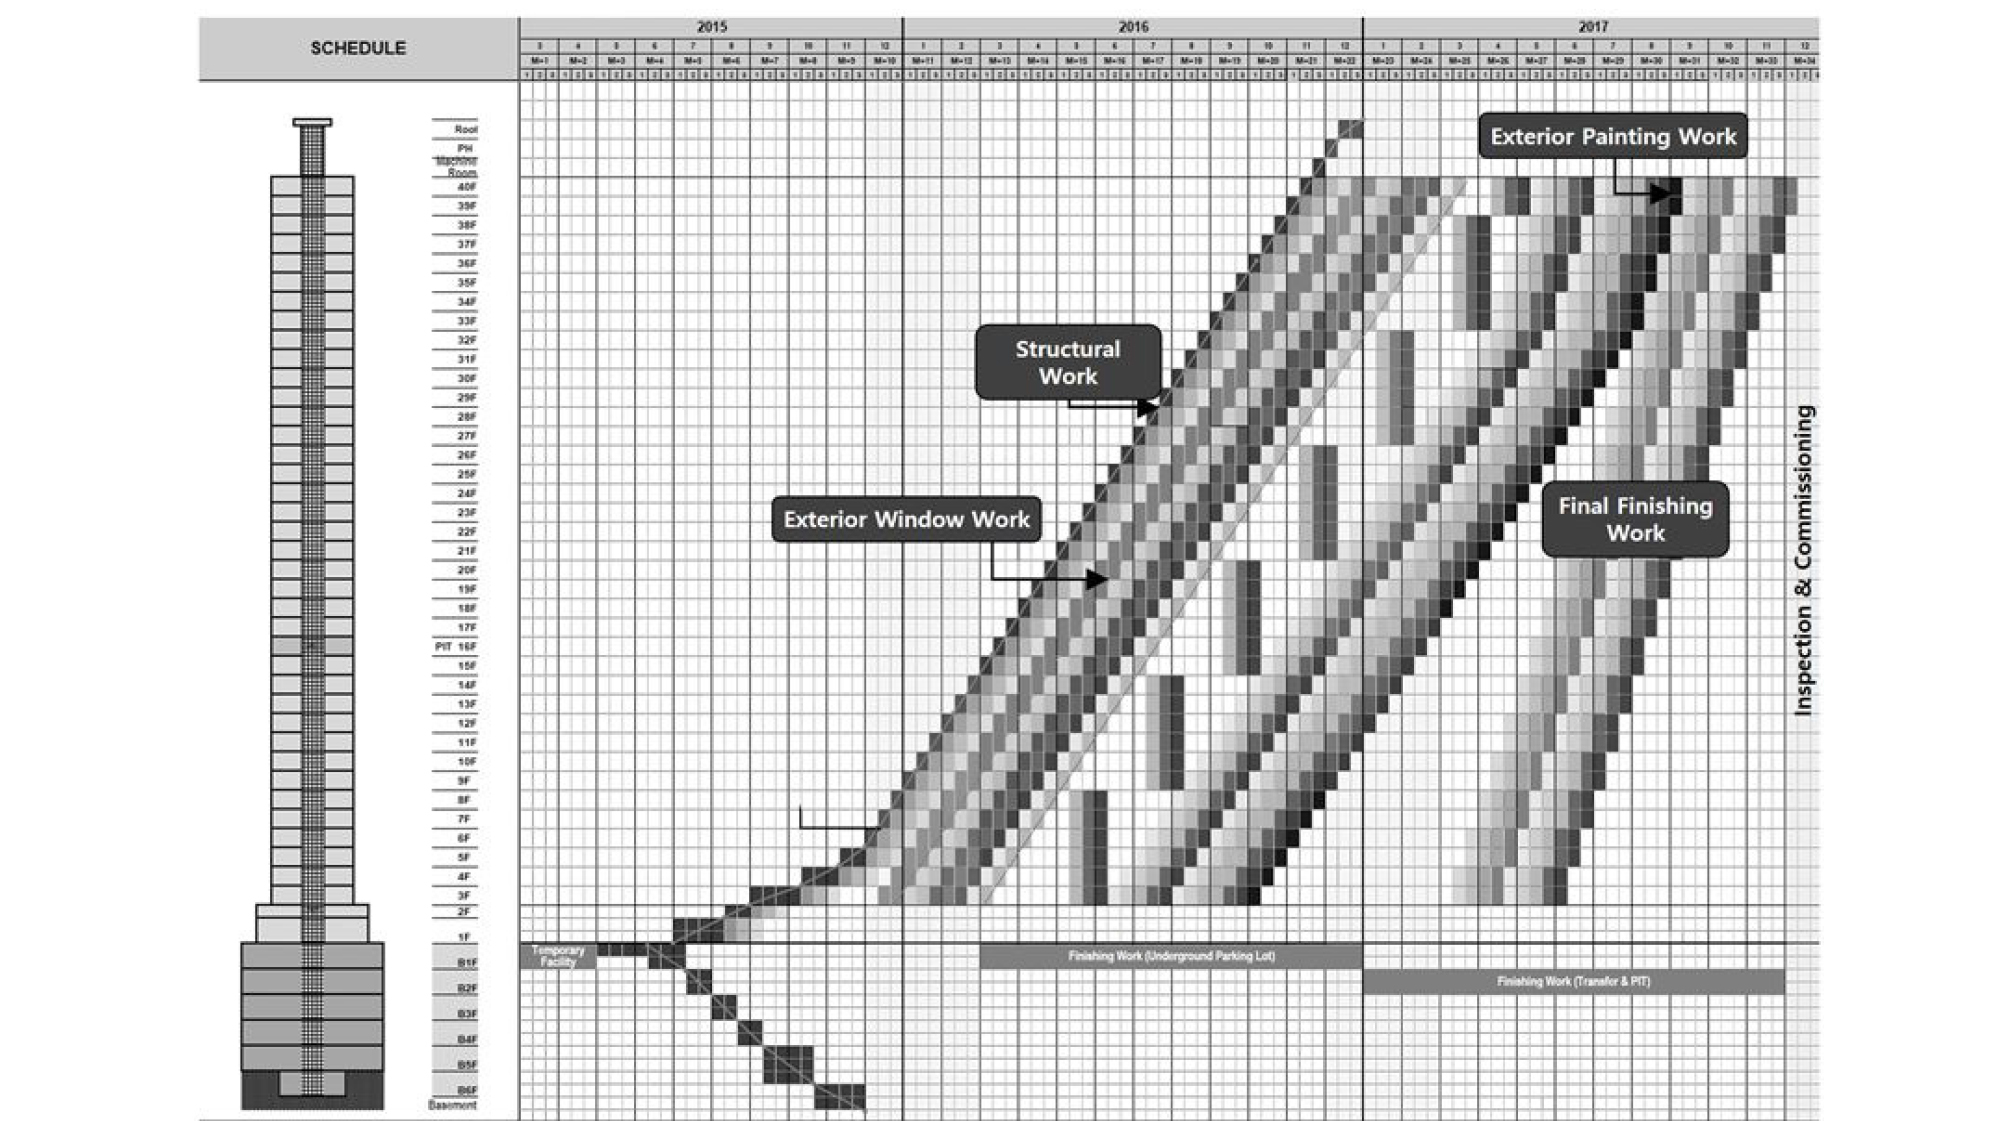
This study referred to the construction records of the Busan M Tower residential apartment complex project to analyze the management characteristics of high-rise buildings. In particular, the process table using the line of balance (LOB) technique was used, as shown in Figure 3. LOB is a management method for presenting facts relating to time, cost and accomplishment against a specific plan. According to the process table, building construction was scheduled for 2015-2017, and residence occupancy was scheduled at the end of 2017. However, a construction delay of about 16 months occurred, due to the lack of countermeasures against the risks, causing massive financial losses. As a result, the developer’s total loss amounted to about 30 billion won, due to delays in residence occupancy, financial interest in total project costs, and project disruptions, such as accidents and disasters.
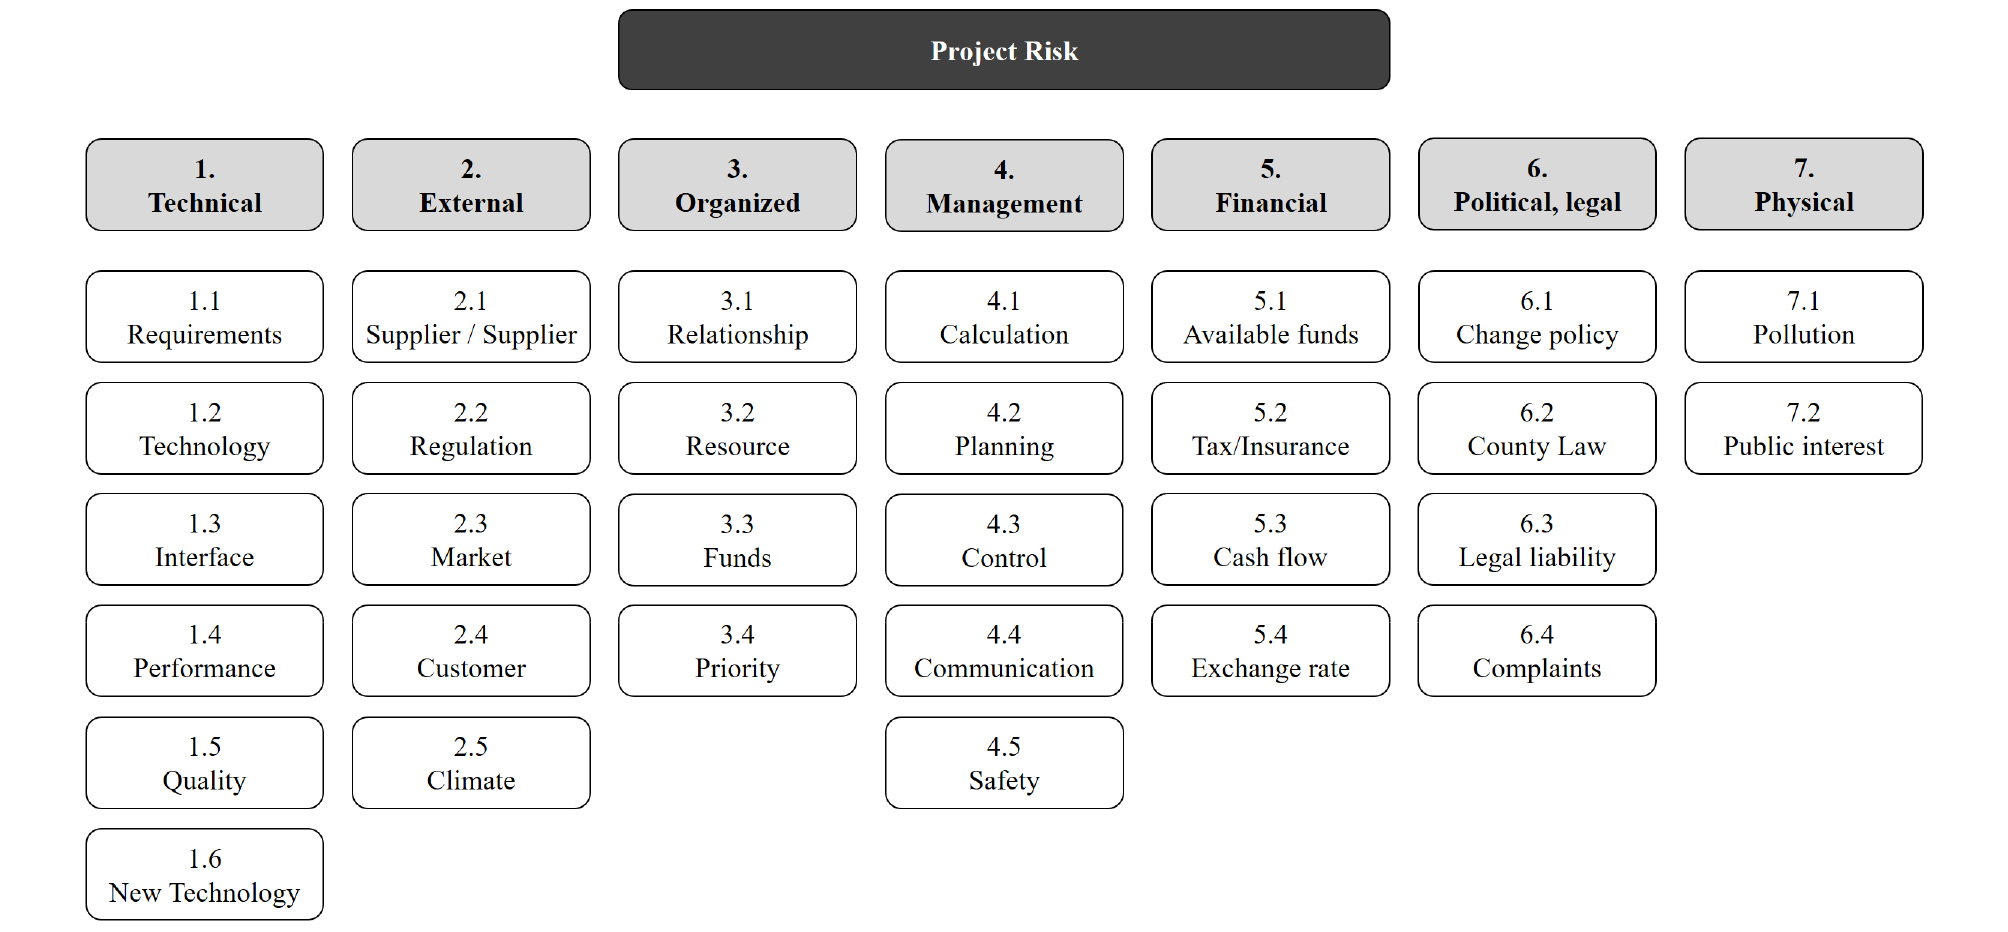
Consequently, the project’s schedule management emerged as the biggest issue, due to the construction delay of about 16 months. In order to solve this problem in this case study, major risk factors to reduce the construction delay were selected through the risk break structure (RBS) which is a hierarchical representation of risks according to risk categories, as shown in Figure 4, and detailed factors for each major factor were analyzed. Based on the results of the factor analysis, quantification work for management was started. The control chart for the subcontractor, which is a component element of the risk, was developed using the process table of the Busan M Tower residential apartment complex shown in Figure 3 and the risk classification system shown in Figure 5.
Results
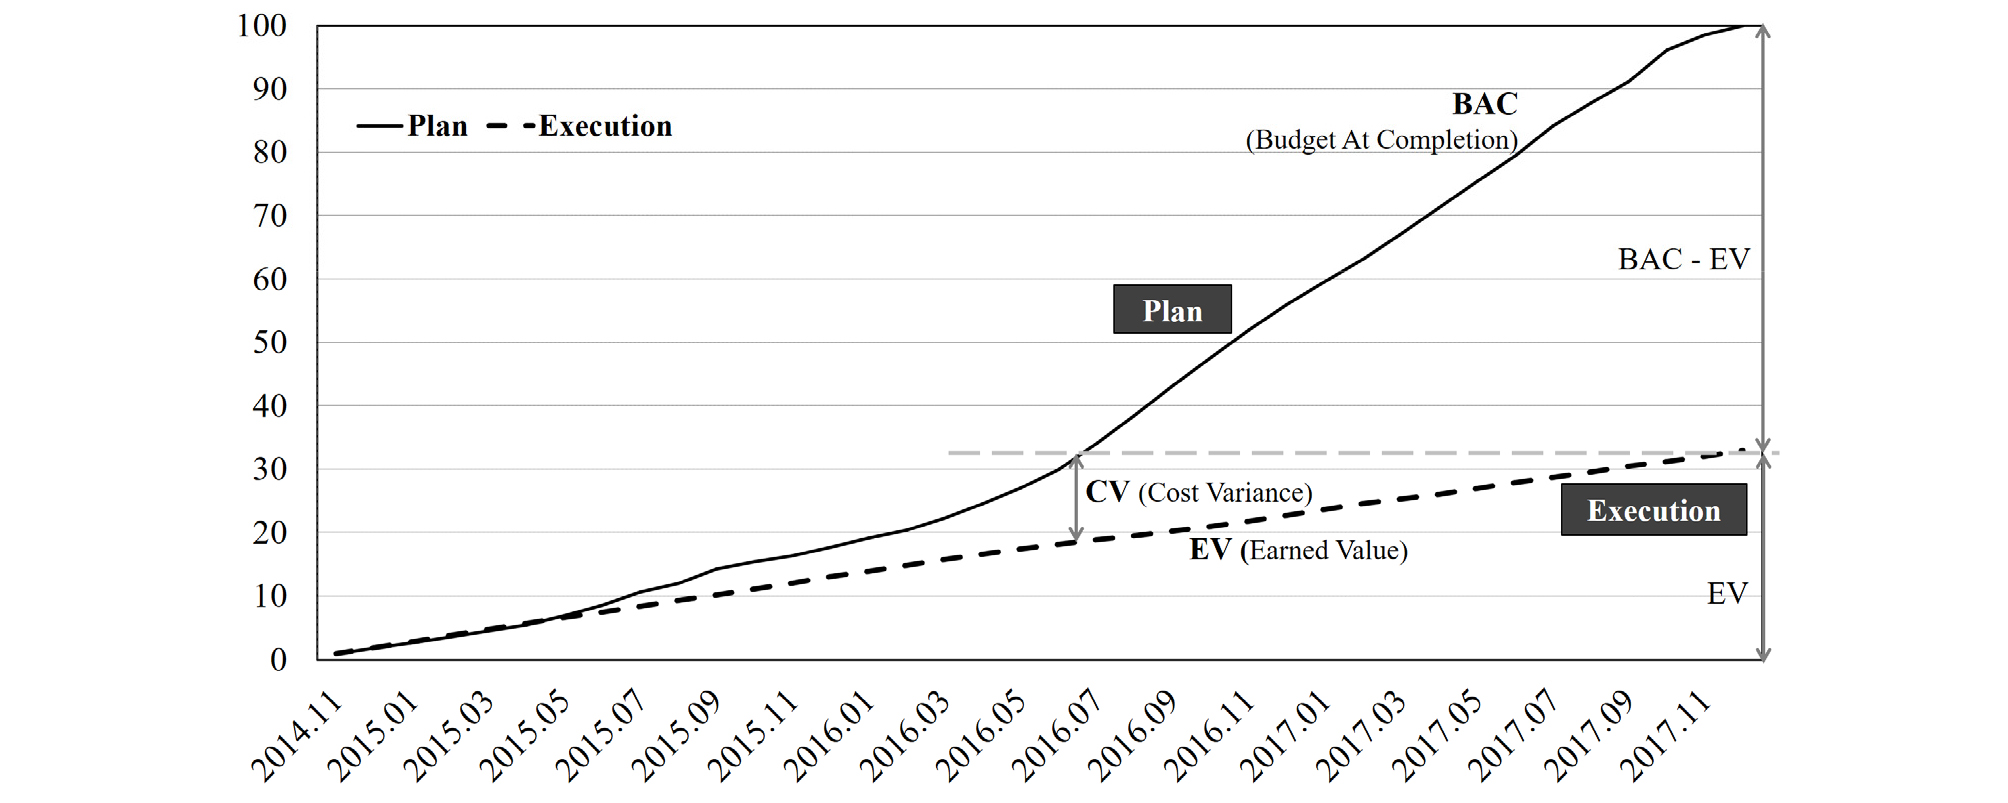
In this study, the upper and lower limits for the control chart were set to ±15 %. This is because special measures are necessary to recover the execution rate when the task actually begins to deviate from ± 15 % of the plan in the practice work. As a result, the time where it deviated to the lower limit, such as Risk 2.1, Risk 5.1, Risk 1.3, and Risk 6.4 shown in Table 3 and Figure 6, was found. In Risk 2.1, although this was a situation that was sufficient for the risk detectors to recognize that it represented a significant risk, the detectors did not register the risk in the risk register to manage it, but neglected it. As a result, as shown in the cumulative graph in Figure 7, the risk resulted in the delay in the construction, and the changes in September, October, and November 2016 resulted in enormous changes in the quality process. Changes in May 2016 (Risk 2.1) are the result of process delays, and internal subcontractors’ defaults are likely the cause for the change. It took about three months to resolve the subcontractor’s bankruptcy, which led to failure in making up for the process delay.
Table 3. Major risk of the Busan M Tower residential apartment complex
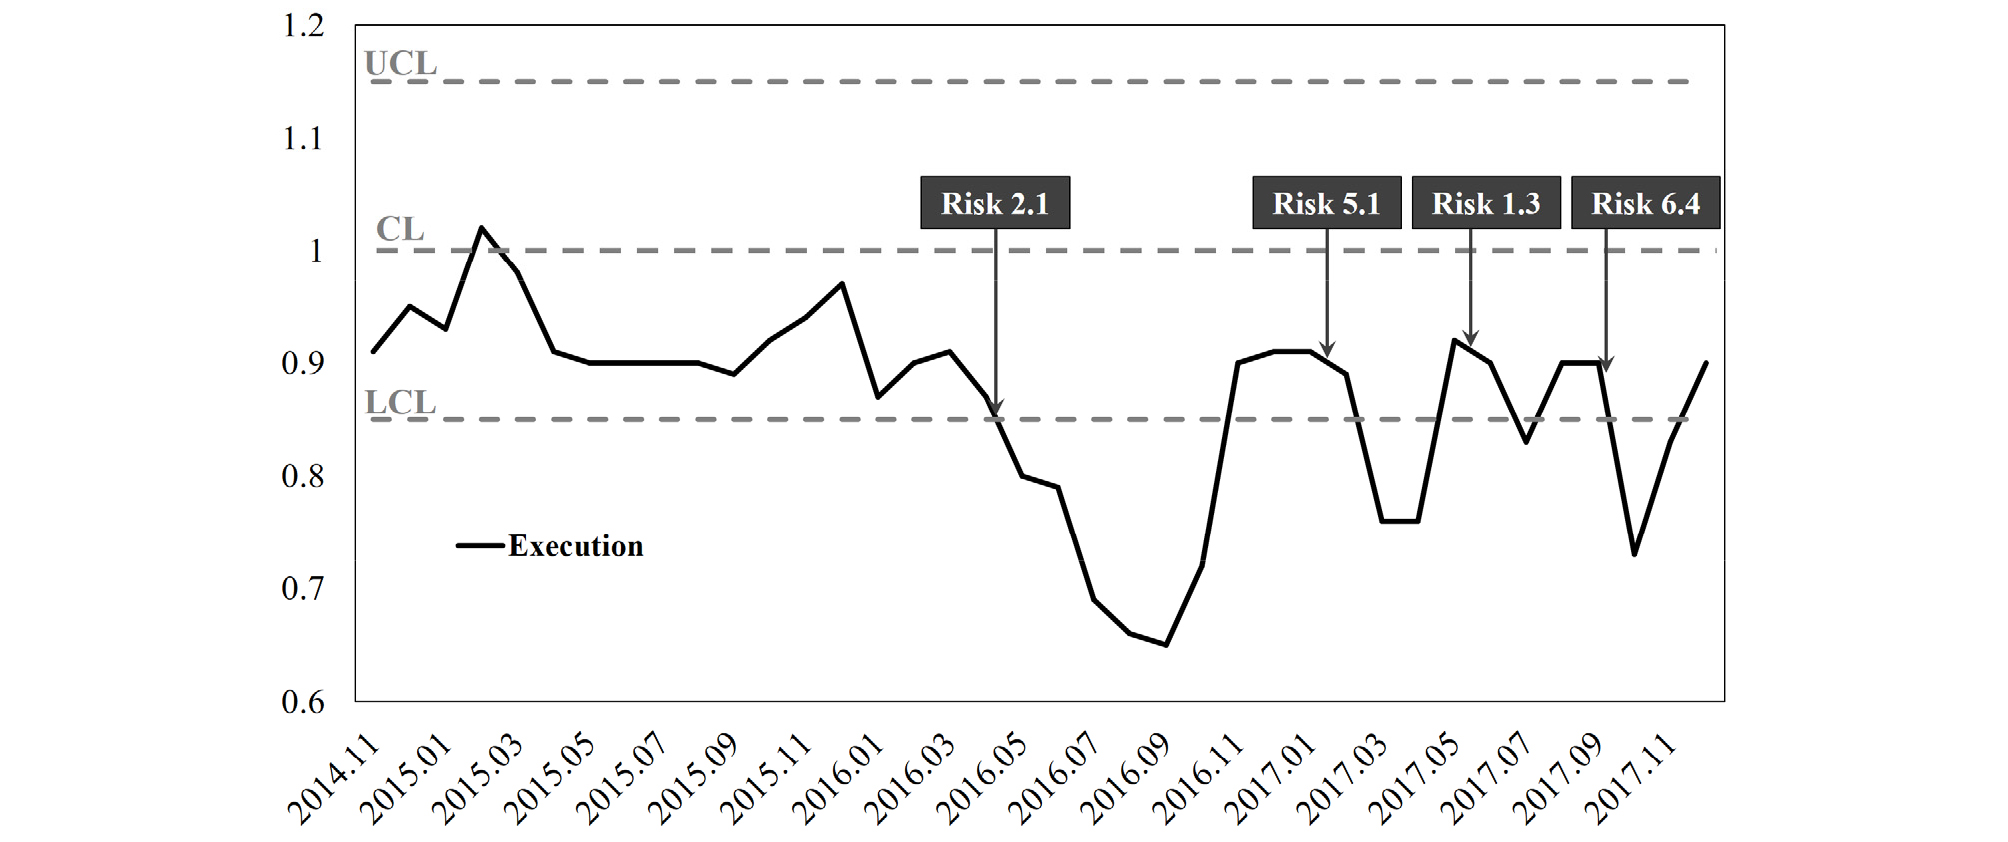
Risk 5.1, which appeared afterward, was caused by the lack of available funds of the constructor, and Risk 1.3 seems to be affected by the stakeholder’s trust. In addition, Risk 6.4 was considered to be a conflict with the prospective tenant due to the construction delay, and project developers are expected to compensate the tenant for damages in the future.
As a result, as shown in the cumulative graph in Figure 7, from November 2015, it seemed to deviate from the control line, and caused a significant impact on quality. Also, the failure to recognize the bankruptcy risk of the framework subcontractor in April 2016 caused damage to the entire project, and resulted in an incomplete process within the planned period. Even though there was sufficient time to recover the damage if the risks were recognized, it delayed the entire process by 16 months, and caused a loss of about 32 billion won in construction costs. Therefore, the absence of integrated risk management by the developer limited the success of the project.
Discussion
This study used the concept of the risk management model to suggest the importance of project risk management in an actual high-rise building project with enormous resources and manpower, and this was analyzed using the control chart. As shown in this case study, by using the control chart developed for the process, a management system to manage overall risk and to complete the project at the right time can be established, and based on which the schedule management of this case study project can show how the risks change. Finally, the results can be used to assess the severity of the risk.
From this point of view, the objective of this study is to propose a risk management method that can be used more easily and efficiently on site by implementers, contractors, subcontractors, and suppliers. In other words, as shown in Figure 6, there were cases where the concept of risk recognition was suggested and used through the process control chart. However, these studies merely suggest concepts and methods to focus on the production cost management among the cost, process, and quality, which are considered in the management of construction projects, but no methods for using the concept of risk recognition concretely were suggested. Therefore, the present study focuses on how to use risk management specifically as a process concept, so that it can be applied more quickly and conveniently to construction site management. In other words, the present study presented a method to easily identify the process, cost, and quality data, which are the three most important factors that should be managed at the construction site by presenting the data in one graph.
Conclusions
This study systematically modeled the risk project management method that can be usefully applied to high-rise building projects, which are accompanied by enormous resources and manpower, by using the concept of risk management, and applied the method retrospectively to the M Tower residential apartment complex in Busan. The risk management model was used as a technology model that suggests the risk selection and utilization methods to practically use the project management work, and this model was applied to the construction case study of the M Tower residential apartment complex in Busan. The following conclusions were obtained:
1.Even though it was found that the planned process deviated to the lower management limit, it was neglected, causing a delay in the cumulative graph. The changes in September, October, and November 2016 to recover the process resulted in enormous changes in quality processes. The changes in May 2016 are the result of the process delay, and the internal subcontractor’s bankruptcy is likely the cause of the changes. It took about three months to resolve the consequence of the bankruptcy of the subcontractor, which resulted in a situation that could not be resolved. From November 2015, it was found that the planned process deviated from the control line, and had a significant impact on quality. Also, the failure to recognize the bankruptcy risk of the framework subcontractor in April 2016 was found to have damaged the entire project, preventing it from completion by the planned schedule. Even though there was sufficient time to recover the damage if the risks were recognized, it delayed the entire process by 16 months, and caused a loss of about 30 billion won in construction costs.
2.The present study uses the concept of risk management and its utilization model to estimate the changes that affect the risk for management of critical and special projects, such as the high-rise construction project. As a result, it will provide an opportunity to secure original technology in the field of international high-rise construction project management, and basic research will be necessary to develop a risk project management system using various advanced technologies. Through this process, the present study is expected to contribute to improving construction efficiency in the long term.
