

Introduction
Background and literature review
Research Methods
Case study selection and data collection
Project descriptions for case studies
Comparative Analysis Results
Sustainable Sites
Water Efficiency
Energy and Atmosphere
Materials and Resources
Indoor Environmental Quality
Discussion and Conclusions
Limitations and future studies
Introduction
Humanity experiences the effects of climate change every day, due to excessive use of fossil fuels. This is a global problem that threatens the survival of life, and calls for technology and policies to cope with it. In particular, the construction sector, along with the industrial and transportation sectors, accounts for a large portion of energy consumption [1].
Campus buildings are unique in that most users do not directly bear the costs. As higher education institutions responsible for the education of society, and as community leaders, it is imperative that universities make efforts to confront the climate crisis. The “green campus” idea is one of many such efforts, which can increase environmental awareness through environmental education and campaigns. Practical benefits of green campuses include the reduction of university operating costs through more efficient energy use, health improvement of the active users of university buildings, and the creation of healthy indoor and outdoor environments.
In order to effectively respond to the challenges of climate change caused by global warming, universities have formed coalitions to actively share ideas, information, and best practices to create green campuses. Examples include the International Sustainable Campus Network (ISCN), the Association for the Advancement of Sustainability in Higher Education (AASHE), and the American College University President Climate Committee (ACUPCC). Among them, the ACUPCC implementation guide recommends that all new constructions meet standards corresponding to or higher than the Silver certification level of the Leadership in Energy and Environmental Design (LEED) rating system (developed by the U.S. Green Building Council [USGBC]). In other words, such universities are contributing to the creation of green buildings on campuses by satisfying the established green building criteria both quantitatively and qualitatively.
Since the introduction of the LEED certification system and its earnest application in 2005, there have been various studies of LEED scores. However, individual case studies based on specific building types are relatively rare. Laboratory buildings in particular are energy-intensive and expensive to build, and therefore are burdened with some of the largest environmental loads, along with healthcare buildings. Therefore, it is necessary to investigate green building strategies and principles for contemporary university-level laboratory facilities. These strategies can provide insights and knowledge for university administrators and design professionals in achieving high-performing laboratories and energy-efficient campus planning. Additionally, these strategies will significantly impact future laboratory programming, planning and design, and operation and maintenance (O&M) practice.
The objective of this paper is to provide eight case studies of green building strategies in the development and operation of their respective laboratory facilities and identify common and distinct strategies that were implemented, corresponding to each campus context. This study examines the difference between Gold and Platinum level building strategies rather than focusing on Silver or Certified level cases where certification is relatively easy to obtain without extra costs [2]. As such, this paper contributes insights for design professionals and related industries by identifying university-level laboratories’ integrated design approaches through an analysis of their LEED credit achievements.
Background and literature review
Laboratory buildings are developed to conduct various experiments and practices, and require plentiful resources to build and maintain. Unlike any other higher education facilities, this building type demands energy-intensive ventilation. Securing 100% outside air for ventilation is mandatory to prevent cross-contamination: laboratories require high air change per hour (ACH) in order to release air contaminated through various experiments. Additionally, laboratory buildings contain heat-generating experimental equipment and devices which may require 24-hour operation. Typical examples include fume hoods, which are confined ventilation devices requiring energy-intensive fan power designed to limit researchers’ exposure when handling hazardous materials. Consequently, research laboratories are 10 to 100 times more energy-intensive than general office buildings [3, 4]. In addition to the maintenance and operating costs of such buildings, mechanical ventilators, refrigerators, freezers to establish the optimal research laboratory environment and mechanical, electrical, and plumbing (MEP) equipment account for 50% of the construction costs [5]. In response to these issues, there have been critical analyses of the current status and causes of energy use in laboratory buildings.
Mills et al. [6] analyzed California’s statewide gross laboratory area and energy use and revealed that their energy intensities are four to five times larger than non-laboratory buildings; in the case of cleanrooms, energy intensities are ten to a hundred times higher. High performance practice, however, can lead to a potential energy use reduction of up to 50% by minimizing the load, right sizing for energy efficiency, energy monitoring, and variable lab control practice at both new constructions and existing facilities. Sartor et al. [3] suggested hybrid benchmarking methods to evaluate and improve laboratory energy efficiency by implementing three modules of a multilevel approach, using: 1) whole building data and metrics, 2) end use data and metrics input, and 3) performance rating. By reducing the need for outside air (the largest energy use factor in a lab), installing demand-based control (DBC), chilled beams, and heat recovery, Sharp [7] proposed that it is possible to reduce laboratory energy use by up to 50%.
In addition to introducing laboratory-specific mechanical operation and equipment strategies, behavioral changes have been studied to identify ways to reduce energy use in the lab. Brewer et al. [8] conducted research at Duke University and identified that energy savings can be accomplished by means of education campaigns: 1) reminding users of the importance of lowering the fume hood sash, 2) communicating with lab operators on an individual basis. Accordingly, annual savings of $30,000 were achieved with 35% user compliance. Woolliams et al. [9] observed and analyzed the frequency and duration of usage by lab occupants at the Harvard School of Public Health and found that behavioral changes can yield considerable energy savings by effective rescheduling of the heating, ventilation and air conditioning (HVAC) running hours.
Studies have also been conducted to determine the correlation between LEED certification levels and the additional costs required. Matthiessen and Morris [10] conducted a study by building type, but cost differences between certified and uncertified buildings were not statistically identified. The was due to the wide variation in construction cost inputs in accordance with particular conditions required for each building, whether certified or uncertified. This was especially true for laboratory buildings. No statistically significant results were derived, even with comparisons limited to wet laboratories, where energy consumption is higher. Statistically significant differences between LEED- and non-LEED-certified buildings were still not derived when, four years later in 2007, a cost analysis of laboratory buildings was conducted [11]. Lesniewski et al. [12] compared costs within the general population of the wet laboratories group and revealed that there is a wide and varied range of costs between green and business-as-usual control buildings, and project teams were able to produce high-performance laboratory buildings without added cost premiums. Kats et al. [13] compared 25 office buildings and 8 school buildings in California and suggested cost premiums ranged from 0.66% to 6.5% according to the LEED certification level. This correlation is neither linear nor consistent across certification grade. Above all, it was indicated that the financial benefits of the green buildings come from energy and emissions (13%) as well as productivity and health (70%) based on the analysis of LEED Silver and Certified buildings. Thus, while initial costs may increase in the pursuit of LEED certification, this initial outlay can be seen as the cost of the Architecture and Engineering (A/E) team’s integrated design and development of eco-friendly buildings [13]. In the long run, green buildings have positive effects such as saving energy, water, and other resources, promoting users' health and productivity, and ultimately promoting the building’s value.
In addition to calculating the additional costs of LEED certification, a study was conducted to analyze the correlation between LEED certification levels and the building’s energy use, but there were difficulties in identifying a clear correlation between the two. Amiri et al. [14] reviewed 44 research articles on the relation between LEED-certified buildings and energy efficiency and identified that 10 of them revealed increased energy efficiency in LEED certified buildings, however, 8 papers indicated the opposite results. The rest did not take any position on this matter. Sullivan and Oates [15] examined and collected energy consumption data of 53 LEED New Construction buildings in Arizona and failed to demonstrate statistically significant correlations. Therefore, a study to understand holistic green building performance is needed to better position sustainable building design and construction.
The abovementioned studies have revealed no apparent correlation between energy savings and additional construction costs depending on the certification level. In terms of return on investment, it is true that uncertainty exists and that there are wide case-by-case variations for each building [10, 11]. Therefore, there are limitations to existing studies [16, 17, 18, 19] that simply analyze the relationship between certification levels and correlation between criteria within a level, and derive implications from an analysis of obtained points without reflecting on the specific conditions of each building. Therefore, the time is ripe for case studies which present various insights on energy-efficient and environmentally sustainable building design processes, based on buildings constructed in accordance with the established best practice standards and guidelines of the LEED system.
As if to reflect this trend, there has recently been a significant amount of studies using LEED-certified buildings as data sources, contingent on areas which have LEED-certified buildings, certification types, specific certification credits or categories, and building types. Studies have derived significant point distribution results within a region where LEED-certified buildings are located, such as for the Canadian context [20], as well comparing of regional variations of LEED scoring in four countries [17]. Studying LEED Gold- or Silver-certified commercial interiors projects, Pushkar and Verbitsky [21] analyzed the distribution of obtained credits from three perspectives: certification, category, and cross-analysis between certification levels. In addition, case studies of specific LEED certification levels were conducted on hotels [22] and university recreational facilities [23]. As such, research on LEED-certified buildings is expanding to include diversified standards.
Therefore, it is time to understand the challenges and opportunities involved in realizing laboratory facilities to preemptively inform their planning and design, and extend upon preceding studies. Although case studies of green research laboratories have been partially introduced in various publications, recent studies that have comprehensively identified green building strategies through LEED categories are rare. Therefore, a holistically examined LEED case study is necessary to contribute insights for university stakeholders who are paying energy costs and competing to attract competent researchers and students, as well as designers and construction groups planning future green laboratory projects. In this context, understanding in advance which strategies are effective and which strategies are not being implemented is essential to undertake the LEED certification process. Therefore, the goal of this study is to investigate the integrated design methods and technical approaches in university-level laboratory buildings and to provide fundamental data as a basis for future laboratory planning.
Research Methods
The case study method was adopted for the present study because it allows for a comprehensive, in-depth analysis of the strategies used in designing and constructing green laboratory facilities. This research method has several advantages, because it provides: 1) richer and more meaningful information by studying phenomena through various sources of data; 2) appropriate research design methods for various purposes, such as exploratory, explanatory, technical, and evaluative research; 3) an integrated understanding of the studied phenomena and context, making it relevant to all participants in the design process, and 4) an understanding of the problem through cases that is easier for the reader to follow. As the case study focuses on a specific case, it is difficult to generalize the results of this type of study, so there may be limitations in verifying the validity and reliability of the results. However, the case study is widely accepted in the social science field because it enables understanding of specific phenomena and contexts in a comprehensive and detailed manner.
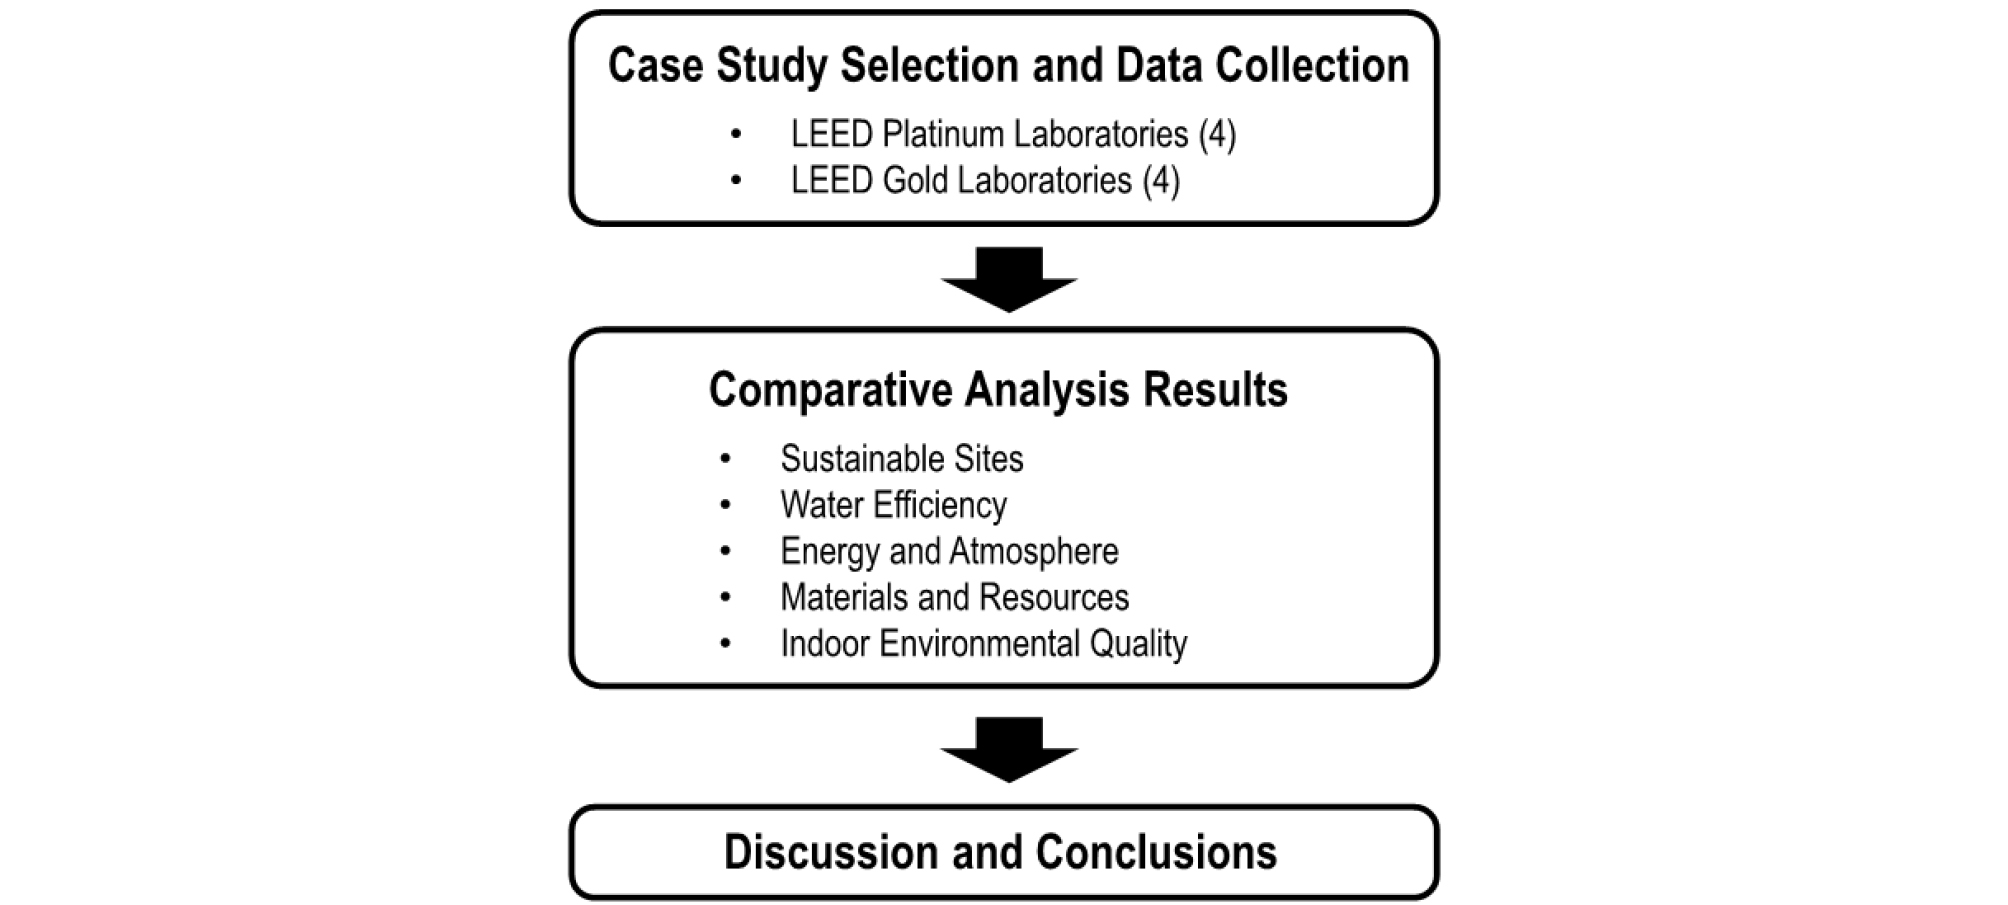
Case study data were collected from university webpages and the publications of architectural and engineering consultants. The following section will describe the features of each laboratory facility case, and Table 1 summarizes the project information and descriptions, including LEED rating levels. The subsequent comparative analysis will be made in light of the categories presented in the USGBC’s LEED green building rating system. Finally, the results of the comparative analysis and a discussion will be presented. Finally, the study conclusions and limitations will be described (Figure 1).
Table 1.
Comparison of LEED-certified laboratory buildings
Case study selection and data collection
The LEED 2009 version was developed to reflect the 13 impacts of human activity [24]. Because of the emphasis placed on controlling carbon emissions, EAc1: Optimize Energy Performance credit is emphasized and increased in weightings compared to the previous version of LEED (version 2.2). At the time of the present study, enough data regarding LEED 2009 certified buildings had been accumulated. From 2012 to 2019, 256 laboratory buildings were registered in the USGBC LEED directory. Eight LEED-certified research laboratories were selected from four Platinum level and four Gold level and compared to investigate the green buildings strategies that achieved the highest ratings.
Project descriptions for case studies
In total, eight laboratory facilities were selected and compared to investigate the green building strategies that each university campus used to achieve the target LEED level. Data were collected from various sources, including the universities themselves and design consultants. Table 1 summarizes each project brief, including the construction cost, unit cost, and LEED rating level. All facilities were certified under version 3.0 (LEED 2009 for New Construction and Major Renovation), with a possible total of 110 points. Cases 1–4, i.e., Coppin State University (CSU), Northern Arizona University (NAU), University of California Berkeley (UCB), and University of Illinois at Urbana Champaign (UIUC), earned LEED Gold certification and their costs per square meter were $5952, $5026, $8234, and $4370, respectively. Cases 5–8, i.e., Georgia Tech (GT), University of Oregon (UO), College of Lake County (CLC), and California Institute of Technology (CIT) earned LEED Platinum certification and their costs per square foot were $4951, $6792, $6124, and $5134 respectively. Cases 6 and 7 are the first LEED Platinum facilities in their institutions. Cases 4 and 8 are renovation projects and the rest are new construction projects.
Case 1: Coppin State University Science and Technology Center (CSU STC)
CSU, located in Baltimore, Maryland, has a commitment to respond to global climate change and develop a more sustainable campus and environment as an active member of the ACUPCC since March 2008. CSU has set the goal that all new and renovated campus buildings should achieve a minimum of LEED Silver standards. The Science and Technology Center (STC) is approximately 13,935 square meters in size and houses various scientific disciplines including natural sciences, biology, physics, chemistry, general sciences, and environmental sciences. Its goal is to prepare students to pursue careers in the science and technology industry. The STC was awarded LEED Gold certification in July 2017 with 60 points.
Case 2: Northern Arizona University Science and Health Building (NAU SHB)
The Science and Health Building (SHB) at NAU was one of the first LEED Gold-certified Science and Technology educational facilities to respond to the green campus initiative. NAU responded to growing enrolment in STEM fields by constructing the new 11,334 square meter educational research facility accommodating teaching and research labs, classrooms, faculty offices, lecture halls, and interaction rooms. SHB was awarded LEED Gold certification in July 2017 with 61 points [25].
Case 3: University of California Berkeley Energy Biosciences Building (UCB EBB)
The Energy Biosciences Building (EBB) at UCB is a five-story state of the art research laboratory facility that develops solutions to global energy challenges. It runs as a public private partnership incorporating UC Berkeley, Lawrence Berkeley National Laboratory, University of Illinois at Urbana-Champaign, and BP, the global oil and gas company. The facility is spread across 10,498 square meters of facilities ranging from laboratories (molecular, microbial biology, fermentation, and chemical separation) to offices, conference areas, kitchenettes, a lobby, and an auditorium. The UCB EBB was awarded LEED Gold status in January 2014 with 72 points.
Case 4: University of Illinois at Urbana Champaign, Everitt Laboratory (UIUC EL)
The Everitt Laboratory (EL) was originally built in 1949 for electrical engineering at UIUC, and underwent a major remodeling process to provide state of the art research and experimental facilities necessary to educate the next generation of bioengineering faculty. Its multidisciplinary research area includes a jump simulation center, biomedical instrumentation lab, physical instructional lab, senior design lab, cell and tissue instructional lab, active learning classrooms, and faculty research labs. The UIUC EL renovation project was awarded LEED Gold status in August 2019 with 64 points.
Case 5: Georgia Tech Engineered Biosystems Building (GT EBB)
GT’s Engineered Biosystems Building (EBB) is one of the five LEED Platinum-certified projects on campuses as of June 2020. This building unites for the first time researchers from two colleges (the College of Engineering and the College of Science) in the same facility to reinforce physical integration between researchers focused on chemical biology, cell biology, or systems biology. In November 2016, the EBB facility achieved LEED Platinum status by obtaining a total of 82 points.
Case 6: University of Oregon Lewis Integrative Science Building (UO LISB)
The Lewis Integrative Science Building (LISB) facilitates the interdisciplinary values of UO, both programmatically, as a new home to several research groups exploring questions that fall outside traditional departmental boundaries, and geographically, by linking four existing research facilities across a range of scientific disciplines. This cutting-edge facility includes new lab space for biologists, chemists, psychologists, neurologists, and computer scientists, neuroimaging and nanoscale materials characterization facilities, and a vivarium under one roof. The LISB houses 2,787 square meters of laboratory space for life and materials sciences, 46 faculty offices, office space for graduate and post-doctoral students, and 10 collaboration and meeting spaces [26, 27]. The LISB was recognized with a LEED Platinum rating in December 2013 with 84 points.
Case 7: College of Lake County Science and Engineering Building (CLC SEB)
The new, 42,000 square foot Science and Engineering Building (SEB) reinforces the College of Lake County’s STEM education programs. The SEB creates additional spaces for labs, teaching prep, and storage space for both Biological and Health Sciences division and the Engineering, Math and Physical Sciences division, preparing students for demanding careers. In addition, as a member of ACUPCC, CLC’s is committed to sustainability and environmental stewardship. The facility was recognized as CLC’s first LEED Platinum certified building in February 2019 with 90 points.
Case 8: California Institute of Technology Jorgensen Laboratory (CIT JL)
The Jorgensen building was originally built in 1971 and was completely renovated and reborn as the Resnick Institute, hosting a multi-disciplinary group of scientists dedicated to researching innovative energy technology. The project comprised 3,716 square meters of renovation and a 929 square meter addition to the original facility. In accordance with the institute’s mission to shape a more sustainable future, the project achieved LEED Platinum certification with 87 points.
Comparative Analysis Results
Case comparison was performed according to LEED’s five categories: Sustainable Sites, Water Efficiency, Energy and Atmosphere, Materials and Resources, and Indoor Environmental Quality. All the case studies are certified under the 2009 rating system comprising 100 base points with an additional 10 points available in Innovation in Design and Regional Priority categories. The following section will investigate the case studies’ sustainable design practices aimed at making high-performance laboratories with healthy working environments.
Sustainable Sites
Buildings in any form affect their surrounding environment from the moment they are built. The Sustainable Sites category emphasizes the minimization of the building’s impact on ecosystems and waterways, while encouraging regionally appropriate landscaping and water management. In addition, the impact of the site selection depends on whether it is located in pre-developed, brownfield land or on green open space land. Selecting an urban site can make construction logistics, site security, and other issues more complicated, but from an environmental viewpoint it takes advantage of existing infrastructure, transportation networks, and the embodied energy of all the amenities. In addition, gaining tax benefits and local community support is possible through being locating at an urban site.
Facility location highly affects points for Credit 1 (Site Selection), Credit 2 (Development Density & Community Connectivity), Credit 3 (Brownfield Development), and Credit 4.1 (Public Transportation). Further, low impact design is related to Credits 5.1 (Protect or Restore Habitat) and 5.2 (Maximize Open Space). With regards to Credit 4.2 (Alternate Transportation-Bicycle Storage and Changing Rooms), generally the number of people using the laboratory per unit area is lower than that of general offices, and it is possible that points can be attained here without difficulty because shower and clothes changing places must be included due to the nature of laboratory characteristics [28].
In addition to the abovementioned LEED credits, there are other lab-specific site design considerations: 1) use of computational fluid dynamics (CFD) analysis or wind tunnel testing to evaluate the potential impact of exhausts containing chemical, radioactive, and biological hazards, 2) utilities availability for energy intensive facilities, 3) manpower community human resources (researchers and students), 4) vehicle access and delivery routes, loading space, and location, and 5) security camera and lighting locations to reveal blind spots inside and outside the facility.
Table 2 presents the spread of Sustainable Sites points for the case studies, from 18 to 26 out of a maximum of 26 points. Overall, except for Case 2, the average achievement rate is above 80%. Five credits (SSc1, SSc2, SSc4.1, SSc5.2, and SSc7.2) were achieved by all of the cases; three credits (SSc4.2, SSc4.3, and SSc7.1) were achieved by most. On the contrary, credits SSc5.1, SSc6.1, and SSc6.2 were the least likely to be earned. SSc6.1 can be achieved by addressing roof run-off on the site. Cisterns, rills, and rain gardens are common solutions that bring immediate payback and savings. Case 2 could have earned five additional points by providing preferred parking for low-emitting fuel-efficient vehicles (SSc4.3) and by providing no new parking, or providing 5% of total parking spaces for carpools or vanpools (SSc4.4). Case 6 at UO, constructed above an existing green open area, performed innovative tree protection strategies during construction, including raised pathways to protect new and existing roots, to avoid losing credit for SSc5.1.
Table 2.
Comparison of Sustainable Sites credit points
Case 5 (Georgia Tech) managed to get all 26 points. The design team resolved the challenge of having an underground stream at the project site by giving the building a thinner footprint rather than taking up the entire site. Rather than redirecting the water flow to reach a municipal stormwater system, the team collected the water in a 37,854-liter clean-water cistern. Overflow from the cistern was conveyed to feed fountains and a runnel alongside the building. The project team found additional source of excess water from 1) air-conditioning condensate, 2) foundation dewatering, and 3) rainwater; these were captured to provide water for flush toilets, which contributed to getting the whole 10 points for Water Efficiency credits.
Water Efficiency
The Water Efficiency category concerns the reduction of potable water requirements through more efficient fixtures and appliances with smarter landscaping. Laboratory building water usage is significant due to the additional use of safety showers and eyewash, and vivarium facility requirements. In addition, more water is used in the ventilation cooling system controlling HVAC equipment. According to Watch [28], laboratories consume 5 to 10 times the water of most other building types, therefore it is encouraged that water conservation strategies are incorporated from the planning phase onward.
Table 3 presents the spread of Water Efficiency points for the case studies from 4 to 10 out of a maximum of 10 points. WEc1 was well achieved by all cases, even though there are various ways to gain this credit. In order to get the full four points, it is mandatory that no potable water use or irrigation is needed, and that potable water usage is reduced by 50%. Ways to achieve this credit can be enumerated as utilizing only the reclaimed water from captured rainwater, recycled wastewater, and recycled graywater for toilet flushes and landscape irrigation, or landscaping that does not require any permanent irrigation systems. In contrast, WEc2 (Innovative Wastewater Technologies) was the least likely to be earned. This credit requires the reduction of wastewater generation and potable water demand. It can be gained either by reducing potable water use for building sewage conveyance by 50% through the use of water conserving fixtures or non-potable water (e.g., captured rainwater, recycled graywater, on-site treated water); or by treating 50% of wastewater on-site to tertiary standards. In order to achieve this credit, civil and mechanical, electrical, and plumbing (MEP) engineers encourage that an early decision should be made to solve the barriers of municipal regulations and to manage complex systems in advance.
Table 3.
Comparison of Water Efficiency credit points
Cases 2, 5, and 7 achieved the full points for WEc2 by incorporating the following strategies. NAU SHB (Case 2) achieved all points in the Water Efficiency category, including exemplary performance in the Innovation and Regional Priority category credits, by reducing potable water usage by 78%, incorporating and using greywater for flush-fixture usage, and temporary irrigation of water-wise, native landscaping.
GT EBB (Case 5) met the requirements of Eco-Commons, the university’s own master plan, by a 50% reduction in stormwater runoff entering the Atlanta sewer system. The project team created a separate water capturing system through foundation dewatering, rainwater, and excess water in air-conditioning condensate. The collected water is used to flush toilets, which feed into a dirty-water cistern where it is filtered. That water, and any surplus, is then fed toward the larger of the two adjacent wetlands [29, 30].
CLC SEB (case 7) utilized a rainwater harvesting system to feed an 30,283-liter cistern located on the exterior of the building which provides flushing water for 12 toilets and urinals. A non-potable water system provides make-up water to mechanical systems such as heating, hot water, chilled water, and cooling towers. A reduced pressure backflow preventer protects the domestic water supply and is capable of meeting 100% of the design load.
Energy and Atmosphere
The Energy and Atmosphere category is the largest portion of the LEED rating system, with 35 out of 110 points (32%). It consists of six credits: Optimize Energy Performance (EAc1), On-site Renewable Energy (EAc2), Enhanced Commissioning (EAc3), Enhanced Refrigerant Management (EAc4), Measurement and Verification (EAc5), and Green Power (EAc6). EAc1 (Optimize Energy Performance) displayed the biggest deviations across the eight case studies, with scores ranging from 5 to 19. Although there is merely one level of difference between Gold and Platinum LEED certification, Table 4 presents the energy efficiency design and plan of a building can create a critical difference in terms of point acquisition. EAc2 (Renewable Energy) and EAc6 (Green Power) were the least likely credits to be earned, suggesting that additional financial investment and commitment to installation of renewable energy systems and energy contracts are necessary [23].
Table 4.
Comparison of Energy and Atmosphere credit points
Identified below are fundamental ways to reduce energy use in laboratory facilities, extracted from the literature review [28, 31, 32, 33]. The three strategies are summarized as 1) minimizing energy use demand related to ventilation by varying and reducing ACH, 2) utilizing energy conservation techniques to avoid waste, 3) verification of energy use via commissioning, measurement and verification (M&V), and energy modeling practice.
Strategy 1. Minimize ventilation power
Since labs require 100% outside air supply to prevent cross-contamination, ACH is higher than other building types and accounts for up to 44% of lab electricity use [28, 31]. The ACH level is typically set to ensure the health and safety of lab occupants by protecting them from exposure to chemical and biological agents ranging from 6 to 12 for common research labs, 10 to 20 for vivarium, and 5 to 600 for cleanrooms [33]. However, there are opportunities to increase energy efficiency by adopting the following practices. Sharp [7] suggested that Variable Air Volume (VAV) control systems should be used as the basic control systems to enable DBC, and air quality monitoring systems should be implemented to control and adjust ventilation rates accordingly. The air quality monitoring system enables continuous monitoring of air quality indicators such as carbon dioxide, temperature, humidity, small particles, total volatile organic compounds (TVOCs), carbon monoxide, and more, which in turn enables the DBC system.
Strategy 2. Energy conservation techniques
Heat recovery (HR) recovers heating and cooling energy by transferring sensible and latent loads between supply and exhaust air. Typical heat recovery devices such as enthalpy wheels, run-around loops, and heat pipes (with 75%, 55-65%, and 45-65% effectiveness, respectively) lead to ventilation pressure drops and reductions in fan power energy [28]. Another HR method, ceiling-mounted chilled beams, simultaneously a passive and active system, uses chilled water to cool spaces locally, significantly reducing the dependence on an all-air ventilation system. In addition to the energy use reduction from using fan power for ventilation, a saving in the construction cost of air handling units and ductwork can be expected, as well as lower maintenance costs.
Strategy 3. Energy use verification practices
Measures to verify the expected energy use during the design process and actual energy use after construction are necessary to create high performance buildings. Energy modeling plays a significant role in comparing design options at the schematic design phase, and developing design elements to reduce heating and cooling load. Whole building energy simulation is used to determine the energy performance level according to Appendix G of ANSI/ ASHRAE/IESNA Standard 90.1-2007, to determine LEED EAc1. EAc1 points range from 1 to 19, representing 12% to 48% energy efficiency compared with baseline building performance, increasing in 2% increments.
The M&V process provides continuing accountability for energy use and relates to EAc5. It requires the development and implementation of an M&V plan, as specified in the International Performance Measurement & Verification Protocol Volume III, which should be maintained for at least one year of post-construction occupancy. It is also highly recommended for laboratory buildings to have a higher level of building control and monitoring systems for fume controls, lighting sensors, humidity and temperature controls, and room air pressurization [28]. In a similar context, commissioning is also a fundamental process to verify that the project’s various equipment relating to energy systems are installed and performing according to the owner’s project requirements (OPR) and designer’s construction documents. Commissioning is a prerequisite in the LEED rating system and additional activities following system performance verification are required to gain the EAc3 (Enhanced Commissioning) credit.
Two platinum cases, Cases 6 and 7, scored full points for the EAc1 credit. This was attributed to the multiple energy efficient approaches that were integrated in their laboratory HVAC systems.
The project team for UO LISB (Case 6) established the catchphrase, “Let no BTU go unchallenged,” and created a collaborative partnership beyond business-as-usual approaches between the client, architects, and consulting engineers. This led to great energy savings attributed to the heat recovery system, which extracted waste heat from the university’s existing district steam tunnel running through the site. The project team took advantage of this system to control the temperature of the laboratory and office area. The project team also introduced program-specific approaches to reduce energy loads and evaluated different solutions with regard to both cost and energy. The result was a dedicated outdoor air system with passive chilled beams and operable windows, with a DBC ventilation system in the office area in order to tolerate greater temperature variance.
The project team for CLC SEB (Case 7) maximized energy savings by making use of the earth’s constant temperature to provide 90% of the building’s heating and cooling load from 47 geothermal wells extending 152.4 meters underground. According to the Basis of Design provided by Legat Architects, the AEI MEP engineering consultant specified a varied rather than constant ACH according to the space’s ventilation requirements. For example, in occupied and unoccupied states, chemistry and biology labs have 6 and 3 ACH respectively, whereas cadaver labs have 15 ACH both occupied and unoccupied. In addition, the 42 fume hoods installed in the facility operate according to a sensor which measures the openness of the sash windows and tells the unit how much air is needed. When hoods are closed, the fans slow to a minimum setting as opposed to the standard fume hood fan that never slows down. Lastly, the 187 photovoltaic panels on the rooftop contributed to reducing the building energy use by 66% compared to a standard science building of a similar size.
Materials and Resources
The Materials and Resources category involves the selection and installation of sustainably extracted, produced, and transported building products and materials. By incorporating a high percentage of reused, recycled, and local building materials, the use of new materials as well as the energy from extraction, process, and transportation can be minimized. This also promotes the reduction of construction waste by diverting construction and demolition debris from disposal in landfills to minimize the use of new materials and the project’s environmental impact. Therefore, this category requires the contractor’s active participation and knowledge to contribute to sustainable construction practice. Regarding laboratory-specific building materials, laboratory interiors require chemical resistivity where scientific experiments are performed such as benches, countertops, and work surfaces [31].
Table 5 presents the spread of points from 4 to 8 out of a maximum of 14. Overall the case studies’ credit achievement rate is relatively low compared with other categories, which is similar to the LEED score distribution patterns in previous studies [16, 18, 19]. MRc2 (Construction Waste Management) was achieved by all cases. The aim of this credit (minimizing construction waste to reduce environmental footprint) was already highly understood and accepted as standard practice by contractors, material suppliers, designers, and consultants. On the other hand, the aim of MRc6 (Rapidly Renewable Materials) was not well utilized in the case studies. To get these points, rapidly renewable materials must account for 2.5% of total construction costs. Even though a rapidly renewable material such as wheat board can be used as the casework core [28], it is not widely used for the final product or finishes, indicating that its use is not yet standard practice, and its material development and supply is not functioning effectively. Therefore, the development of products using renewable materials should be encouraged and promoted. That is one of the goals of the LEED: market transformation to achieve widespread use of green materials.
Table 5.
Comparison of Materials and Resources credit points
It is interesting to note that the renovation projects of Cases 4 and 8 obtained two points for MRc1 (Building Reuse - Maintain Existing Walls, Floors, and Roof), indicating that more than 75% of building reuse was achieved. However, the other projects could not get this credit, nor could they attain MRc1.2 (Building Reuse - Maintain Interior Nonstructural Elements), because the scope of these projects was heavy demolition work rather than maintaining the existing interior walls, doors, floor coverings and ceiling systems, and it was highly difficult to detach already furnished materials from existing building components. In addition, MRc3 (Materials Reuse) was hard to achieve. Its aim is to encourage the use of salvaged, refurbished, or reused building materials. It seems that it is difficult to meet MRc3’s requirements, namely that salvaged or reused materials account for 5% (1 point) or 10% (2 points) of total construction cost.
GT EBB (Case 5) minimized interior finish materials by exposing the structural members and by using polished concrete rather than typical flooring finishes. The contractor successfully diverted 99.7% of construction waste from landfill to earn an additional point in the Innovation in Design category. The project team also made use of fallen trees taken from the construction site, incorporating them into the newly fabricated staircase.
On the other hand, some cases made meaningful use of green materials but still could not get the LEED credits. The UO LISB (case 6) project team actively introduced bamboo, a rapidly renewable material, predominantly in the atrium interior finish; however, it was not enough to get the point at the MRc7 credit (Rapidly Renewable Materials). In a similar way, Case 8 (CIT) used bamboo and cork as the interior finish materials, but could not earn the related credits by meeting the required percentages.
Indoor Environmental Quality
The Indoor Environmental Quality (IEQ) category sets the goal of providing a high-quality indoor environment for the health and productivity of building occupants. Installing building materials with less harmful chemical compounds, providing daylight access and views, and allowing for control of lighting and thermal comfort, and their related verification practices, comprise the 8 IEQ credits with a maximum of 15 points. They are fundamental to providing the ideal indoor research environment to retain scientific faculty members and students.
Table 6 presents case studies’ spread of points, from 8 to 14. All projects achieved four credits for IEQc4 (Low-Emitting Materials) due to market transformations which have met the material recommendations of LEED, and improved attitudes of contractors toward green building products. IEQc1, which refers to permanent monitoring systems for ventilation, and IEQc3, which refers to indoor air management practices during and after construction, are well understood and implemented by project team stakeholders, especially contractors, by fulfilling the flush-out requirements and guidelines of the Sheet Metal and Air Conditioning Contractors’ National Association (SMACNA). On the other hand, IEQc2, (additional outdoor air ventilation to improve indoor air quality [IAQ]) and IEQc5 (minimizing exposure to hazardous particulates and chemical pollutants) were not widely accepted or executed successfully, indicating that additional commitment and understanding are required. IEQc6.1 (Controllability of Systems: Lighting) is easily applied, however, IEQc6.2 (Controllability of Systems: Thermal Comfort) was only minimally achieved due to the complexity of the system’s provisions. IEQc8 (Daylight and Views) is highly affected by the building’s corridor layout. For example, a single corridor in the center of the building is the ideal way to provide daylight and exterior views. On the other hand, double or triple corridor floor plans make it extremely difficult to obtain IEQc8. Even if the office area is located along the exterior walls, laboratory spaces are included as one of the regularly occupied spaces, and so are included in the calculations to meet the credit requirements (i.e., 75% of regularly occupied spaces have daylight, and 90% of all regularly used spaces have views).
Table 6.
Comparison of Indoor Environmental Quality credit points
The IEQc8 category is closely interrelated with energy use, because laboratory occupants must be protected from unwanted excessive heat and glare, which requires additional heating and cooling load. GT EBB (Case 5) introduced extensive use of external shading devices, perforated metal panels and light shelves, with full height glazing at the north, east, and west building facades. CLC SEB (Case 7) introduced extended horizontal mullions embedded within curtain wall systems to screen direct sunlight with a sloped ceiling profile to maximize the daylighting deep into the interior. UO LISB (Case 6) adopted exterior solar shading as well as interior light shelves, and a glass atrium to reduce the need for artificial lighting. On the other hand, NAU SHB (Case 2), with a single corridor layout, scored the lowest, the author hope to explore the reason in future work. Two extra points could have been earned for IEQc8.1 and IEQc8.2 credits for Daylight and Views. In addition, two extra points could have been earned for thermal comfort (IEQc7) by complying with ASHRAE-55 standard practice.
Discussion and Conclusions
All facilities commonly achieved 5 of the 14 credits in the Sustainable Sites category. These credits (Site Selection, Development Density and Community Connectivity, Alternative Transportation: Public Transportation Access, Site Development: Maximize Open Space, and Heat Island Effect: Roof) were commonly achieved because laboratory facilities in university institutions are easily accessible by utilizing existing campus infrastructure and do not greatly add construction costs in these areas. On the other hand, the credits for Brownfield Redevelopment, Site Development: Protect or Restore Habitat, and Stormwater Design are difficult to obtain due to the location and site-specific conditions of each campus.
Regarding Water Efficiency, LEED Gold-certified NAU SHB (Case 2) and LEED Platinum-certified GT EBB (Case 5) and CLC SEB (Case 7) achieved full credits. The other cases indicate that WEc2 (Innovative Wastewater Technologies) is challenging to achieve as it requires multidisciplinary collaboration and communication from the initial stages of a project.
The Energy and Atmosphere category comprises the biggest portion of the seven LEED categories. Two platinum cases, UO LISB (Case 6) and CLC SEB (Case 7), scored fully on EAc1. Another Platinum-certified project, CIT JL (Case 8) earned 18 points for EAc1, and obtained the highest EA credits overall due to the client’s commitment and additional financial investment in on-site renewable energy (EAc2). In particularly, EAc1 (Optimize Energy Performance) offers the potential to improve the overall LEED score by integrating both passive design strategies, such as building mass orientation and facade systems, along with energy-efficient mechanical and electrical equipment. All case studies earned credits for construction waste management and use of recycled-content materials. However, building and material reuse credits and rapidly renewable material credits were difficult to achieve for all case studies. Most case studies obtained the credits for outdoor air delivery monitoring, IAQ management during construction and before occupancy, low-emitting materials, lighting control systems, and thermal comfort design. The noteworthy point in the IEQ category is that UCB EBB (Case 3), CLC SEB (Case 7), and CIT JL (Case 8) achieved higher points compared to the rest by incorporating facade design to effectively introduce daylighting and views, which directly affected the energy demand for artificial lighting and cooling load.
This paper conducted a comparison study of eight LEED Gold and Platinum level laboratories using a case study method and extracted the following conclusions. First, the Optimize Energy Performance credit (Energy and Atmosphere category) played a critical role in getting higher ratings, requiring innovative architectural designs to maximize energy efficiency and the client’s commitment to and investment in renewable energy and green power. Second, laboratory facilities with higher levels were more actively engaged in achieving credits from stormwater design, innovative wastewater technologies, and daylight and views. Lastly, university-level commitment and master planning efforts are critical to introduce an integrated design approach from the early project stage. These findings will provide meaningful references and guidelines for university administrators, architects, engineering consultants, and related stakeholders to realize green laboratory facilities.
Limitations and future studies
Nevertheless, this study has the following two limitations due to the nature of the case study research method. First, this study is based on limited access to information. Therefore, more detailed information, such as exterior and interior shading device application methods and dimensions to control excessive glare and heat, and material selection processes and specifications, are necessary to better understand the projects. Second, information related to energy systems should be obtained to better understand the integrated design process and find the optimized design options; for example, the number of fume hoods and their specifications, specific ACH figures according to the room requirements, and the energy modeling simulation process.
Future studies must focus on the following points. First, in order to realize a high performing laboratory facility, in-depth analysis of the integrated design process should be considered. In this case, only a few case studies are needed, focusing on the story of the design and construction process and project stakeholder’s involvement. Second, analysis of LEED credit achievement patterns of LEED-certified laboratories and comparison with other LEED-certified building types would be meaningful to find customized design approaches specific to laboratories. Potential comparison groups are laboratory versus healthcare, and laboratory versus office building types. This way, design and construction for laboratory facilities can be energy efficient and cost effective, to create optimized design solutions.
