

Introduction
Methodology
Spatial measurements: Vernacular architecture of Lucknow
Vernacular Houses
Conventional Houses
Thermal measurement & thermal comfort survey
Thermal measurements
Air temperature
Relative Humidity
Comfort Votes
Neutral temperature
Adaptive comfort model
Result and Discussions
Study findings
Conclusions
Introduction
Vernacular architecture has evolved over hundreds of years of expertise by individuals who reside in various climatic situations around the world [1]. It includes designing and building approaches that use locally accessible resources which are related to people’s environmental, historical and cultural backgrounds [2]. The built environment's architecture has the capacity to redefine the climate on multiple stages, particularly the microclimate scale. Climatic variations are observed from area to area [3]. It ranges from a distance of few meters to a few kilometres’ radius within a certain region, generating a small-scale pattern of climate known as the microclimate [4]. The topography, distribution of air temperature, relative humidity, sun radiation, and wind characteristics in the microclimate are the key factors determining the physical character of the microclimate [5]. A bioclimatic design approach is one that is based on the local climate. Bio-climatism is the combination of microclimate and architecture to evolve design and planning of habitat which aptly suits to the occupant’s thermal comfort conditions [6, 7].
The concept of climate-oriented architecture is not new and is also shown by the vernacular dwellings spread across the country and even worldwide [8]. Vernacular architecture for each topographic and geographic region is different from the other geographic region [8]. Given the factors of microclimate and topography which are different for different geographical regions; context specific environmental variables are important to be studied along with study of equally important physiological parameters [6, 9]. Here it is important to mention that environmental variables are outdoor air temperatures, indoor air temperatures, wind speed, humidity levels. Behavioural adaptations and cultural, socio-economic adaptations are termed as physiological variables. These were further gauged and presented in terms of thermal sensation, thermal perception, clothing level and metabolic rate [10, 11, 12, 13].
According to recent research, the results of field studies based on surveys and thermal measurements are widely counted on for projecting the thermal comfort conditions for indoor environment of naturally ventilated buildings [14, 15, 16].
In recent years, research in the field of thermal comfort performance of vernacular materials and architecture practices has increased manifold owing to sustainability concerns and better performance of these indigenous materials.
One similar research related to evaluation of insulation material on existing residential buildings in subtropical climatic zone in India compared the case of two different buildings [17]. The study analysed the thermal performance of the buildings in terms of indoor and outdoor temperatures before and after the application of passive design strategies with inclusion of insulation material. The findings showed considerable reduction in indoor temperature in extreme summers in the building by use of passive cooling strategy and inclusion of solar reflective insulation. Yet another research studied thermal performance as a parameter for choosing sustainable and thereby efficient material in context to specific environmental conditions for case of Brazilian Antarctic station [18]. The study considered climatic factors of moisture content, temperatures, wind speed and climatic changes. Research checked thermal performance of the building and its energy efficiency by including the use of software design builder for preparation of model and use of material properties. Carried out in two stages, the research with the help of simulation, evaluated the performance of building envelope and suggested changes in material usage for better thermal performance and energy efficiency. The study, therefore, showed scientifically that material usage and envelope design considered as one of the design-planning strategies greatly affect the overall thermal performance of the building.
Another research work related to thermal comfort monitoring for naturally ventilated educational buildings located in hot and dry climate of Gujarat, India gauged the effect of environmental/climatic factors and adaptive methods on the thermal comfort behaviour of occupants [16]. The study involved the use of questionnaire-based survey for the comparative analysis of two buildings. The research involved monitoring of parameters of air- temperature, relative humidity, air speed, level of clothing respectively for different seasons. The study calculated the thermal comfort ranges for different seasons for the occupants and showed that solar passive techniques like natural ventilation and provision of sunlight greatly affect the indoor thermal comfort for the inhabitants. In context of these different research, vernacular architecture is found to be very effective. Same research work posits that vernacular houses thrive on climate adaptive design, strategies for natural ventilation and light and are economical as well. However, due to lack of research in context to energy and environment behaviour of vernacular houses, this indigenous technology, which is sustainable energy efficient, and cost-effective is not well accepted by people. The study further explored the ways of improving thermal comfort conditions in modern conventional houses using passive technology. The study further, provides guidelines for present research work whereby similar abandonment of vernacular architecture is seen in the study area of Lucknow for conventional modern architecture.
Similar research regarding strategies for reduction of thermal discomfort during heating season in Algerian residential dwellings assessed the effect of changes in building envelope on thermal comfort and energy requirements of the inhabitants [19]. The research investigated the difference in thermal performance in context to variations in location, thickness of thermal insulation, location of windows and heating systems in building. The study propagated that number of discomfort hours can be reduced significantly by changing the thermal envelope of the buildings. This shows the effectiveness of design planning strategies towards indoor thermal comfort of the buildings. On more research in this field related to comparative analysis of subjective and objective thermal comfort of the residents showed that temperatures and humidity level of each occupant is different from indoor temperature and humidity levels of the indoor spaces. Therefore, the measurement and inclusion of theses parameters specifically with reference to occupants is very essential as it leads to deviation in results of thermal comfort measurements [20]. One more research related to evaluation of indoor environmental quality of kindergartens and nurseries in central Portugal gauged the parameters of relative humidity, air change rates and levels of indoor pollutants [21]. The study found a strong corelation of these factors with the indoor environmental quality for the specific demographic profile. The study suggested remedial solutions for controlling high relative humidity levels, low air change rates and high concentration of indoor pollutants. The study suggested that provision of natural ventilation in the form of increased number of windows/openings and other similar provisions can enhance the indoor environmental quality of the places. One research studied energy saving potential in buildings using smart building materials and better design planning strategies for Egypt [22] The research affirmed the role of smart envelope techniques like provision of daylighting, box windows, corridors, natural ventilation, shaft box facades, in addition to amalgamation of passive solar systems in building envelope along with the use of sustainable materials either recycled or reused material towards overall energy savings of the building while maintaining better indoor thermal environment.
Other related research works show that by reducing carbon emissions in buildings, the buildings respond to climate in a better responsible and effective manner and tend to behave as sustainable green buildings [23, 24, 25]. One research related to investigation into visual comfort related with daylighting levels reveals the importance of proper orientation of envelope elements like windows, transparency of canopy etc. [26]. The study explored the role of daylighting evaluation while design-planning for buildings. By the use of simulation and Daysim software, the study affirmed that for maintaining optimum daylighting levels specifically for students in classroom; it is essential for due consideration of orientation and planning of windows, canopies etc. Yet another study on the role of sustainable strategies and indoor thermal comfort of buildings specifically for school buildings propagated energy saving technologies which can advantageously enhance the sustainability of school buildings [27]. The research discussed that advocation of sustainable techniques for construction purposes like adoption of passive energy saving technologies of heat preservation, including building envelope system, energy saving windows, efficient fresh ventilation system, sunshades, use of recycled materials, local products, efficient waste management etc. can significantly lead to energy saving in school buildings. This can also simultaneously address the negative impacts on health of the students and enhance better indoor environment. The school under study achieved water efficiency through rainwater harvesting system, energy efficiency through innovative daylighting- and light system, use of solar PV, adopted passive and active energy efficient systems, sustainable materials, strategies for improvement in indoor air quality and modification of design-planning features of school. The study showed that by proper amalgamation of design strategies, efficient management and use of sustainable materials; considerable energy saving can be achieved in buildings along with maintenance of healthy indoor environment and thermal comfort. One more similar research in the context of impact of design of naturally ventilated houses on thermal comfort and lifecycle energy and lifecycle cost showed effectiveness and importance of design parameters like room sizes, exposed surface area, volume, exposed walls, window area, number of openings etc. in maintaining of indoor thermal comfort in buildings and reduction of operational energy, life cycle energy and life cycle costs involved in different phases including construction, operation and maintenance of buildings [28].
One more research related to in-depth study of passive design features of vernacular architecture for North Indian region which contribute towards indoor thermal comfort and better energy efficiency in houses showed better performance of vernacular architecture over ages specifically in terms of sustainability [29]. However, this architectural style is on the verge of decline owing to deficiency of its adaptation to changing lifestyle requirements of modern age. In context of this, the research suggested for improvements in traditional vernacular architecture for its advantageous incorporation in modern construction practices. In another study, the energy performance comparison of a vernacular house and a modern house has been done. The study found that vernacular house is more efficient in terms of embodied energy and operational energy use [30].
Based on the above literature outcome, present work addresses the research question of exploring the effect of environmental variables on thermal comfort of people and respective behavioural adaptation by the occupants as a response to these climatic variations for two different typologies of houses. For this purpose, the research involved field studies (survey and measurements) of traditional vernacular and conventional modern houses in Lucknow in relation to physical environmental variables and physiological variables as case study. At present no similar study has been conducted in the study area providing comprehensive view of thermal performance of different types of houses. The study included a subjective thermal survey based on questionnaire to understand different thermal sensations and perceptions of the occupants using ASHRAE seven-point scale and Nicole five-point scale (for thermal sensation and thermal perception respectively) [31, 32, 33]. These studies showed better performance of vernacular houses in maintenance of conducive indoor environment as compared to modern houses. In the same context, Singh et al. states that thermal comfort is a matrix of four things: the indoor temperature, the outdoor temperature, relative humidity and clothing insulation levels [6, 8, 31]. The study involved evaluation of the indoor and outdoor temperatures of specific houses and a survey based on an ASHRAE-55–2004 questionnaire for insights into environmental and personal factors [6, 8, 31] along with new standard, ANSI/ASHRAE Standard 55–2010, for adaptation aspects. The study showed the link and correlation between adaptation and comfort temperatures when the Humphreys and Auliciems adaptive comfort models are used [33, 34]. The idea of adaptation says that when people feel uncomfortable because of a change, they adopt those measures that improves their comfort level. This gives an idea about the changes that people often make made in the built masses to achieve maximum comfort conditions [35].
Indraganti et al. [36] and Yao et al. [37] showed that possibility to make a general thermal comfort model that works for all climates is not practically feasible. These comfort models should be made while considering clothing of the local population, and the outdoor temperature of the area [36, 37]. Yao et al. further examined the link between a PMV and PMV in naturally ventilated buildings using an adaptive predicted mean vote (a PMV) model. Algifri et al. [38] evaluated the thermal performance of vernacular styled houses with conventional architecture styled houses in terms of materials and methods for Yemen. Vernacular architecture is important in advocating the use of bioclimatic design in modern buildings [39]. Bioclimatic guidelines form an inherent part of many traditional buildings which help to maintain a conducive building microclimate for achieving better indoor thermal environment for comfort [40].
Methodology
This study is focussed on evaluation of the thermal behaviour of Lucknow’s vernacular houses for developing sustainable guidelines for comfortable indoors thereby improving energy efficiency of buildings. Lucknow is located in the Gangetic plains and lies in North Indian state of Uttar Pradesh, has composite climate [14]. Adaptive approach was used in the research to study the thermal behaviour of traditional structures as compared with the modern conventional houses. The thermal performance study was conducted throughout the year, ranging from March to May for summer seasons, from June to September for monsoon season and from December to February for winter season. Present study incudes the analysis of data pertaining to the above winter season. Environmental variables like air temperature and relative humidity, wind velocity were recorded in the living areas of vernacular dwellings in the Narhi area near Hazratganj and conventional houses in Gomti Nagar of Lucknow in composite climate area. In total 90 houses were covered under the study with 30 vernacular and 30 conventional houses represented by VH and CH category respectively involving120 respondents in total. The study included covering of physical environmental variables and personal variables. The thermal performance of both category houses was examined with the help of thermal comfort predictive equations based on outdoor and indoor climatic data. The research included a thermal survey based on questionnaires. The questionnaire inquired and explored about residents’ comfort and discomfort, such as thermal sensation on ASHRAE’s 7-point scale as shown in Table 1. Participants were asked for their preference of warmer or cooler temperatures. Finally, the research output was used to determine the housing type that gives best results in thermal performance during the winter season. Based upon these results, strategies were proposed for achieving energy efficiency based on sustainable design- planning guidelines.
Spatial measurements: Vernacular architecture of Lucknow
Vernacular Houses
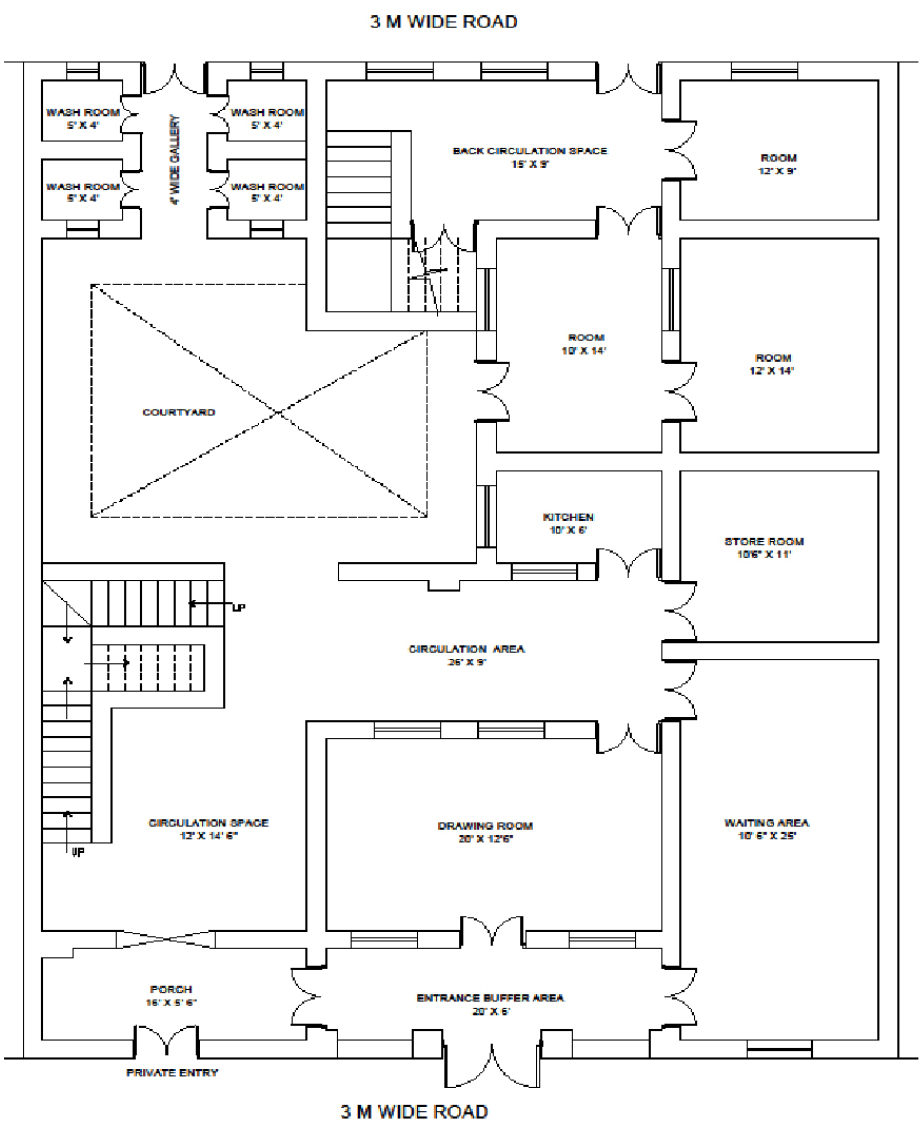
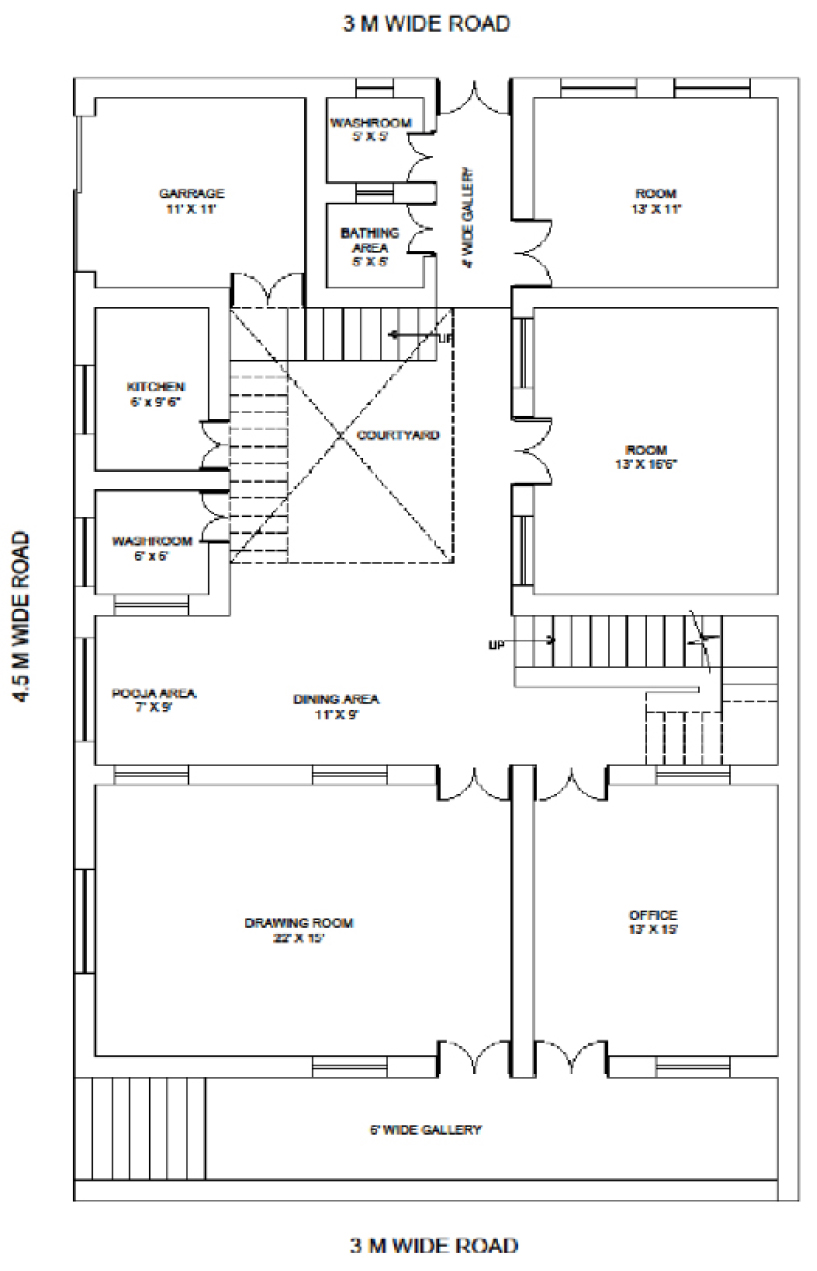
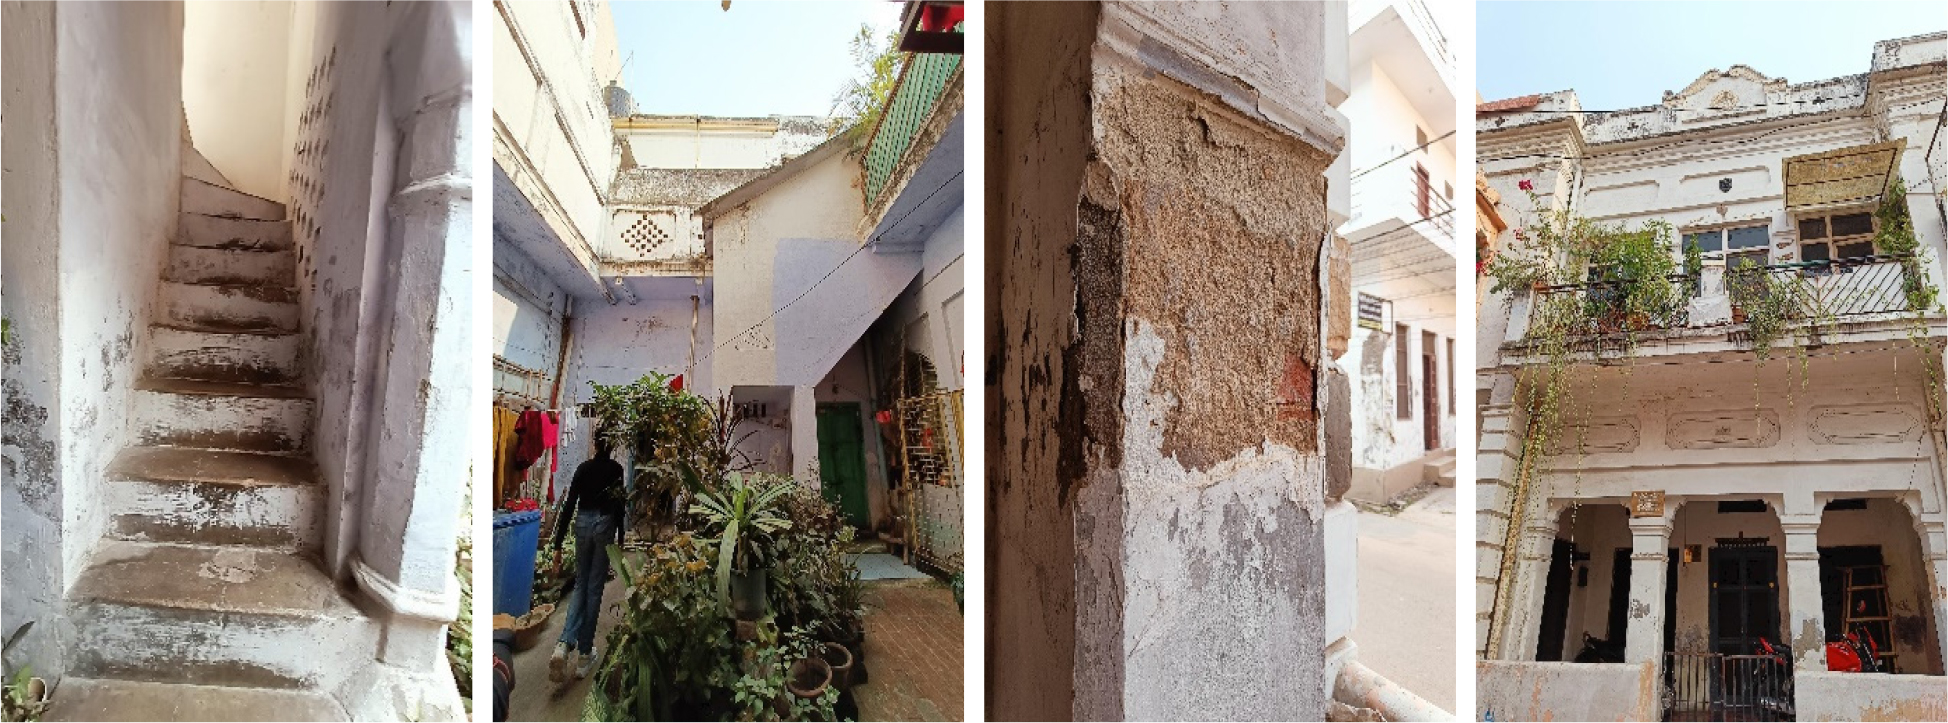
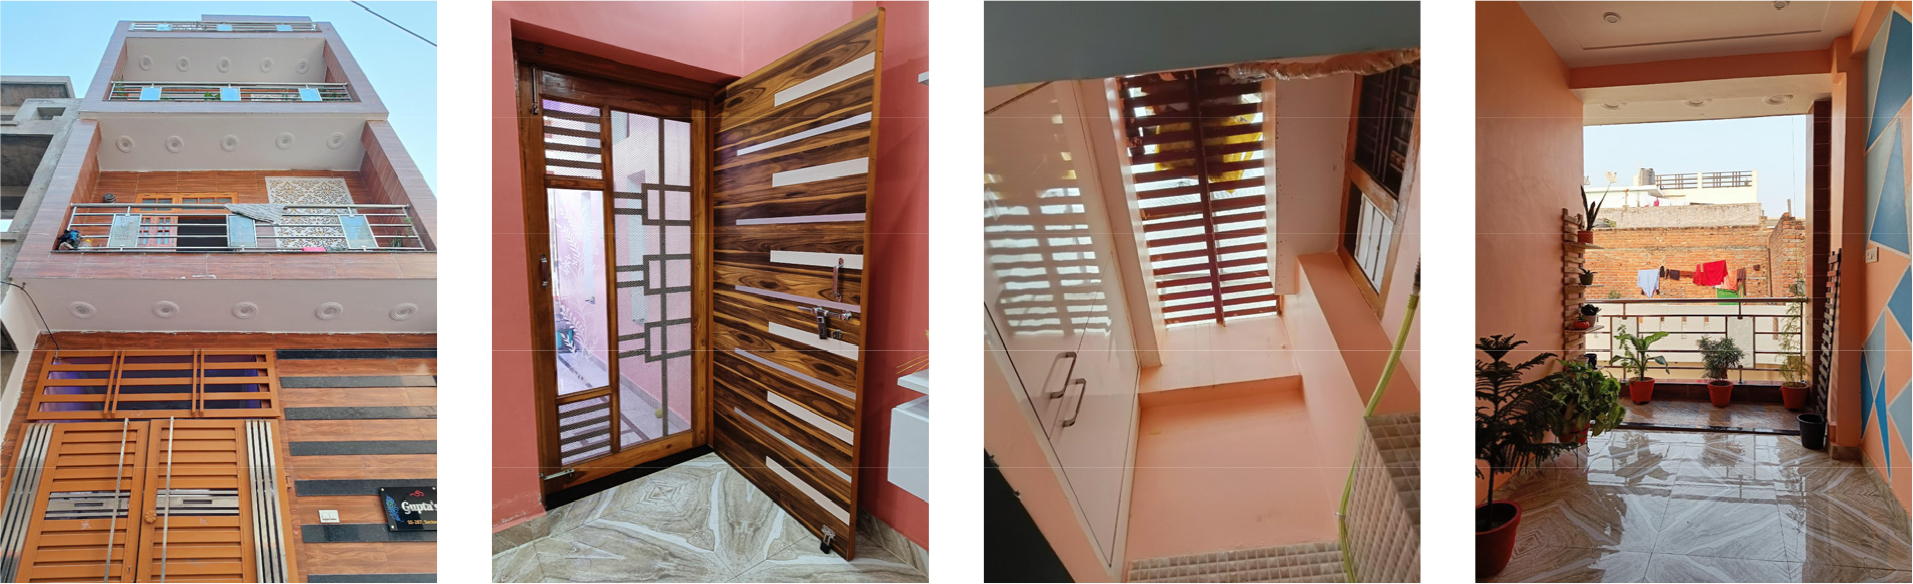
In total 35 vernacular houses were studied for thermal performance aspects and three cases representative of vernacular style have been discussed in present study. These houses are more than 90 years old. Figures 1, 2, 3 show vernacular houses. In the composite climate of Lucknow, the houses have courtyard and veranda planning which meet socio-cultural demands and supports the occupants’ day-to-day activities. It helps in gathering of warm air in day time and a storehouse of sunlight during the winter. These vernacular houses were made up of Lahori bricks and lime mortar with wooden spars. The roof was made up of timber joists which rests on timber beams which are further supported by walls and columns. The spaces and rooms had 36-inch-wide doors and 48 inch wide windows.
Conventional Houses
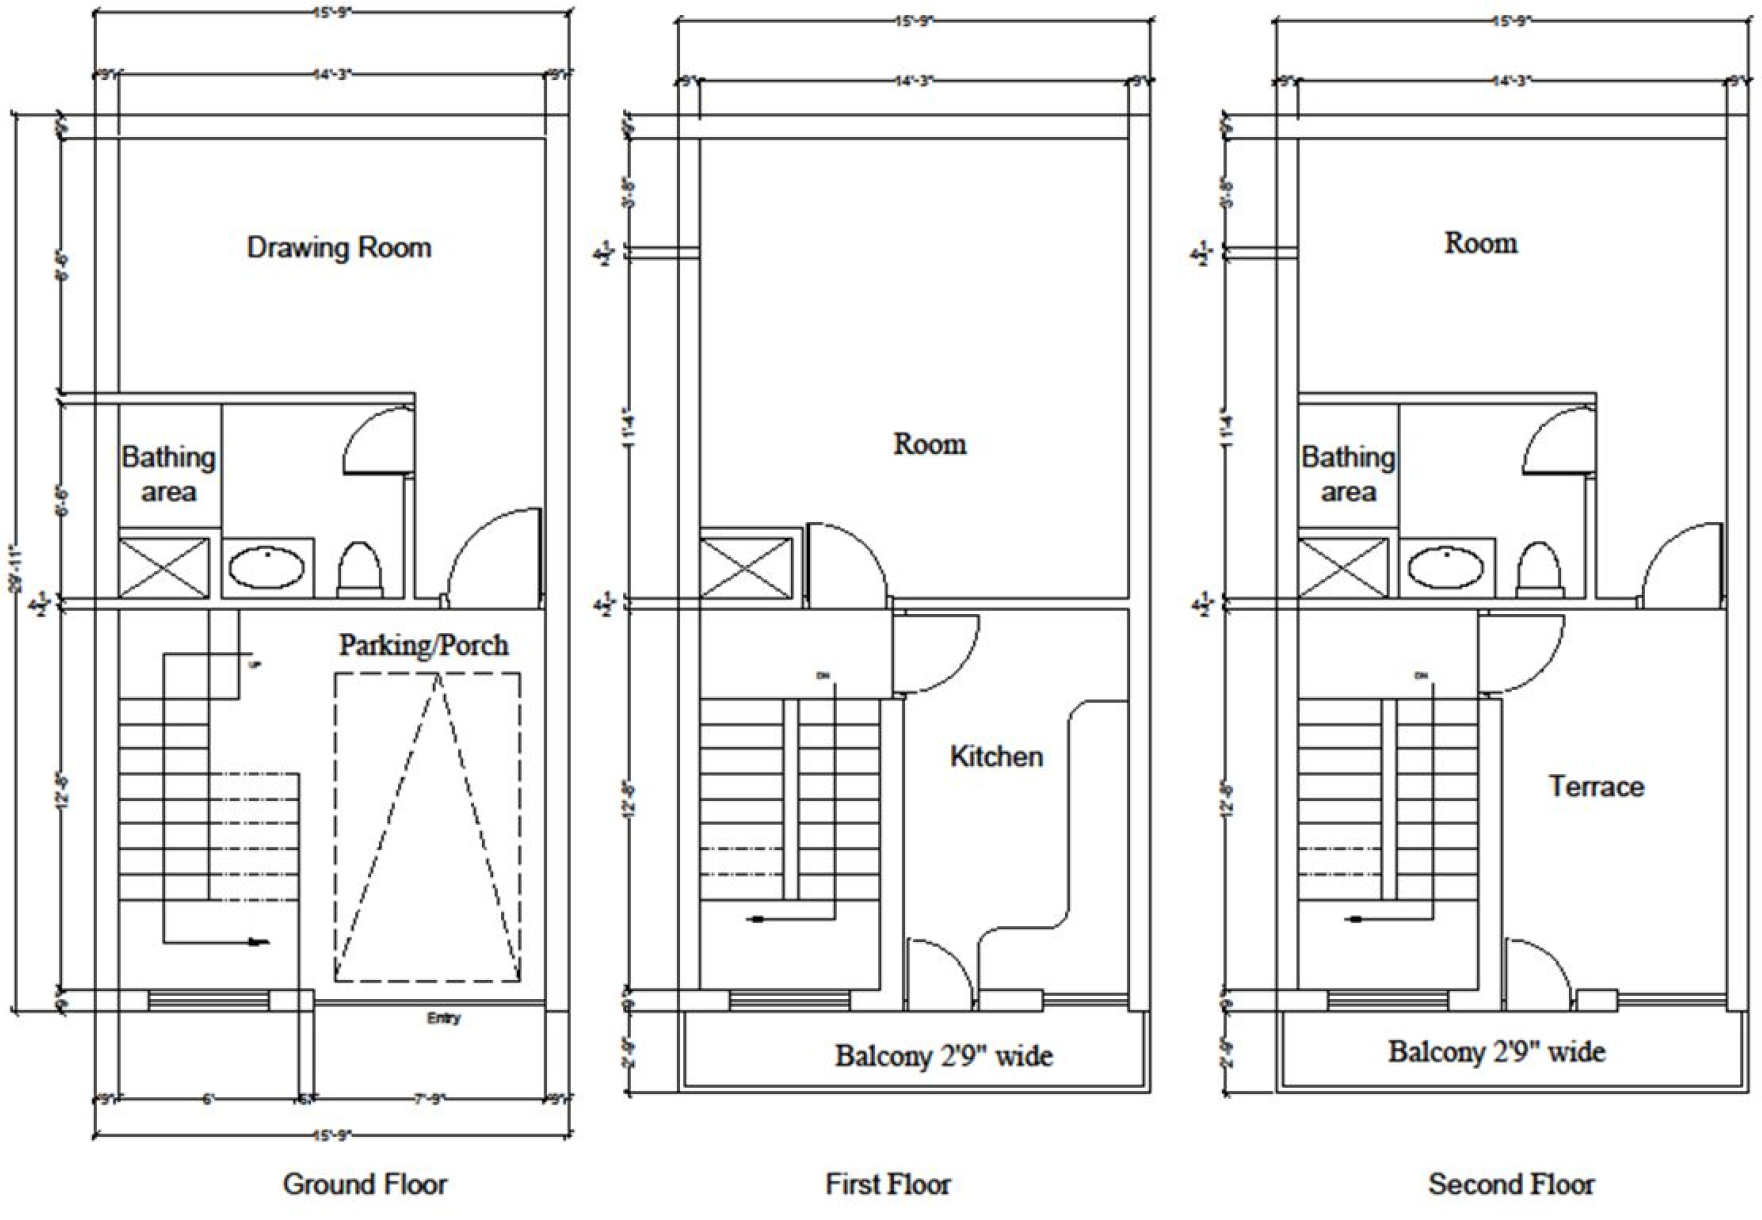
Conventional houses selected for the study were recently constructed houses. Figure 4, 5 show plans and views of conventional houses. The houses had typical rectangular shape with two storeys in general and were open from only one side. The materials used in construction of walls, columns, roofing and flooring were cement, concrete and brick.
Thermal measurement thermal comfort survey
In this study, the measurement of physical environmental parameters like outdoor and indoor air temperatures, relative humidity, air velocity were recorded and personal parameters like metabolic activity and clothing limitation were analysed through questionnaire survey. In the survey, the equipment was set up both outside and inside. Measurements were recorded daily for a period of six days for each month of winter. The measurement data was recorded after 15–20 minutes of the instrument’s stabilization. The sensors were located at a distance of 1.1 m above the ground and 1.0 m away from the people being observed. Outdoor sensors were installed at 1.5m above the ground and protected from direct sunshine. Measurements were taken between 7:00 and 18:00 hrs. preferably in living rooms. The lack of conventional garment insulation values in the ASHRAE 55 and ISO 7730 clothing insulation databases hinders thermal comfort studies in South Asian nations, notably India [34, 35]. This study used the closest ASHRAE 55 and ISO 7730 clothing insulation values to match the practical garment design. The outdoor and indoor air temperature, relative humidity, and air velocity were measured at each dwelling using digital thermal instruments like anemometer, thermo-hygrometer with specifications as given in Table 1. Thermal comfort investigation included 135 respondents comprising of 60 men and 75 women in the age group of 15 to 84 as shown in Table 2.
Table 1.
Instruments used for thermal measurement
Table 2.
Frequency and distribution of respondents
The study included use of adaptive models of Humphreys and Auliciems to estimate the comfort temperature, as well as the proportion of thermally comfortable time in studied houses.
Thermal measurements
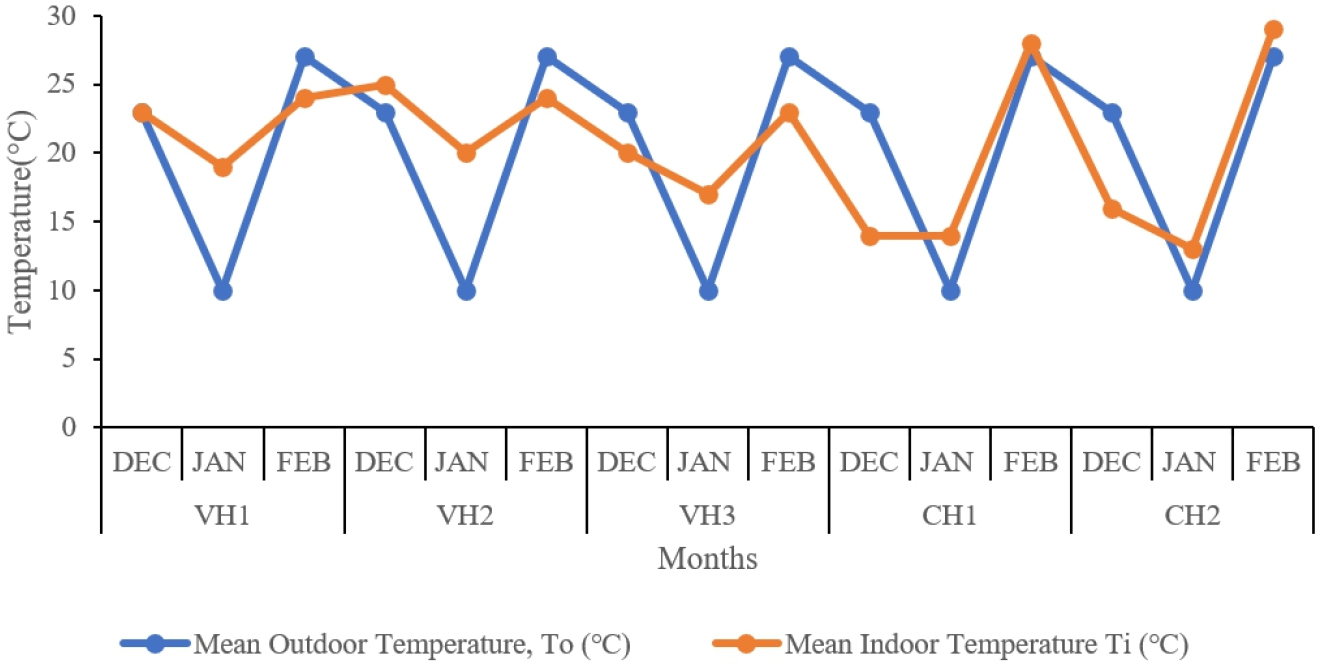
Air temperature and relative humidity were recorded which gave the idea of thermal conditions within the houses. The anemometer recorded data was used for calculation of mean value of environmental elements. Temperatures were monitored for the months of December, January, and February for the year 2021-22. In December, the outdoor temperature ranges from 9°C to 22°C, in January from 8°C to 14°C, and in February from 16°C to 26°C, reflecting a 13°C, 6°C, and 10°C temperature variation, respectively. Similarly, the indoor temperature ranged from 10°C to 23°C in December, 12°C to 28°C in January, and 16°C to 29°C in February, indicating temperature variations of 13°C, 16°C, and 13°C, respectively. As is also evident from Figure 6 regarding the temperature description that the indoor temperature is consistently less than the outdoor temperature. The maximum temperature variation within the house is 16°C, which is suitable for naturally ventilated traditional homes. The temperature profile also reveals a huge difference in maximum outdoor temperature and the maximum indoor temperature. This is due to time lag in context of different materials used in both the houses (use of adobe and mud in vernacular houses and bricks with reinforced cement concrete in modern houses). This gives indicative information about the condition and requirement of housing insulation. This residence has a window to wall ratio of 0.216. Natural ventilation was accomplished by installing around 50 percent of the floor area in doors, windows, and ventilators.
Air temperature
For all time durations under consideration in field study, the indoor air temperature of the living room and the outdoor temperature of the monitored houses were measured, and curves were drawn as shown in Figure 6. The outdoor temperature values lie between 9°C to 25°C for the month of December, 8°C to 22°C for the month of January and 11°C to 27°C for the month of February.
Here VH1 represents category of Vernacular House 1, VH2 represents category of Vernacular House 2, VH3 represents category of Vernacular House 3, CH1 represents category of Conventional House 1 and CH2 represents category of Conventional House 2. It can be interpreted from the curves that in the Vernacular houses; the mean indoor temperature in winter was more than the mean outdoor temperature. This variation in temperature made the indoors warmer than outdoors thereby increasing the optimum thermal comfort. Conducive indoor temperature further was enhanced by adoption of woollen clothes by the occupants during the months of December and January.
In Conventional houses in the month of December and January, the indoor temperature was very less as compared to the outdoor temperature, making the indoor spaces cooler in winters. Therefore, to achieve optimum comfort, external energy equipment like heaters, and blowers were commonly employed. Further, in month of February towards the end, the indoor temperature was very high as compared to the outdoor temperature. This made the indoors much hotter than outdoors and occupants used fans and air- conditioners for achieving optimum thermal comfort.
Relative Humidity
The indoor and outdoor relative humidity for every survey time during field study for both types of houses (vernacular and conventional house types) was recorded and has been shown in Figure 7. It shows that for vernacular houses; humidity levels both at outdoor and indoor temperatures was almost same. However, for modern conventional houses, the level of indoor relative humidity at given outdoor and indoor temperatures was less as compared to relative humidity outside the house for months of December and January. For these houses (modern conventional houses), the relative humidity of internal spaces lowered down to 10% making them much cooler than required.
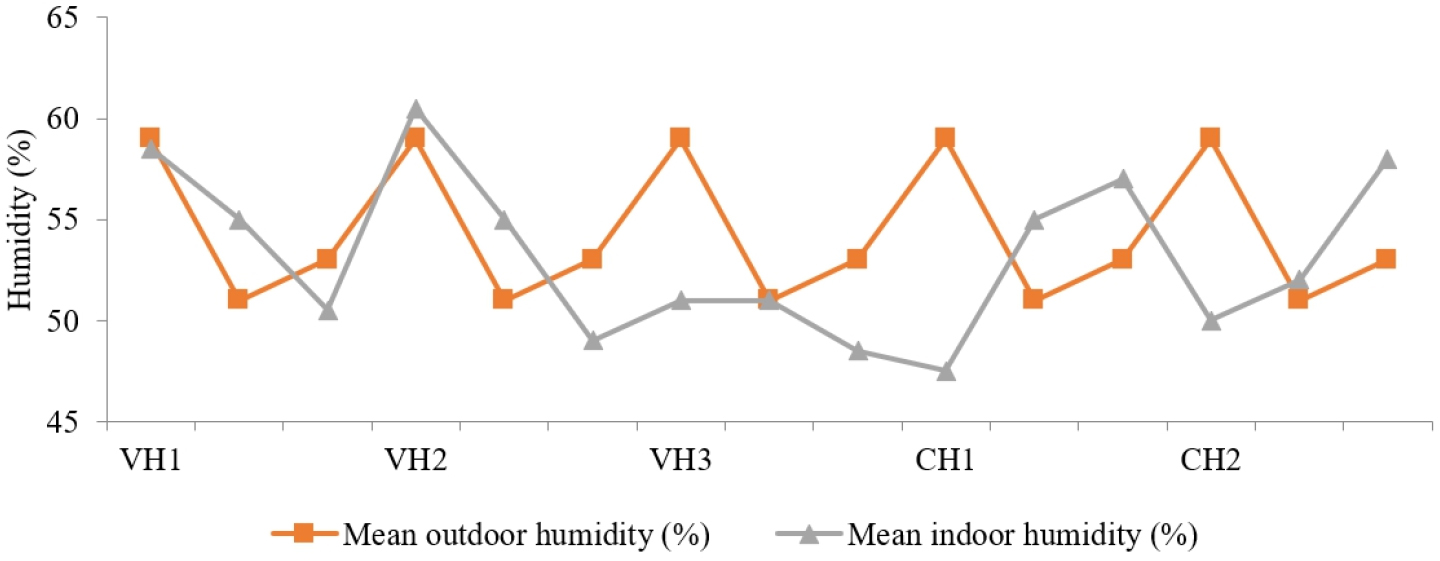
This contributed to lowered indoor temperatures in peak winter months of December and January. Similarly, the level of indoor relative humidity at given outdoor and indoor temperatures was more as compared to relative humidity outside the house for month of February. The relative humidity of internal spaces increased to 7% making them much hotter than required. This contributed to higher indoor temperatures in peak month of February. This clearly shows that in case of vernacular houses, the indoor built environment is at quite comfortable level irrespective of fluctuations in outdoor temperatures. Whereas modern houses, are subjected to extreme fluctuations in indoor temperatures and humidity levels. Therefore, modern conventional houses are unable to maintain conducive indoor built environment.
Comfort Votes
Seven-point thermal sensation scale which evaluates level of comfort of thermal environment for the inhabitants, was used for analysis of thermal sensation of the occupants. Here, in the study; value 0 shows that the respondent’s highest degree of contentment with the thermal environment. Value of +1 and -1 show that the indoor thermal environment is marginally unpleasant, but the required thermal comfort can be arrived at by adaptive strategies like wearing of appropriate clothes, opening and closing of windows and by use of fans. Similarly, +2 and -2 values show that the indoor thermal environment for the occupants is warm and for the occupant’s thermal comfort, there is need of external energy equipment like heaters or coolers. Here, +3 and -3 values show that the indoor thermal environment is intolerably hot, and the energy consumption is the highest in order to arrive at thermal comfort (conducive indoor environment). Figure 8 shows thermal sensation votes of the occupants in vernacular and conventional residences for winter months of December, January, and February.
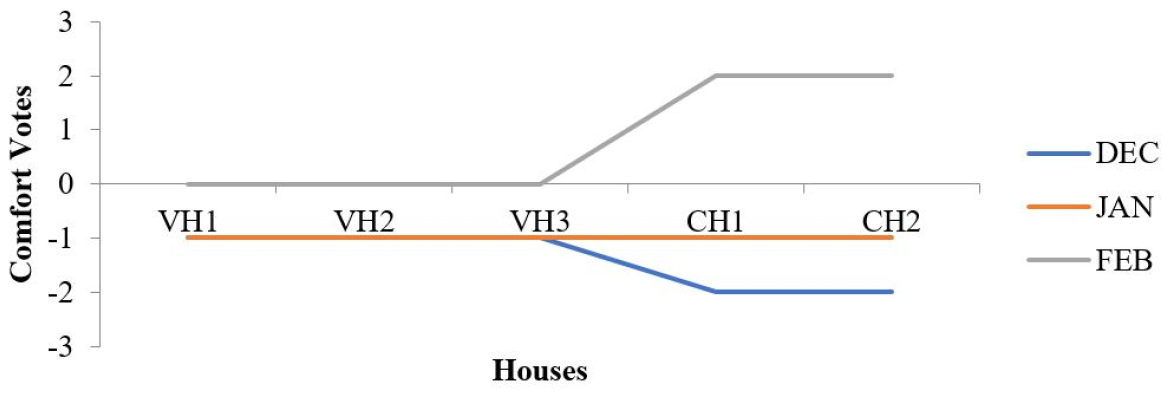
It can be interpreted from the curves that for vernacular house, occupants feel comfortable for all the three winter months and do not require much of the external heating or cooling equipment for maintaining thermal comfort. However, in case of conventional houses, the occupants feel much colder in months of December, comfortable in month of January and much hotter in month of February.
Due to these combined reasons, in Vernacular residences, the mean indoor temperature range which is 15°C to 23°C against the mean outdoor range of 10°C to 28°C for the months of December, January and February is quite acceptable to the occupants. This is very much clear from the thermal sensation votes which have a value of -1 both for the months of December and January against the respective outdoor temperature range of 10°C to 22°C and 15°C to 21°C. Similarly, thermal sensation votes have a value of +1 in the month of February for respective outdoor temperature range of 17°C to 28°C. Therefore, based on interpretation from Figure 6, Figure 7, and Figure 8; it can be interpreted that most of the occupants found the indoor environment congenial and does not require external energy or heating equipment for maintenance of conducive indoor environment. Hence vernacular architecture style was found to be in sync with bio-climatic principles of Lucknow.
In Conventional residence, the mean indoor temperature range which is 13°C to 30°C against the mean outdoor temperature range of 10°C to 28°C for months of December, January and February is not acceptable to the occupants. This is very much clear from the thermal sensation votes which have a value of -2 for the month of December as the respective outdoor temperature values lie between 10°C to 22°C. Thermal sensation votes value has been recorded as-1 for the month of January as the respective outdoor temperature values lie between 15°C to 21°C. Similarly, thermal sensation votes value was recorded as +2 for the month of February as the respective outdoor temperature values lie between 17°C to 28°C. Most of the occupants favoured the indoor thermal environment as marginally warm in the month of December January, and marginally cool in the month of February.
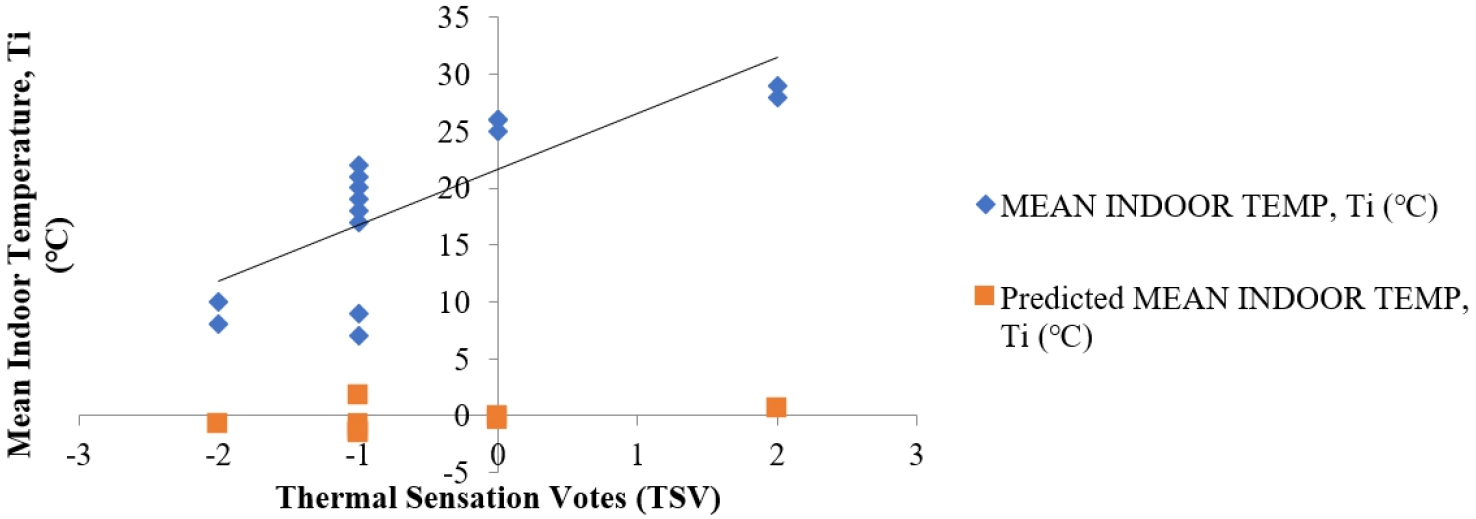
This also gave the idea about the relationship amongst mean indoor temperature and thermal sensations of the inhabitants as shown in Figure 9. From the figure, it can be predicated that conducive zone for inhabitants falls in range of 15°C to 25°C, corresponding to the value of thermal sensation votes of -1 to +1 which also lies in similar range. Similarly, temperature below 15°C is unacceptability cool and temperature above 25°C is unacceptability hot for inhabitants for comfortable living.
Neutral temperature
Regression Analysis technique was utilized which helped to evaluate neutral temperature for both types of houses (vernacular and conventional modern houses) under study. Neutral temperature was calculated with the help of independent variable “indoor temperature” and dependent variable “thermal sensation vote.” The calculation showed correlation between thermal sensation votes and indoor air temperature as shown in Table 3. The table shows neutral temperatures for both the vernacular and conventional houses for the winter season.
Table 3.
Correlation between thermal sensation vote and indoor air temperature
| Housing type | Neutral temperature | Coefficient | R2 |
| Vernacular house | 26.45°C | 0.1292 | 0.835 |
| Conventional house | 16.2°C | 0.1618 | 0.947 |
| ASHRAE 55 | 24.6°C | 0.27 | 0.46 |
It can be interpreted from the table that the neutral temperature calculated from present study has an increase in temperature by 3°C for both vernacular and modern conventional houses as compared with neutral temperature given by ASHRAE standard 55 [9, 22].
Adaptive comfort model
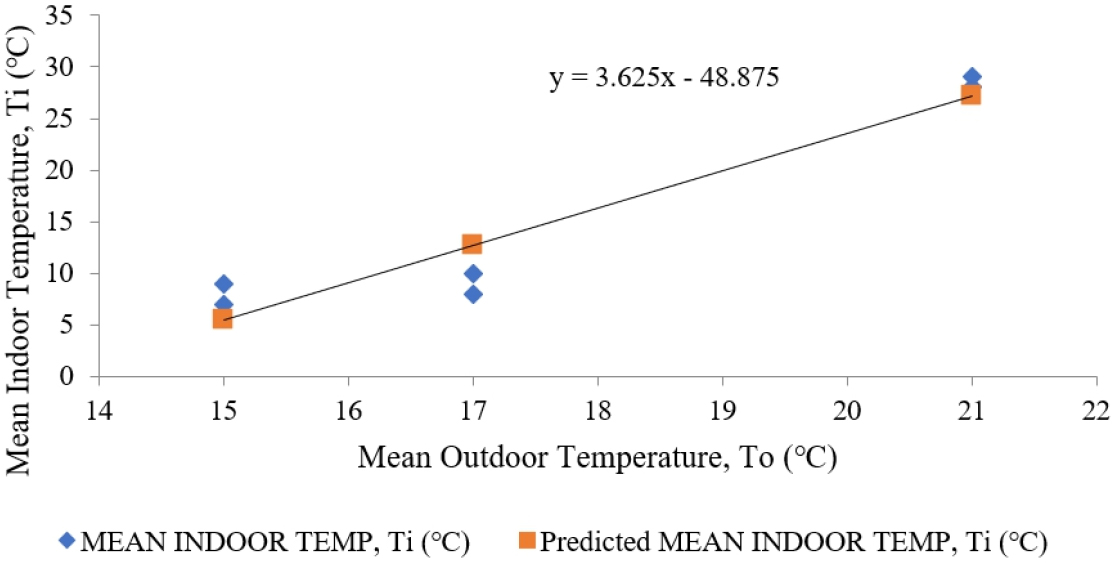
Regression analysis involving ‘indoor air temperature’ (dependent variable) and ‘outdoor air temperature’ (independent variable) for vernacular and conventional houses for estimation of neutral thermal sensation votes showed state of thermal neutrality for vernacular houses and conventional houses. Figures 10 represent the regression analysis involving indoor air temperature and mean outdoor air temperature to evaluate “neutral” votes for vernacular houses and Figure 11 exhibit the regression analysis involving indoor air temperature and mean outdoor air temperature to gauge “neutral” votes for conventional houses respectively. The figures clearly show that indoor temperature of vernacular houses was in the range of 16°C to 23°C against the outdoor temperature range of 15°C to 22.5°C. This is in sync with thermal sensation votes by occupants showing that occupants feel most comfortable in the given range of indoor temperature against the extreme outdoor temperatures. However, in case of conventional modern houses, indoor temperature were in the range of 9°C to 30°C against the outdoor temperature range of 15°C to 22.5°C. This is in sync with thermal sensation votes by occupants showing that occupants feel most uncomfortable since the indoor temperature are lower even than the outdoor temperatures making indoor even more cold in winter season.
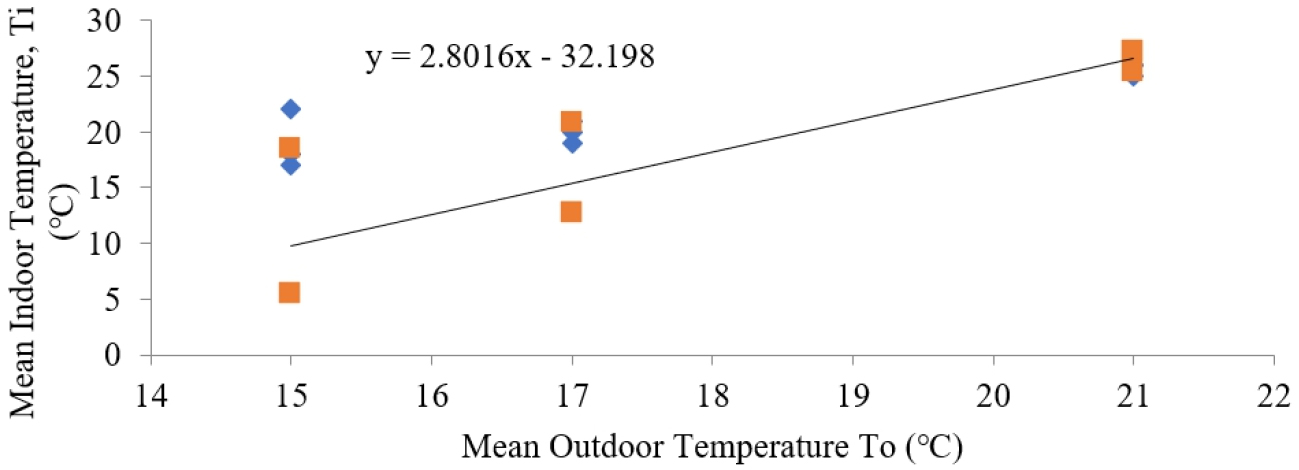
Relationship of indoor and outdoor temperature for thermal comfort (thermal neutrality) in vernacular houses is given by Equation 1, as also shown in Figure 10.
Relationship of indoor and outdoor temperature for thermal comfort (thermal neutrality) in conventional houses is given by Equation 2, as also shown in Figure 11.
Relationship of indoor and outdoor temperature for thermal comfort (thermal neutrality) as given in ASHRAE 55 (2010) [9, 22] is represented by Equation 3.
It can be summarised from the above equations that inhabitants belonging to this thermal study are more resistant to higher temperature in comparison to those recommended by ASHRAE 55 (2010) [9, 22].
Result and Discussions
Questionnaire based thermal survey conducted for both vernacular and modern conventional included study and analysis of different aspects of design-planning and material pertaining to the buildings like site planning, house orientation with reference to direction of sun and wind, design, spatial arrangement, building age, occupants, building material, windows and door openings, provisions of light and ventilation in the buildings for thermal measurements. Based upon the exhaustive regression analysis conducted for thermal measurements, range of comfort temperatures was evolved in context to neutral temperatures, indoor temperature, and outdoor temperatures of the area.
Study findings
The selected typologies have building strategies in terms of different architectural design-planning and building materials although both are located in same composite climate. Adaptive strategies adopted by the inhabitants like opening and closing of windows offered optimal ventilation for thermal comfort of occupants, but no substantial change in airspeed was found, therefore the parameter was not addressed. The occupants’ adaption to outdoor climate was prominently evident in their attire choice. In winter, adding of garment layers is the most desired way of adaptive control. Lucknow’s outdoor winter temperatures ranged from 10°C to 28°C.
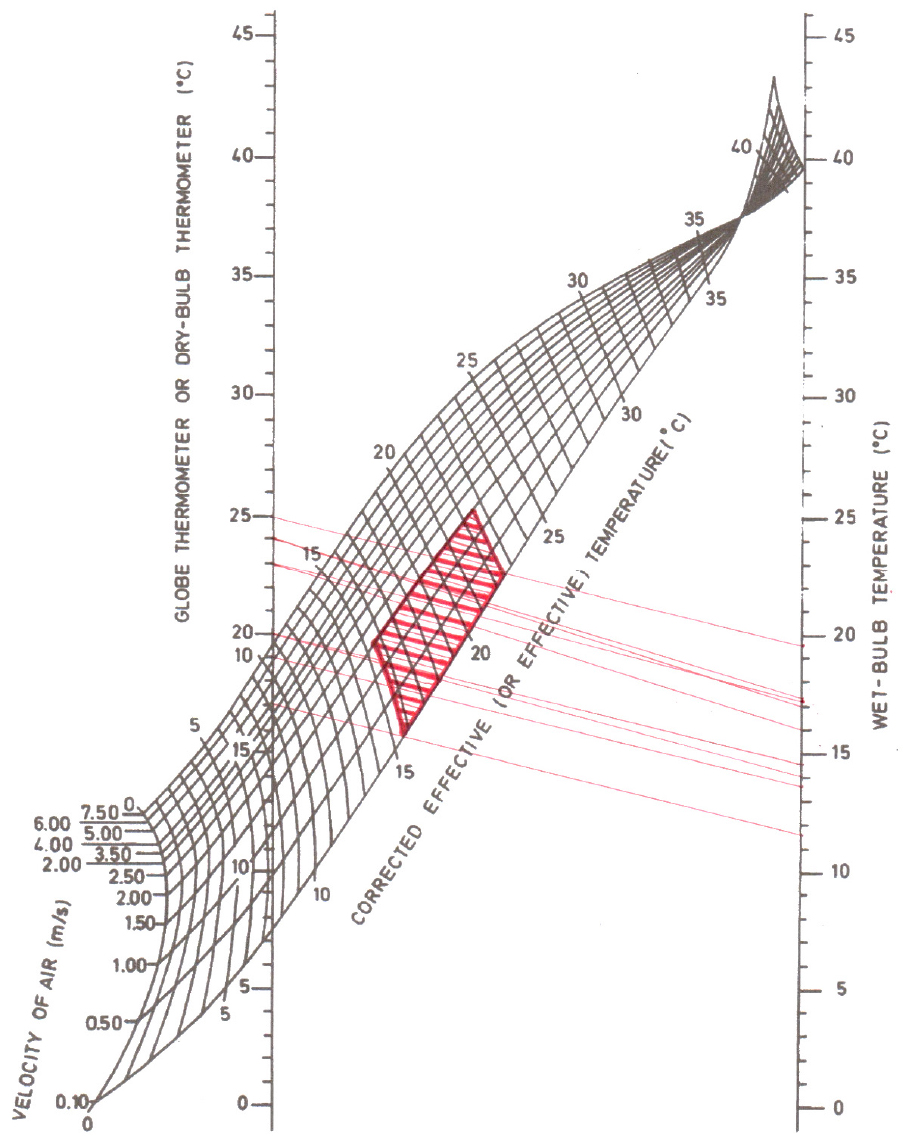
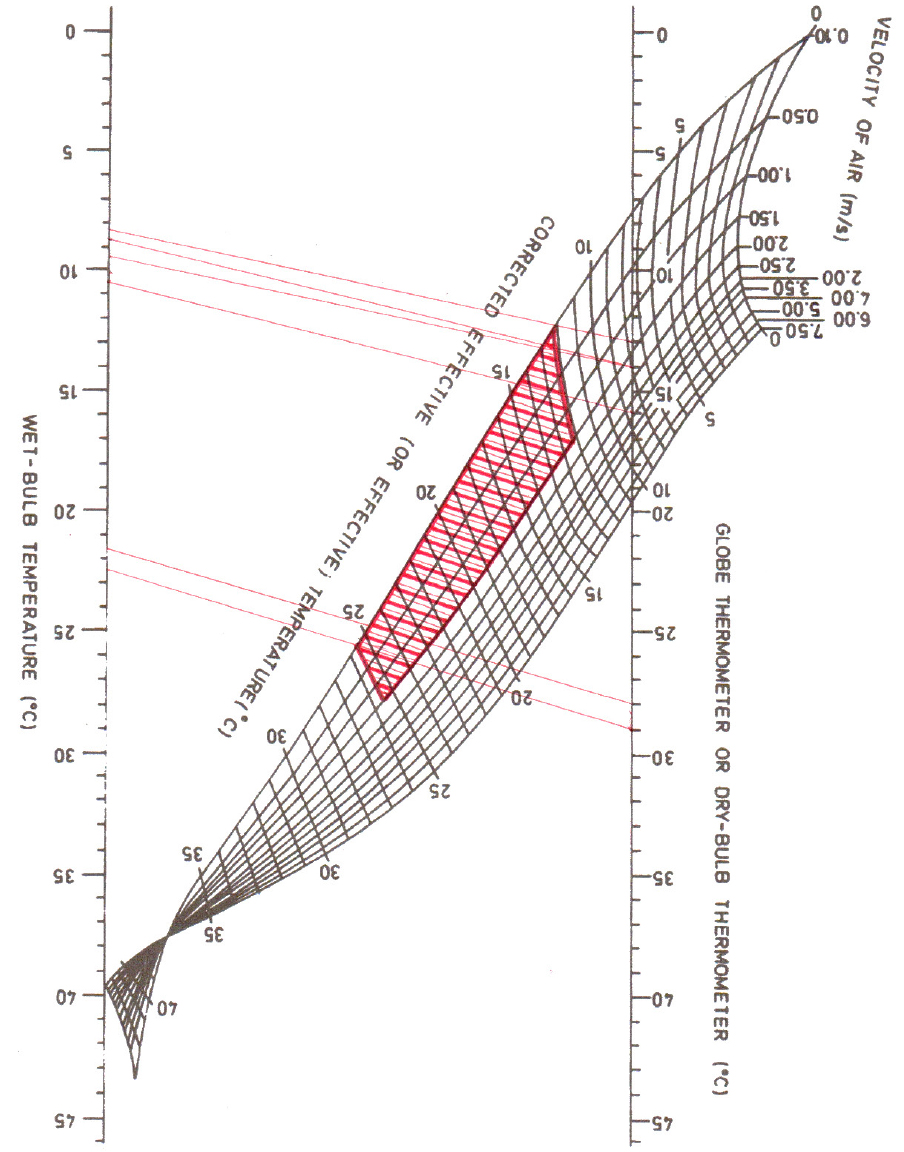
According to thermal comfort indices calculation [41, 42], the Corrected Effective Temperature (CET) for each of the vernacular and conventional houses was determined using the nomogram, which includes three major variables responsible for thermal comfort in any building, that is, Dry-Bulb Temperature (DBT) (in °C), Wet-Bulb Temperature (WBT) (in °C), and wind velocity (in m/sec). The DBT and Relative Humidity (RH) were measured on-site during the survey, and the WBT was determined using the Psychrometric chart [42].
The CET obtained for each of the vernacular houses was in the range from 18.0°C to 22.5°C for the month of December, 15.6°C to 18.2°C for the month of January, and 20.3°C to 21.3°C, for the month of February. The wind velocity was measured using the anemometer during on-site survey which is within the comfortable limit of 0.1 to 1.5 m/sec. The RH, also measured during on-site survey, ranges from 48.5% - 60%. Hence, the comfortable temperature zone in vernacular houses ranges from 15.6°C to 22.5°C, against outdoor temperature range of 10°C to 28°C and the corresponding comfort zone for these vernacular houses is shown in Figure 12.
Similarly, the CET obtained for each of the conventional modern houses was in the range of 12.9°C to 14.6°C for the month of December, 13.0°C to 12.6°C for the month of January, and 24.7 to 25.3°C for the month of February. The wind velocity was measured using the anemometer during on-site survey which is within the comfortable limit of 0.1 to 1.5 m/sec. The RH, also measured during on-site survey, ranges from 47.5% - 58%. Hence, the comfortable temperature zone in conventional houses ranges from 12.6°C to 25.5°C against outdoor temperature range of 10°C to 28°C, and the corresponding comfort zone for these conventional modern houses is shown in Figure 13.
Here it is important to mention that vernacular dwellings involved low external energy equipment use since all rooms had ingress of natural sunlight and big windows and ventilators which kept the thermal environment acceptable for the occupants. Conventional dwellings relied on external energy equipment because of absence of means of ventilation and natural sunlight. Some residents were thermally comfortable yet unhappy with their surroundings. Several psychological aspects also affect state of thermal comfort of the occupants. Vernacular dwellings featured courtyard architecture, so residents had access to maximum natural air and sunlight, which are prerequisites of a healthy atmosphere. The spacious spatial planning, use of light-coloured paint and ingress of natural sunlight in their courtyard gave them a feeling of relaxed and comfortable living. On the contrary, in case of conventional house planning, which was compact owing to expensive land costs coupled with lack of natural air and sunlight room gave the residents a dismal impression. The study found that natural sunlight made a space feel better and therefore, has a larger role to play in case of state of thermal comfort than use of artificial lights. Vernacular homeowners felt happier than conventional homeowners.
Conclusions
The thermal comfort study based upon questionnaire-based survey was carried out in the months of December, January, and February of winter season for composite climate of Lucknow examining two housing types; vernacular and conventional housing which were located at Narhi area and Gomti Nagar respectively. Exhaustive analysis of different parameters and aspects was conducted. The important findings of the study are:
1.Wide variations in mean indoor thermal temperature for the both categories of houses are 15.0°C - 22.5°C for vernacular houses, and 13.0°C-30.0°C for modern conventional houses with mean outdoor temperature variation from 10.0°C - 28.0°C. This shows building envelope performance of a house is dependent upon building material specifications, design and planning strategies adopted.
2.Thermal comfort indices shows that the comfortable temperature zone in vernacular houses ranges from 15.6°C to 22.5°C with RH variation of 48.5% - 60%, whereas in conventional houses it is from 12.6°C to 25.5°C with RH variation of 47.5% - 58%.
3.Thermal comfort equations developed showing the state of neutrality for vernacular houses as and for modern conventional houses as indicate that occupants of the vernacular houses and modern conventional houses are more resistant /acclimatized to heat changes than the thermal comfort ranges given by ASHRAE Standards.
4.Thermal comfort index and survey clearly show that the vernacular houses are more thermally comfortable, as the indoor air temperature usually within the identified thermal comfort range. However, same is not the case for conventional modern houses.
Based on these comparative results, it can be concluded that the thermal environmental parameters like indoor temperature, humidity etc. are different for different housing typology, which is further dictated by type of material used, planning and design strategies involved. This in turn incites personal adaptations for achieving thermal comfort on the part of inhabitants. Therefore, thermal comfort is a state of thermal neutrality felt by occupants with reference to given set of environmental parameters and is subjective for occupants. However, by behavioural adaptations of occupants, thermal comfort range is affected and vary against the standard thermal comfort range given by ASHRAE Standards. In this regard, therefore, the study concludes that occupants of vernacular houses are in better state of thermal comfort as compared with occupants of modern conventional houses, which can be advantageously looked upon by planners and architects to amalgamate vernacular wisdom in modern conventional houses to maintain thermal comfort.
