

Introduction
Material and Methods
Study Area
Questionnaire Survey
Demographic attributes of respondents
Results and Discussion
Theoretical and Practical Implications
Limitations and Directions for Future Research
Conclusions and Recommendations
Introduction
Climate change is the average temperature change over a long period (decades or longer). It can be caused by long-term changes in the atmosphere or land use caused by humans or by long-term natural processes [1]. Although there are many reasons for climate change, there does not appear to be a true consensus among academics on the topic as to which of these or other variables may be dominant [2, 3, 4, 5]. Among other things, humans have been altering the earth’s energy balance by draining wetlands, irrigating farms, changing land use, and emitting greenhouse gases into the atmosphere [6]. The use of fossil fuels, the production of cement, the flaring of natural gas, bushfires, and agricultural practices are other sources of anthropogenic emissions that contribute to the greenhouse effects [7]. The extent of human influence over the current climate has now surpassed the limits of natural variability and has confirmed that anthropogenic activities are the main driver of climate change [6, 8]. This can be better understood by the fact that the effect of human activities on the environment halted to a large extent during Covid 19 as the extent of the virus spread appeared to influence people’s travel behavior in different ways [9] and thus leading to the positive impact on climate change.
The effects of climate change and fluctuation are wide-ranging, but they can be divided into concerns for agriculture, the economy, the environment, society, and health. In addition, the IPCC [10] claimed that climate change, particularly when it is poorly understood, has significant effects on the world’s population, including floods, droughts, food shortages, the rise of new diseases, and global warming. Furthermore, [11] acknowledged that all facets of human socioeconomic activity, including the environment in which people live and the natural resources that sustain them, would be impacted by climate change. Similarly Reducing cooling energy in summer by adjusting window ratios and incorporating canopies—key elements of building design—supports carbon forest initiatives, increases energy efficiency, enhances user comfort, and optimizes operational performance [12].
Industrialized countries have a higher level of awareness of climatic fluctuations as compared to developing countries [6, 9]. Additionally, in certain developing nations like Asia, the Middle East, and Africa, it is insignificant [11, 13, 14, 15, 16]. The nations in these regions have not given environmental issues any importance [14]. However, USAID [17] revealed that those living in developing countries may be more affected by the effects of climate change than people in developed countries. Furthermore, global climate change brings both opportunities and threats. Therefore, by being aware of, preparing for, and adapting to a changing environment, people and society can seize opportunities and lower their risks [18]. Traditional Knowledge related to climate-adaptive approaches, such as aligning buildings with the sun and wind, utilizing direct sunlight and shading techniques, optimizing the building envelope and form, organizing interior spaces strategically, incorporating greenery, selecting suitable building materials, and employing specific roof designs in the vernacular houses, are designed to minimize excessive heat absorption [19]. Overall, this illustrates the importance of including climate change studies with specific fields of traditional knowledge related to Climate change in the curricula at all levels of schooling across the nation [20].
Changing precipitation patterns, rising temperatures, deadly floods, repeated droughts, and glacier melting are just a few examples of how regional climatic differences have impacted ecosystem changes [21]. Records show that the last five decades have been the warmest in the last six centuries [22, 23] While the scientific evidence from IPCC [24] indicated that the average temperature has risen by 0.6°C over the past century. By the end of the century, an increase of around 2-3°C is anticipated [21]. Climate changes are predicted to be greater and less predictable in the twenty-first century as a result of greenhouse gas emissions than they were in the twentieth century [25].
Furthermore, it is highlighted that people’s knowledge and perceptions differ between and within locations [10, 14, 15]. The connection between perceived climate risk and backing for environmental expenditures becomes stronger as political trust rises. This suggests that individuals who perceive higher climate risks are more likely to support environmental funding when their trust in political systems is higher [26].
The College is a premier learning institution. College students should be aware of the concerns of climate change and sustainable development. Although scientific, comprehension of concepts and phenomena related to climate change is beneficial for all people. It is sufficient to say that undergraduates are responsible for passing on this information when they graduate and begin working in their fields [4]. Understanding your impact on the climate and how the climate affects you and society is a requirement for climate science literacy, according to [27]. A person who is climate literate: comprehends the fundamental concepts underlying the Earth’s climate system; can evaluate climate information that is supported by science; effectively communicates about climate and climate change; and is capable of making responsible decisions regarding actions that may have an impact on the climate [28, 29]. Students can contribute to the efforts to lower greenhouse gas emissions. The most effective strategy to increase public knowledge of significant environmental issues and to encourage adaptive behaviour in response to global warming and climate change is to provide environmental education to students [30, 31]. Not only this the information about the house design affects energy consumption as optimizing daylight design can help reduce energy demand and mitigate the environmental impact associated with excessive electricity use as the study highlights that room depth is the most crucial factor influencing daylight performance, with window size, orientation, balconies, and shading also playing key roles. Poor daylighting, especially in areas like kitchens, may lead to increased dependence on artificial lighting, driving up energy consumption and contributing to higher carbon emissions [32].
Numerous researches have been conducted on how students perceive and are affected by global warming, and climate change [22, 23, 33, 34, 35, 36] across the world. The students believed in the anthropogenic origin rather than the natural of climate change and thus suggested that climate change may be integrated into the curriculum as many students lack the awareness about it and to make them take climate action in their daily lives [37]. [38] studied the climate change perception of Portuguese university students. and revealed that the majority of the students showed concern for climate change but desired more knowledge regarding the subject. It was found that most of the students lacked the skill to deal with it and they were unaware of the consequences of climate change and thus suggested the incorporation of climate change in the training programs of students and teachers. [39] analyzed the climate change manifestation through people’s perception, in the Kashmir Valley and revealed that many locals have noticed concerning changes in the environment in the form of decreased rainfall snowfall and a drop in stream discharge.
An average temperature increase of 1.5 °C was recorded in the Himalayas between 1982 and 2006 [34] in contrast to the global average temperature increase of 0.6 °C from 1975 to 2005 [22]. Even neighbouring regions reported 1.7°C from 1981 to 2010 [8]. Despite significant weather variations in J&K, no investigations on local perceptions and their engagement in low carbon behavior have been conducted except the one conducted in District Rajouri of Jammu Division in Jammu and Kashmir [40]. So, using data from colleges in Kashmir Valley, Jammu and Kashmir, we tried to determine how much students are aware of climate change. Whether they are aware of it or not, when establishing their opinions, students create experiences based on what they observe from their instructors, parents, peers, and first-hand experiences [41]. As a result, it may be said that pupils represent the “culture” of the neighbourhood, which, according to [26], is similar to how everyone in the neighbourhood views environmental issues. Colleges, as prestigious educational establishments and traditional forms of instruction, facilitate the assimilation and dissemination of shared perspectives. Experiences are shared, and perspectives are standardized through education. Our objectives in this investigation were to determine the following:
ㆍThe degree of student understanding of climate change, their participation in low-carbon behavior, and the adoption hurdles.
ㆍWhether gender, subject stream, parental literacy, or student residence (rural/urban) impacts students’ perceptions about climate change and adoption of low-carbon behaviours.
Material and Methods
Study Area
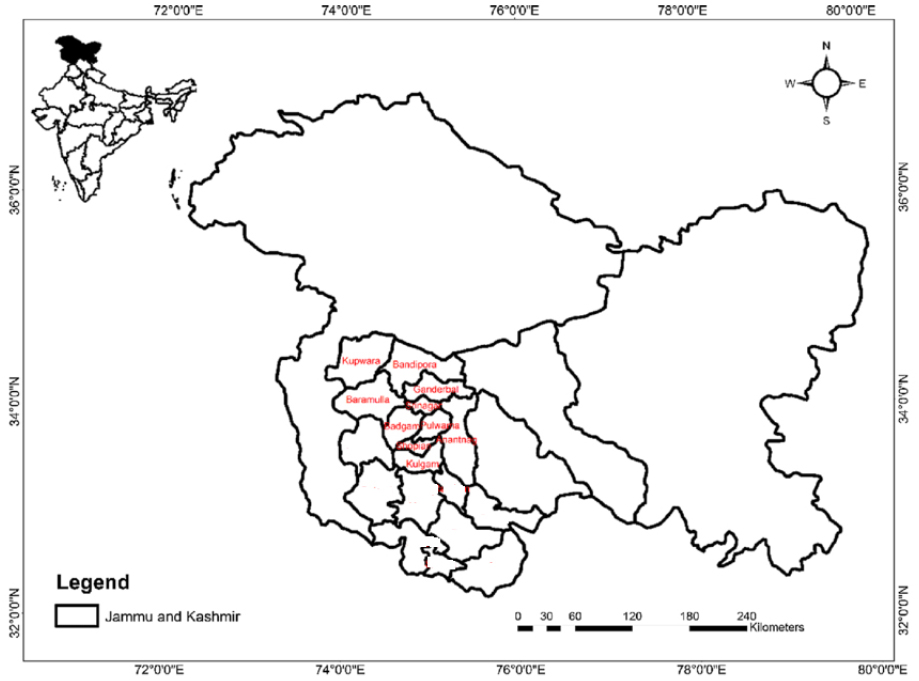
To find out how students view climate change, the Kashmir Valley has been our selected study area. The geographical coordinates of Kashmir Valley are latitudes 32°.22" and 34°.43" north and longitudes 73°.52" and 75°.42" east [1]. The Jhelum River’s drainage basin coincides with the geographical boundaries of Kashmir’s stunning valley (Figure 1) [42].
Questionnaire Survey
The main source of data for this study was questionnaire surveys given to students at Kashmir Valley’s Govt. Degree Colleges in Jammu and Kashmir. The Jammu division and the Kashmir division comprise the two divisions that make up the union territory of Jammu and Kashmir. There are 142 Govt. Degree Colleges, 02 Govt. College of Engineering and Technology and 04 private grant-in-aid colleges in the Union territory of Jammu and Kashmir. Among the 142 Govt. Degree Colleges, 70 are in Kashmir Valley, and 72 are in the Jammu division. The colleges form the larger part of the higher education sector in the region and are considered the hub of knowledge and talent. Despite being strategically important, these institutions have received little attention from researchers. To narrow down the sampling unit, students from only twenty colleges, with two colleges from each district, were selected for the present study. The districts include Anantnag, Pulwama, Kulgam, Shopian, Srinagar, Budgam, Ganderbal, Bandipora, Baramulla and Kupwara.
The questionnaire was adapted from [43], who surveyed climate change perception among students in Hong Kong. To gain a more comprehensive knowledge of how students perceive climate change, our questionnaire had four components, each of which was derived from a different researcher.
Section A investigates the students’ understanding of climate change in terms of its causes, impacts, and solutions. Ten questions that make up the scale were taken from Liarakou et al. [5], Dijkstra and Goedhart [22] and Wong [44]. The scale was scored using a 3-point Likert system, where 1 denotes “True,” 2 denotes “False,” and 3 denotes “Don’t Know.”
Section B discusses adopting low-carbon behaviour (LCBs). With reference to a few of the LCBs, [45] created a 10-item scale. The LCBs studied in this study included waste segregation for recycling, energy saving, sustainable consumption, sustainable eating, eco-friendly transportation, and involvement in low-carbon activities. The rating was determined using a Likert scale with a maximum score of 5, where 1 means “very often engage” and 5 indicates “almost never engage.”
Section C examines how the students feel about the challenges of implementing LCBs. The measure consists of five items that assess societal and personal barriers (such as a lack of interest or difficulty changing one’s lifestyle). Using a 5-point Likert scale, “1” denotes the strongest agreement that the item in question constituted a barrier, and “5” denotes the strongest disagreement, all items were scored.
Section D looks into how pupils viewed the severity of the impacts of climate change in Jammu and Kashmir. The Environment Bureau picked the survey items as the most sensitive components that will be most negatively impacted by climate change [36]. The seven-item measure covered both the natural environment and the human environment. A 5-point Likert scale was employed, with “1” denoting the extremely unserious and “5” the reverse.
The convenience sampling method was used to choose the sampling units (Government Degree Colleges) from the total number of colleges located in both urban and rural areas and to choose the students across all the districts of the geographical location opted for the study. This handy sampling technique was chosen because it depends on data gathered from population members who are readily available to participate in a study. Additionally, it is a widely used sampling technique among academics because of its promptness, simplicity, affordability, and accessibility of members for sample participation. The survey was conducted in the 20 Colleges spread over 10 districts of Kashmir Valley from November 2023 to March 2024. Of the total 1129 students submitted their responses with almost equal proportions from every district. The convergent validity of the constructs/variables was examined through Average Variance Extracted (AVE) and Composite Reliability (CR). The discriminant validity was established by comparing the squared root of the AVEs of each construct with its corresponding correlations.
To test whether the mean values of two or more independent groups differ significantly from each other, the researchers employed two important statistical tools i.e., t-test and one-way ANOVA. The t-test is used when there are only two independent groups whereas, one-way ANOVA is applicable in case of more than two independent groups.
Demographic attributes of respondents
The data on the demographics of the respondents is listed in Table 1. Out of 1129 respondents males were 537 and females were 592, students from semester 1st were 197, 192 from semester 2nd, 177 from semester 3rd, 191 from semester 4th, 198 from semester 5th, and 174 from semester 6th, students with Bachelor of Arts Stream were 583, 306 from Bachelor of science stream and 240 from other streams like B.Com, BBA, BCA, etc, students from the rural residence were 663 and from urban areas were 466, students with illiterate father were 417 and with literate father were 712, students with illiterate mothers were 590 and with literate mothers were 539, students with father’s occupation as govt service were 245, with private service were 246 and with self-employed father were 638. Students with family income less than 25000 were 674, between 25000-50000 were 251, and above 50000 were 204.
Table 1.
Demographic Information of Respondents
Results and Discussion
The data was collected from the students of colleges of Kashmir Valley belonging to different semesters with different socio-demographic attributes. The data collected was analyzed using SPSS and is discussed below. The variable has been studied under the following sub-variables.
Section A: Understanding about Climate Change (UCC).
Section B: Engagement in low carbon Behaviour (LCB).
Section C: Hurdles in the adoption of low carbon Behaviour (HLCB).
Section D: Impacts of climate change on several aspects in Jammu and Kashmir (ICC).
The Cronbach’s α value for the sub-variables under Sections A, B, C, and D is 0.815, 0.848, 0.679, and 0.775 respectively. The composite reliability (CR) for LCB, UCC, ICC, and HLCB is 0.802, 0.768, 0.777, and 0.681(rounded off to 0.7) respectively While as average variance extracted (AVE) values of LCB, UCC, ICC, and HLCB are 0.332, 0.294, 0.335 and 0.302 respectively as indicated in Table 2.
Table 2.
Convergent and Discriminant Validity
| Variable | CR | AVE | LCB | UCC | ICC | HLCB |
| LCB | 0.802 | 0.332 | 0.576 | |||
| UCC | 0.768 | 0.294 | -0.136*** | 0.542 | ||
| ICC | 0.777 | 0.335 | 0.295*** | -0.232*** | 0.579 | |
| HLCB | 0.681 | 0.302 | 0.324*** | -0.126** | 0.541*** | 0.550 |
Although the AVE values are less than 0.5, [46] state that Based solely on CR, the researcher may still determine that the construct’s convergent validity is sufficient because AVE is a more conservative metric than CR, even though error accounts for more than 50% of the variance. Thus, it may be said that all of the constructs have demonstrated convergent validity. By comparing the squared root of AVEs of the constructs with the corresponding construct correlations, it is observed that all the diagonal values (the squared root of AVE) are greater than off-diagonal values (inter- construct correlations), thus indicating the presence of good discriminant validity between construct.
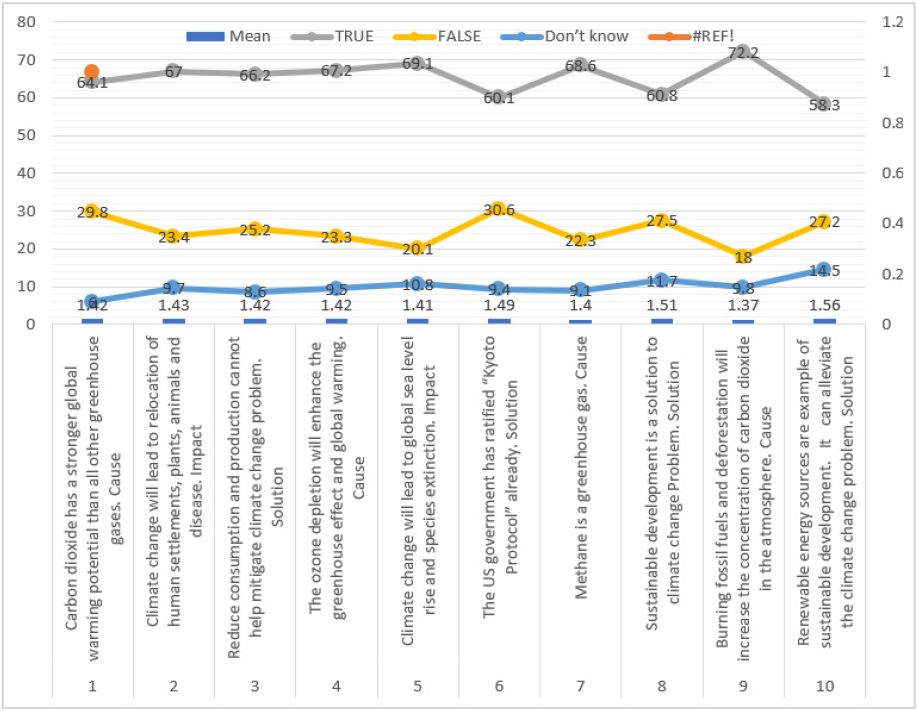
From Table 3 and Figure 2, it can be inferred that students are not very aware of the causes, impacts, and solutions of climate change as depicted by the mean value of 1.44 with 50.49% of the students having knowledge about climate change and 39.61% gave the wrong answer to the question and 9.91% opted “don’t know’ option for questions about climate change. However, only 30.6% of students were aware that the US, the largest producer of greenhouse gases, has not ratified the Kyoto Protocol. 34.1% of students were unaware of the impact that climate change has on the shifting of human settlements, plants, and animals and only 25.2% of students were aware that reducing consumption and production can lead to reduced climate change. A very common impact associated with climate change is sea level rise but here still 30.9% of students are unaware of the impact of climate change and 39.2% of students don’t know that sustainable development as solution to climate change. More than 70% of students had knowledge about the burning of fossil fuels and deforestation as responsible causes of climate change. 41.7% of students were unaware of the fact that renewable energy sources as an example of sustainable development can reduce climate change. Only 23.3% of students knew that ozone depletion would not lead to global warming as they are different environmental issues. It was also found that only 29.8% of students know that carbon dioxide does not have stronger global warming potential (GWP) than other greenhouse gases as gases like methane, CFCs, and nitrous oxide have stronger GWP than carbon dioxide [47].
Table 3.
Student’s understanding of climate change (UCC)
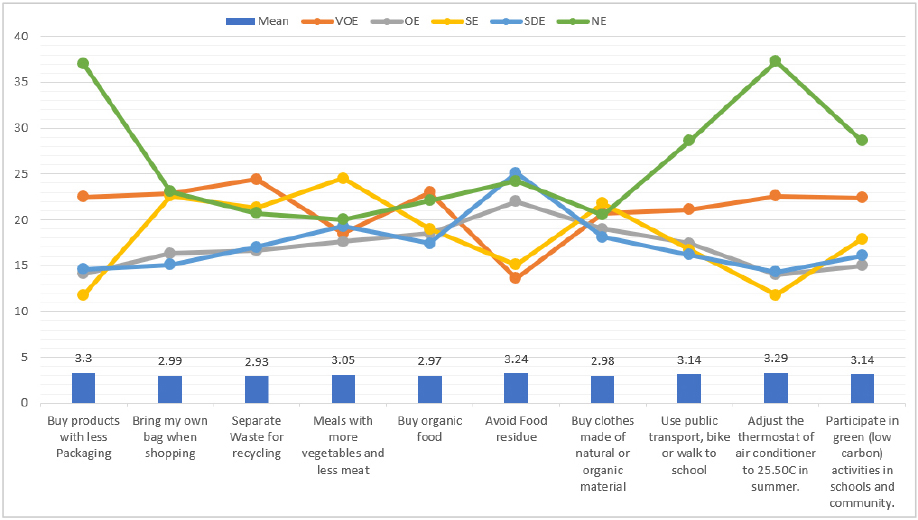
As shown in Table 4 and Figure 3, the mean for “engagement in LCB” was 3.10, which indicates that students practiced LCBs a little bit more frequently than occasionally. It is revealed that students engage in low carbon behaviors partially like buying products with less packaging (36.6%), shopping with their own bag (39.9%), Use Public transport (36.5%), preferring vegetables over meat (36.1%), buy organic food (41.5%), avoid food residues (25.6), wear clothes of natural material (39.7%), participate in green activities (37.4%). However, more than 49% of students do not engage in avoiding food residues and more than 50% do not buy products with less packaging. It was also found that 37 % never buy products with less packaging, 23.1% never bring their own bagging for shopping, 20.7% never separate waste for recycling, 20% never prefer vegetables over meat as a food source, 22.1% never buy organic food, 24.2% never avoid food residues, 28.6% never prefer public transport over private transport and 28.6% never participated in green activities inside the college campus. Overall, it can be inferred that people are not ready to change their behaviors towards low carbon and thus curbing climate change will be difficult.
Table 4.
Students’ engagement in low carbon (Green Living) Behavior (LCB)
| S.No. | Item | Mean | VOE | OE | SE | SDE | NE |
| 1 | LCB1 | 3.30 ± 1.61 | 22.5 | 14.1 | 11.8 | 14.6 | 37 |
| 2 | LCB2 | 2.99 ± 1.47 | 22.9 | 16.3 | 22.6 | 15.1 | 23.1 |
| 3 | LCB3 | 2.93± 1.46 | 24.4 | 16.6 | 21.3 | 17 | 20.7 |
| 4 | LCB4 | 3.05 ± 1.38 | 18.5 | 17.6 | 24.5 | 19.3 | 20 |
| 5 | LCB5 | 2.97 ± 1.47 | 23 | 18.5 | 19 | 17.4 | 22.1 |
| 6 | LCB6 | 3.24 ± 1.39 | 13.6 | 22 | 15.1 | 25.1 | 24.2 |
| 7 | LCB7 | 2.98 ± 1.42 | 20.7 | 19 | 21.8 | 18.1 | 20.5 |
| 8 | LCB8 | 3.14 ± 1.52 | 21.1 | 17.4 | 16.7 | 16.2 | 28.6 |
| 9 | LCB9 | 3.29 ± 1.61 | 22.6 | 14 | 11.8 | 14.3 | 37.3 |
| 10 | LCB10 | 3.14 ± 1.53 | 22.4 | 15 | 17.9 | 16.1 | 28.6 |
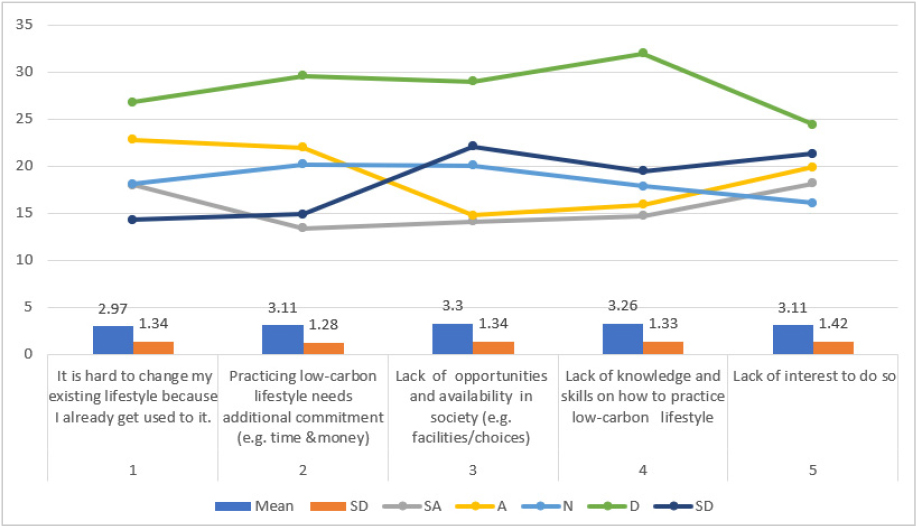
As illustrated in Table 5 and Figure 4, the views of students regarding the barrier to low adoption of low carbon behaviors were found to be moderate as depicted by the overall mean of 3.15. However, the study identified three major barriers that acted as a barrier for the students in the adoption of LCBs: (1) Hard to change my existing lifestyle (Mean= 2.97 ± 1.34), (2) Practicing a low-carbon lifestyle needs additional commitment (Mean=3.11± 1.28) and (3) Lack of interest to do so (Mean 3.11 ± 1.42). Society still lacks auxiliary infrastructure and product options that would encourage low-carbon living, such as organic farming, household waste separation facilities, and the availability of eco-friendly goods at fair costs. It was therefore not surprising that students had this opinion. It is astounding; however, how there is a lack of interest among students to adopt and practice low-carbon lifestyle
Table 5.
Student’s views on hurdles/barriers in adopting low carbon Behaviors (HLCB)
| S.No. | Statement | Mean ± SD | SA | A | N | D | SD |
| 1 | HLCB1 | 2.97 ± 1.34 | 18 | 22.8 | 18.1 | 26.8 | 14.3 |
| 2 | HLCB2 | 3.11± 1.28 | 13.4 | 22 | 20.2 | 29.6 | 14.9 |
| 3 | HLCB3 | 3.30 ± 1.34 | 14.1 | 14.8 | 20.1 | 29 | 22.1 |
| 4 | HLCB4 | 3.26 ± 1.33 | 14.7 | 15.9 | 17.9 | 32 | 19.5 |
| 5 | HLCB5 | 3.11 ± 1.42 | 18.2 | 19.9 | 16.1 | 24.4 | 21.3 |
As observed from Table 6 and Figure 5, students believe that climate change has caused acute impacts in Jammu and Kashmir (Overall Mean 3.38). Students were found to be of the opinion that climate change in Kashmir is having very serious impacts on human health (Mean=3.60) melting of glaciers (Mean=3.45) and moderate effects on built environment and infrastructure (Mean=3.22). Students also viewed the impact on the ecological environment (Mean=3.29) and food supply (Mean =3.38) as serious. Therefore, impacts on climate change in Kashmir are being perceived as very serious by the students.
Table 6.
Students’ view on impacts of climate change in Jammu & Kashmir
| S.No. | Statement | Mean ± SD | VUS | US | M | S | VS |
| 1 | ICC1 | 3.29 ± 1.42 | 16.6 | 12.9 | 23.3 | 19.6 | 27.6 |
| 2 | ICC2 | 3.39 ± 1.25 | 8.3 | 19.2 | 19.8 | 30.4 | 22.2 |
| 3 | ICC3 | 3.22 ± 1.32 | 13.6 | 16.3 | 25.7 | 23.5 | 20.9 |
| 4 | ICC4 | 3.32 ± 1.32 | 12.3 | 16.3 | 21.9 | 26.3 | 23.2 |
| 5 | ICC5 | 3.38 ± 1.35 | 12.8 | 14 | 23.1 | 23 | 27.1 |
| 6 | ICC6 | 3.45 ± 1.48 | 16.1 | 13 | 16.1 | 19.3 | 35.4 |
| 7 | ICC7 | 3.60 ± 1.43 | 13.4 | 10.5 | 18.1 | 19 | 39.1 |
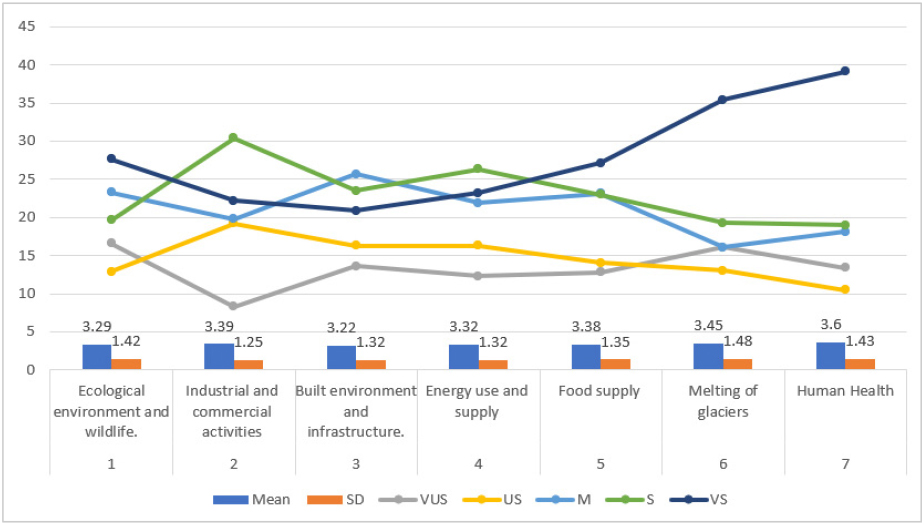
Table 7 and Figure 6(a) and 6(b) revealed that there exists a statistically significant difference, in the understanding of climate change, among the undergraduate students of various colleges of Kashmir valley with respect to their gender as depicted by t-value (3.57) and p-value (0.00) and thus significant at 0.05 level with male students having better understanding of climate change than female students as depicted by their mean values (1.49 for males and 1.40 for females). It has been established that gender plays a significant role in predicting perception and knowledge of climate change [48]. In fact, a number of studies have shown that males and females have different perspectives on environmental issues and climate change, with men demonstrating more accurate knowledge and perception of these issues than women [49, 50]. The difference was also found to be significant at 0.05 level with respect to their mothers’ education as depicted by their t-value (2.50) and p-value (0.01) with students having literate mothers being more aware than students with illiterate mothers. It has also been determined that one of the most significant indicators of people’s awareness of climate change is their educational attainment [51, 52, 53, 54]. Therefore, it was not unexpected that the students in their last year understood more about climate change, the same was found in the study with the final year (5th semester) students having a better understanding than others but the difference was not statistically significant. However, no significant difference in understanding climate change was found with respect to residence, subject stream, fathers’ education, semester in which studying, fathers’ occupation, and family income.
Table 7.
Student’s understanding of climate change with respect to their Socio-demographic attributes
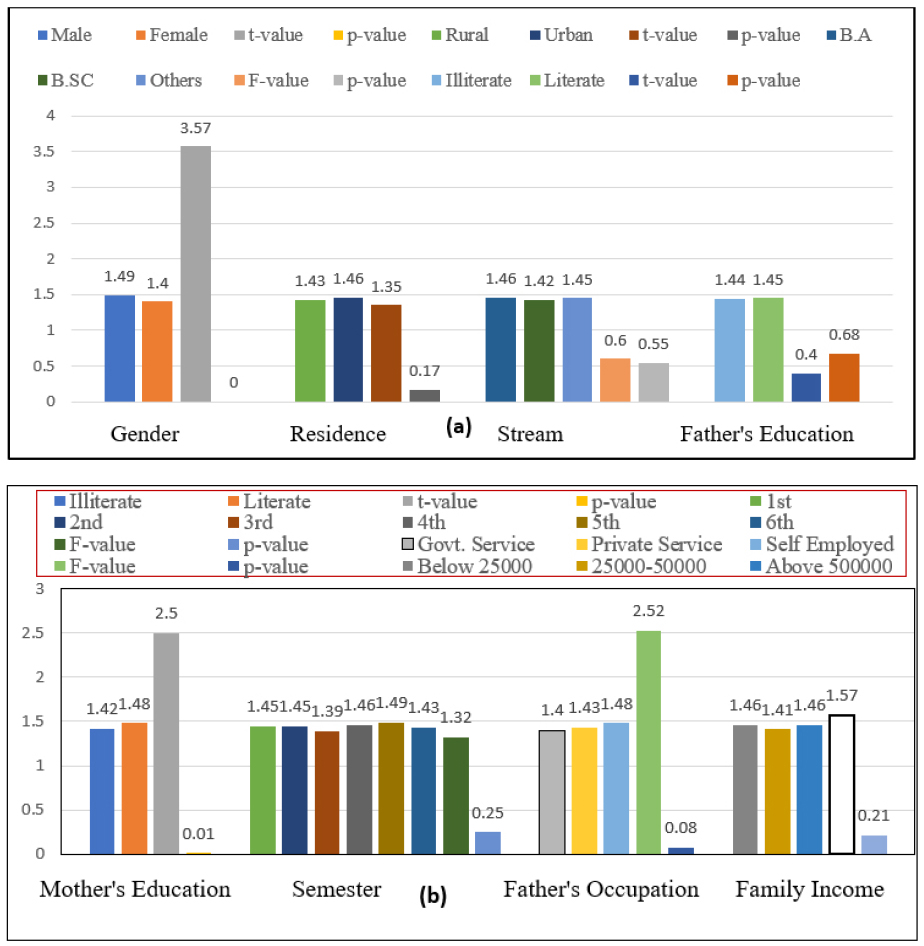
Table 8 and Figure 7(a) and 7(b) revealed that there exists a significant difference, in engagement of Low Carbon Behaviors (LCBs), among the undergraduate students of various colleges of Kashmir valley with respect to their gender as depicted by t-value (2.11) and p-value (0.03) and thus significant at 0.05 level with female students found to be more engaged in LCBs than male students as depicted by their mean values (3.04 for males and 3.16 for females). The difference was also found to be significant at 0.05 level concerning their subject stream as depicted by their F-value (3.53) and p-value (0.03) with students from the science stream more engaged in LCBs than arts stream students, which in turn are more engaged in LCBs than other streams like commerce, computer application, management students. However differences in engagement also existed concerning residence (with rural students more engaged in LCBs than urban students), parental education students with literate parents more engaged than illiterate parents), the semester in which they study (First-semester students more engaged in LCBs than 6th Semester ones), parental income (students with parents in Govt. Service more engaged than students with private and self-employed parents) and family income (with students from middle-income class highly engaged than low and high-income class families), but the difference was not found to be statistically significant.
Table 8.
Student’s engagement in low carbon behaviour with respect to their Socio-demographic attributes
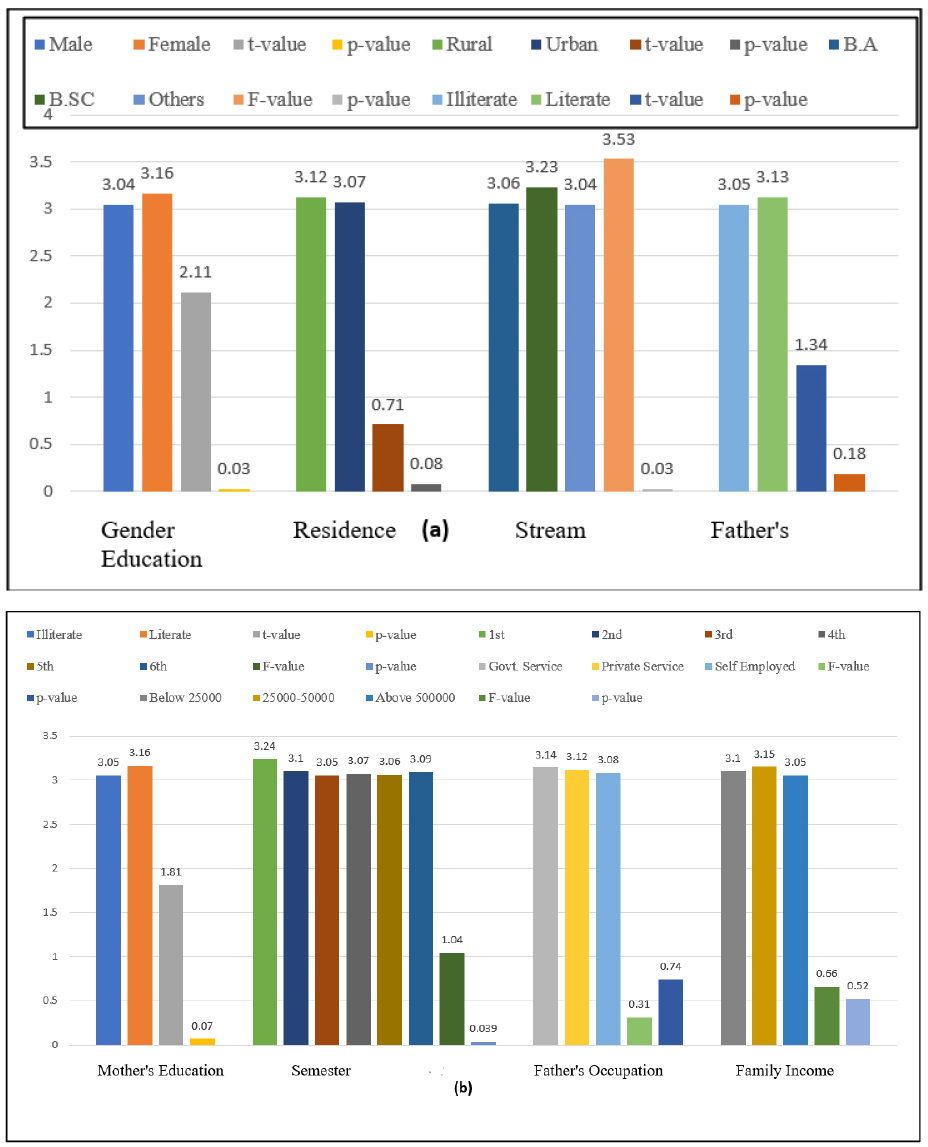
Table 9 and Figure 8(a) and 8(b) revealed that there exists difference, in the views on barriers to the adoption of LCBs, among the undergraduate students of various colleges of Kashmir valley with respect to their gender, residence, subject stream, fathers’ education, mothers’ education semester in which studying, fathers’ occupation and family income, but the differences were not found to be statistically significant as p-value was not found to be less than 0.05 with respect to any socio-demographic attribute.
Table 9.
Student’s views on hurdles/barriers in adopting low carbon behaviors with respect to their Socio- demographic attributes
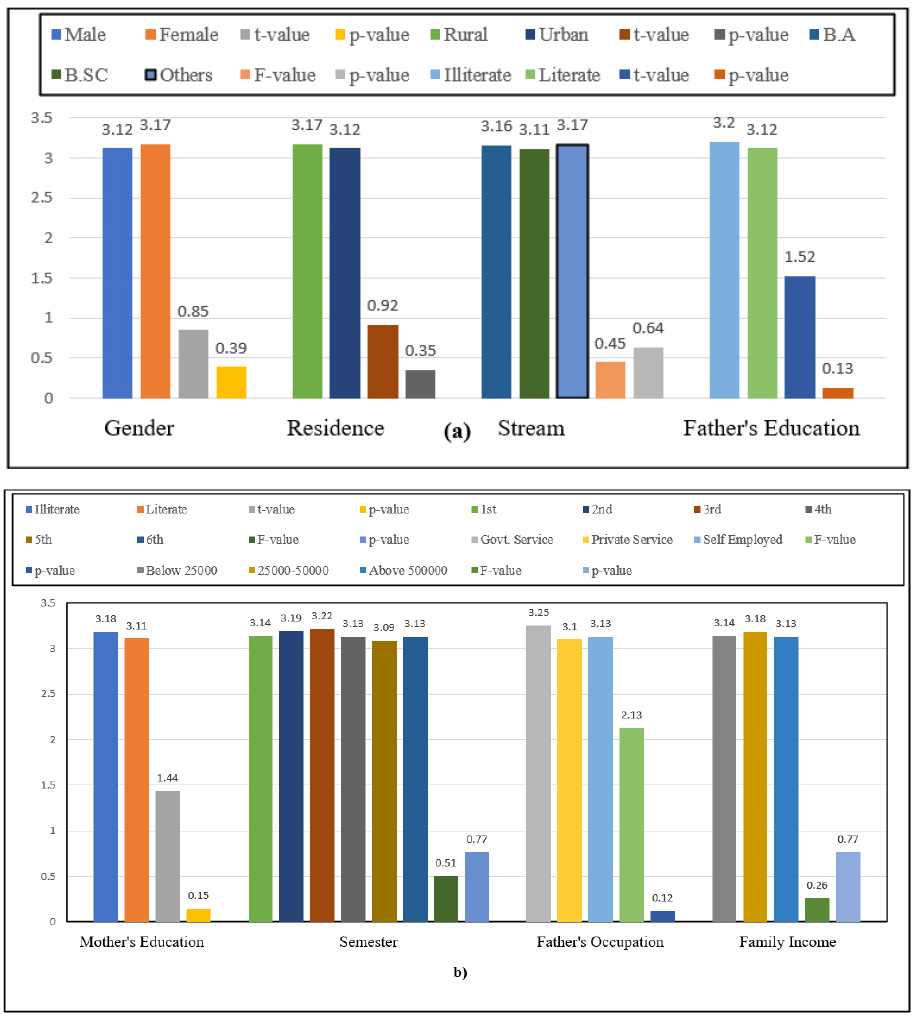
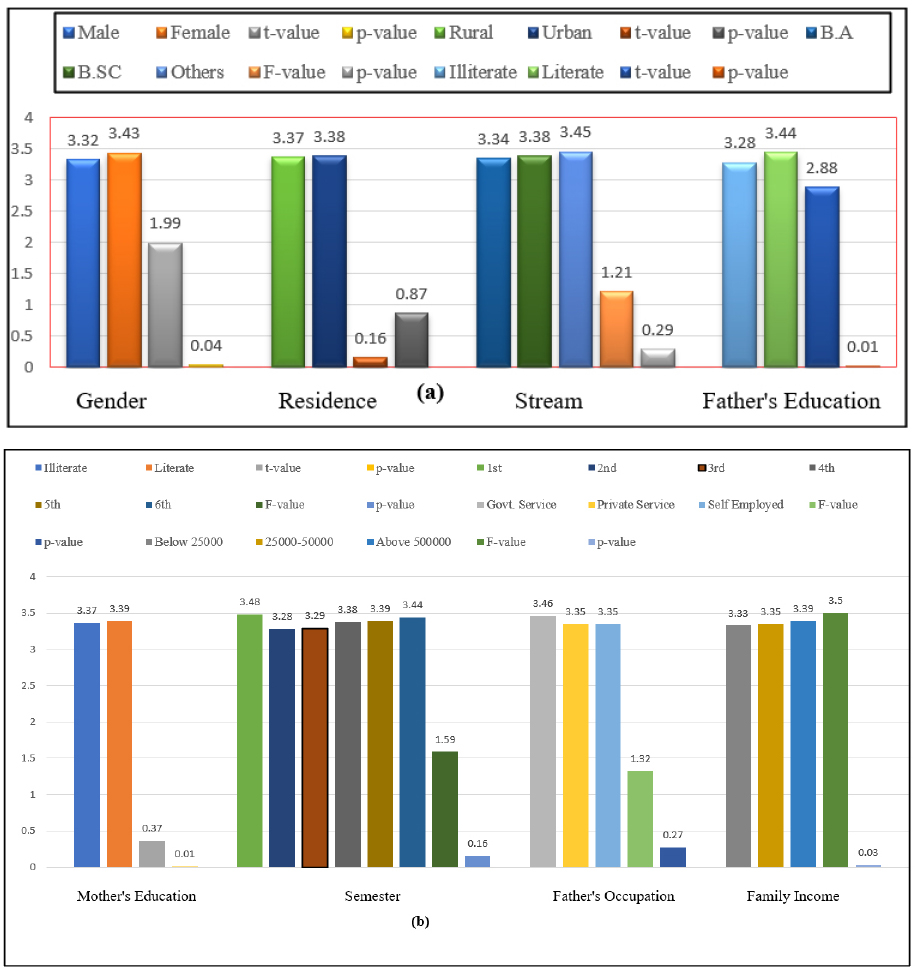
Table 10 and Figure 9(a) and 9(b) revealed that there exists a significant difference, in views on the effects of climate change on various aspects in Jammu and Kashmir, among the undergraduate students of various colleges of Kashmir valley with respect to their gender as depicted by t-value (1.99) and p-value(0.04) and thus significant at 0.05 level with female students having better views on effects of climate change than male students as depicted by their mean values(3.32 for males and 3.43 for females). The difference was also found to be significant at 0.05 level with respect to their fathers’ education as depicted by their t-value (2.88) and p-value (0.01) with students having literate fathers more aware about the effects of climate change than students with illiterate fathers. It was also found that family income had having significant effect on the views of students regarding climate change as depicted by their F-value (3.50) and p-value (0.03) with students from middle-class income families more aware of the effects of climate change than students from upper- and lower-class family income as depicted by their mean values. However, a difference in views on the effects of climate change was found with respect to residence, subject stream, mothers’ education, semester in which studying, and fathers’ occupation, but it was found to be statistically insignificant.
Table 10.
Student’s view on effects of climate change in Jammu &Kashmir with respect to their Socio-demographic attributes
Theoretical and Practical Implications
This study holds significant implications both theoretically and practically, offering valuable insights into how the younger population in Kashmir perceives climate change.
The perceptions captured in this study offer a snapshot of the respondents’ understanding of climate change, reflecting how aware they are of its broader implications. These perceptions show how well they are able to connect visible changes, like shifts in temperature and rainfall, to global environmental changes with far-reaching consequences. They also reveal the respondents’ sensitivity to current environmental issues, their knowledge base, and their personal experiences with these changes. Ultimately, it highlights how much they understand the potential impact of climate change on their own lives and the world around them. It sheds light on the unique perspectives of students in this ecologically sensitive, mountainous region, revealing how their views on climate change differ from those of students in urban, lowland areas. The research highlights a gap in current educational curricula, showing that students are not well-informed about the causes, impacts, or solutions to climate change. Despite this, students were found to engage in low-carbon behaviors (LCBs) slightly more frequently than occasionally, and their awareness of barriers to adopting such behaviors was moderate. This study suggests that with proper guidance and a deeper understanding of climate science, students could play a crucial role in developing effective adaptation strategies for the future. However, unlike in many developed countries, environmental science in college curricula is currently taught as a value-added course rather than a major subject in most of the colleges and thus being treated as a secondary subject, with more focus placed on subjects that are tested in board exams. To address this, there is a need to prioritize Environmental Science education, especially one that integrates hands-on learning about local issues. The curriculum should be revised to emphasize the different aspects of climate change and its local impacts so that students not only gain knowledge but also become motivated to actively participate in crafting solutions. Incorporating local traditional knowledge, along with an understanding of the region’s ecological, geological, and cultural uniqueness, would make these students more engaged and better equipped to contribute to meaningful climate action. The study also identified significant differences in students’ understanding of climate change based on factors such as gender, parental education, and family income. Additionally, the research underscored the acute effects of climate change that students in Kashmir are already experiencing, like changes in weather patterns, glacial retreats, and disruptions in agriculture.
The practical implications of this study are far-reaching. It provides a solid foundation for revising school curricula to include more regionally relevant climate change education, focusing on issues like glacial retreat, flooding, and the lack of snow in winter. Such a revision would not only empower students with knowledge but also prepare them to actively contribute to climate adaptation and mitigation strategies. The survey results can also inform public awareness campaigns or student-led climate initiatives aimed at addressing local environmental issues like water scarcity and air pollution. Furthermore, the findings could support the development of climate policies tailored to Kashmir’s unique needs, such as sustainable agriculture and ecosystem restoration. On a community level, the study could help identify young climate leaders who could champion local environmental causes and drive grassroots action. Overall, the study’s theoretical contributions deepen our understanding of climate change perceptions, while its practical outcomes pave the way for more localized and effective solutions.
Limitations and Directions for Future Research
The present research work admits some limitations that offer valuable directions for further investigation. This study examines only the socio-demographic determinants of climate change among students. Future studies may be conducted to investigate other determinants of climate change. This study is confined to the Jammu and Kashmir, India only. Further studies may be carried out at other geographical locations to gain more insights into the domain. The present study focussed on the knowledge of undergraduate students about climate change. Future research may be conducted by investigating the knowledge of students of other regions to better frame policies to promote environmental awareness among students through their education system and that will have more influence on their environment and adaptive actions towards climate change.
Conclusions and Recommendations
The perception of undergraduate students of Kashmir Valley towards climate change was studied by studying their knowledge about climate change, engagement in low carbon behavior (LCB), barriers to adoption of low carbon behaviors, and views on the effects of climate change. It was concluded that students are not much aware of the causes, impacts, and solutions of climate change, practiced LCBs a little bit more frequently than occasionally, and views regarding the barriers in low adoption of low carbon behaviors were found to be moderate and effects of climate change were found to be acute. It was also concluded that there exists a significant difference, in understanding of climate change, among students with respect to their gender and mothers’ education. In the case of “Engagement of Low Carbon Behaviors (LCBs)”, students were found to have significant differences with respect to gender and subject stream, and no significant difference was observed among students with respect to barriers in the adoption of LCBs and in the case of views on impacts of climate change on several aspects in Jammu and Kashmir, a significant difference was observed with respect to gender, father’s education, and family income. Our study adds to the small body of work on perceptions and knowledge of climate change in Jammu and Kashmir, India. More significantly, it draws attention to the knowledge gaps that local undergraduate students have in the field of climate change science. Our findings have wider ramifications for future studies and suggested courses of action. Our findings demonstrate the critical need to raise undergraduate students’ awareness of and educate them about climate change in the region, as this is a critical component of the worldwide strategy for addressing the climate change crisis. College courses on climate change ought to be interactive, multidisciplinary, imaginative, and emotionally charged. Climate change should be discussed in a variety of environmental student clubs, and if there aren’t any already, there should be encouragement to start one. Organizations dealing with climate change are also urged to get more involved in the public, particularly schools. Community education should incorporate partnerships between public and private players, such as local governments, universities, non-governmental organizations, and community groups.
