Introduction
Material and Methodology
Materials
Description of the thermoenergetic model of the building
Configuration factors (F) setting
Energy balance in photobioreactor
Temperature control
Result and Discussions
Photobioreactor thermal behavior
Heat rates in the photobioreactor
Discussion
Conclusions
Introduction
Bioenergy accounts for 55% of global renewable energy production. In the last decade, the use of bioenergy has grown by 6% and there is a growth forecast of 10% by 2030 [1]. Bioenergy is commonly generated through biomass derived from sugarcane, charcoal, or firewood [2]. A less common alternative - but promising - for bioenergy production is biomass from microalgae.
Microalgae through photosynthesis convert solar and CO2 into organic matter. This organic compound can be used as biomass, which can be used to produce biofuels such as bioethanol, biodiesel, biomethanol, or biogas (H2) [3, 4, 5]. The advantage of microalgae for bioenergy generation compared to more traditional biomass alternatives is the unnecessary use of large arable areas for cultivation and the high rate of CO2 sequestration [6].
However, the cultivation of microalgae for bioenergy generation has not yet been economically viable for large-scale energy generation due to high production costs and instability in parameter control, such as temperature [7]. Microalgae achieve higher biomass productivity when grown in so-called photobioreactors (PBRs) – closed systems composed of glass, polymers such as polychloride vinyl - PVC, polycarbonate or polyethylene, and a space where microalgae culture is stored [8, 9].
One of the limitations of photobioreactors is temperature control, which increases the operating costs of these systems and energy consumption. Under solar radiation, PBRs overheat during warmer seasons. In winter, these systems can reach low temperatures that reduce biomass productivity by microalgae [10]. Microalgae are thermophilic organisms; they depend on temperature to grow. The growth of these microorganisms rises according to the cultivation temperature increase until an optimal point. By exceeding this point, there is a decrease in the growth rate and, consequently, in biomass production [11].
The PBRs temperatures can reach values from 10 to 30°C above the local outdoor temperature. For each species of microalgae, there is an ideal temperature interval for cultivation that can range from 10 to 35°C [8, 10, 12]. An energy balance was simulated for stand-alone photobioreactors through MATLAB for 6 United States cities in 6 differents American climate zones – Forks, WA (Marine Westcoast), Boston, MA (Humid Continental), Sacramento, CA (Mediterranean), Phoenix, AZ (Desert), New Orleans, LA (Humid Subtropical) and Hilo, HI (Tropical). [13]. The results indicated that PBRs indeed overheat in warmer seasons and reach low temperatures concerning air temperature in the colder seasons.
Some methods can be used for temperature control at photobioreactors such as water sprays or submersion in swimming pools [10]. Infrared cut-off filters to block some of the thermal radiation on the photobioreactors have already been tested [14]. Although efficient, these techniques increase the operating costs of photobioreactors. An alternative to reduce the costs of photobioreactors temperature control is to integrate them into building facades [10].
This integration proposal was revealed for the first time in 2011 on the BIQ (Bio-Intelligent Quotient) House in Hamburg, Germany, as the only building design to be built with these systems on the façade. The concept of this integration is to use the extra heat from PBRs on building demand, either for water heating or for heating indoor spaces [10, 12, 15]. The operation of photobioreactors is shown in Figure 1[16].
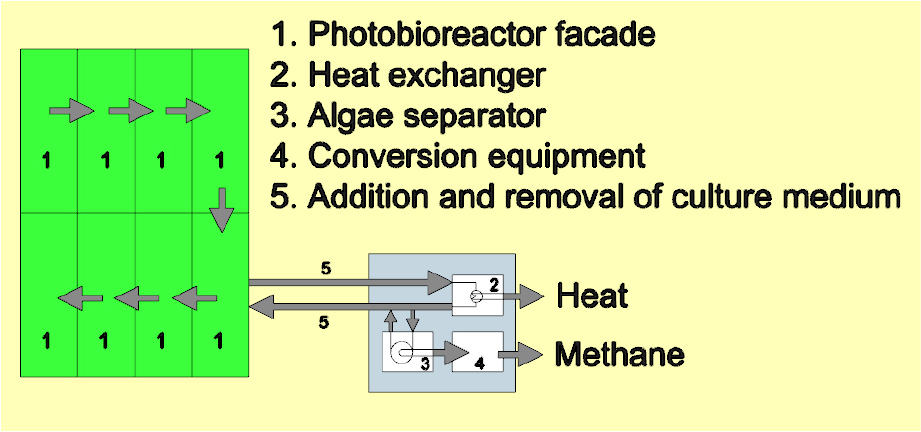
Figure 1.
Operation details of photobioreactors integrated into a building’s facade. Adapted from [16].
The cultivation of microalgae (aqueous solution of microalgae) circulates through photobioreactors connected in series (1). When photobioreactors overheat or when there is a building demand for heat, the cultivation passes through a heat exchanger, and the thermal energy of the cultivation is used by a heat pump (2). The heat pump removes thermal energy from the cold source (PBRs between 20 and 35°C) and transfers thermal energy to the hot source (hot water storage system between 55 and 60°C) [9, 12, 15, 16].
After passing through the heat exchanger, the cultivation is transported to the algae separator where the biomass will be separated from the aqueous solution (culture of microalgae) and filtered by the flotation process (3). The filtered biomass in the building service center is collected and converted into biogas (CH4) in a mini-biogas plant external to the building (4). After filtration, the cultivation returns to photobioreactors (5). Biogas is burned, producing electricity, and CO2 resulting from combustion is used to feed photobioreactors via saturation. The heat captured from the culture can be used for heating water or by the HVAC system [9, 12, 15, 16].
The results of [12] indicated that 59% of the building’s annual energy demand for heating was supplied by the algae façade at BIQ House. The White Paper developed by [16] detailed the energy production of PBRs at BIQ House. Algae biomass is burned for the production of methane biogas (CH4). Net energy as methane corresponds to approximately 4,540 kWh/year and net energy as heat is 6,000 kWh/year for 200 m2 of photobioreactors.
In a pilot project [17], the thermal behavior of a microalgae façade (SymBiO2-Box, Nantes, France) was evaluated through numerical simulation and compared with measurement data. The cooling need for the photobioreactors was highlighted. Thus, the authors developed a ventilation system that uses natural air wind to cool the surface of the PBRs.
BIQ House and SymBiO2-Box consider the photobioreactor positioned on the vertical façade of a building. In this context, through numerical simulation, the present work aims at evaluating the thermal behavior of photobioreactors integrated into a building in Humid Subtropical climate zone, Brazil, based on the methodology of [13]. The photobioreactors, however, would be located on the building roof, so that they can be tilted and received the highest possible solar radiation.
Material and Methodology
An energy balance was carried out in photobioreactors based on the methodology of [13] to evaluate the thermal behavior of PBRs on the roof a building under Humid Sub-tropical climate. Some changes were performed to fit this reference to the case study details which are: (1) the photobioreactors slope relative to the horizontal plane, which changed the model configuration factors; (2) convection, [13] previously considered as natural, while the present study considered it forced; (3) and the software employed to calculate the energy balance, which was the Engineering Equation Solver (EES) in the present study, while [13] used the MATLAB.
The energy balance numerical simulation of PBRs integrated into a building allows estimating its thermal behavior under specific climatic conditions that can also be tested in other cities. By knowing the thermal behavior of photobioreactors, it is possible to pro-pose and estimate methods for cooling PBRs and add in extra heat to the building heating system before the development of its blueprints.
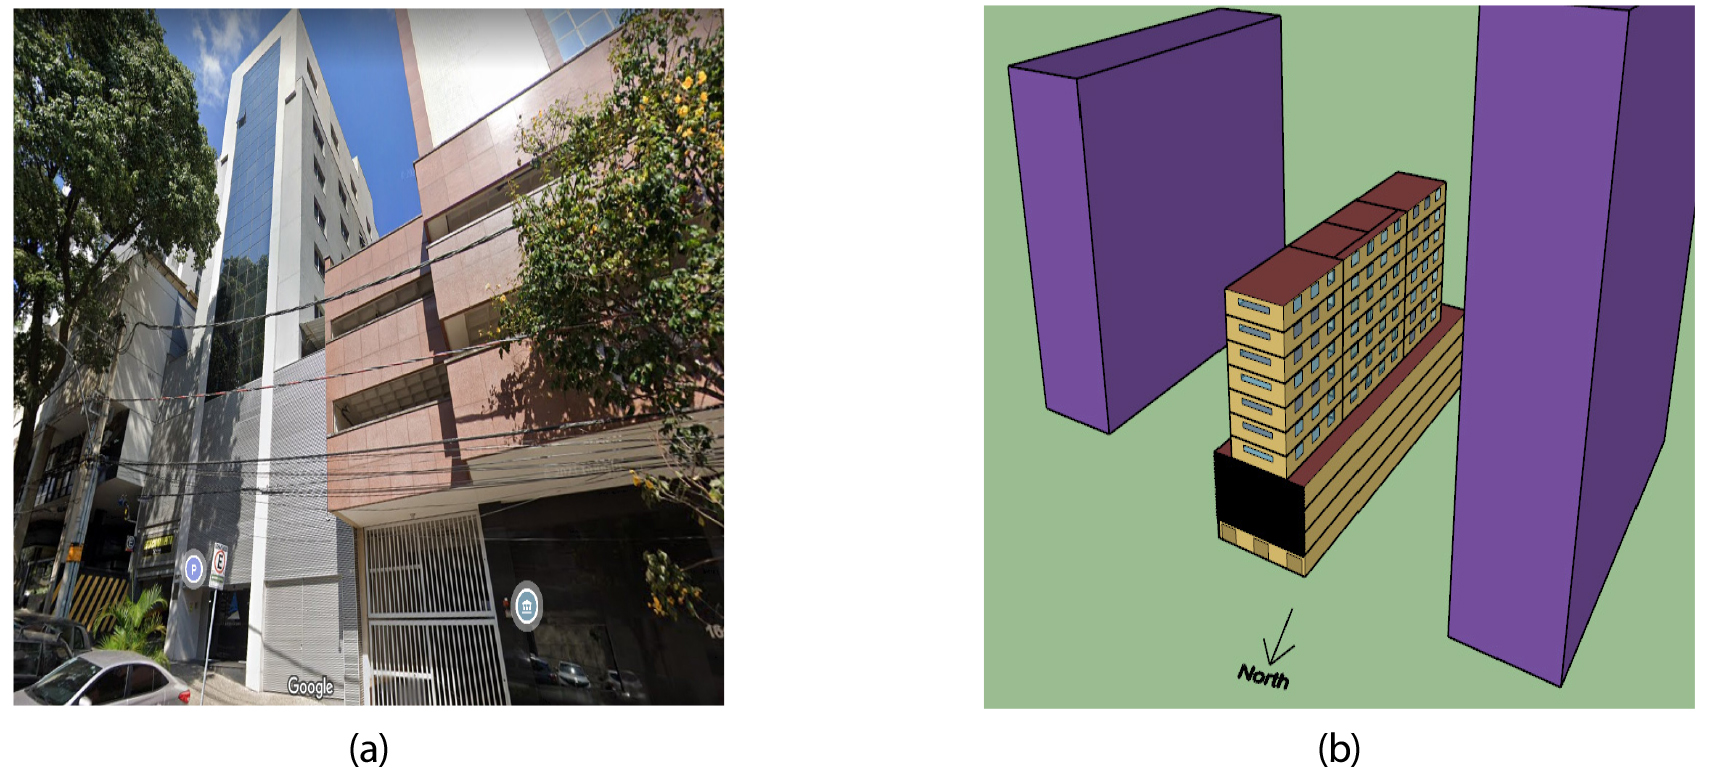
A commercial building tower located in the third largest Brazilian metropolis - Belo Horizonte - was selected for this study. The extra heat of the photobioreactors can be used by the building water heating system in a similar way to BIQ House, through heat ex-changers and a heat pump.
Materials
A laptop computer running on Windows 11 system, processor 11th Gen Intel(R) Core (TM) i5-1135G7 @ 2.40 GHz - 2.42 GHz, 8 gigabytes of DDR4 type RAM, 256 gigabyte SSD and NVIDIA GeForce MX330 video card was used for gathering bibliographic references and emule the thermoenergetic conditions of a building model and photobioreactors.
The SketchUp make version 2017 was employed for 3D geometry creation of the building architectural model, and the EnergyPlus version 9.3 simulated the thermoenergetic conditions of the 3D model. Euclid extension linked the 3D model data to the thermoenergetic input model. Besides, EES calculated the energy balance in PBRs, and Microsoft Excel 2019 organized the output data obtained.
The Solar and Wind Energy Resource Assessment (SWERA)1) was used as input to characterize the local climatic conditions in which the reference was located. The building data concerning its design characteristics and operation required to create and calibrate the thermoenergetic model was provided by the company that owns the building.
Description of the thermoenergetic model of the building
The building selected as a reference consists of an eleven-floor commercial building located in the downtown area of Belo Horizonte, Brazil. The thermoenergetic model was set up likewise to the existing building concerning volumetry, solar orientation, materials, building components, and openings.
The roof area was the place in which the photobioreactors were modeled, comprising 478 m2. A building image and a termoenergetic model example are shown in Figure 2 (a) and (b), respectively.
Configuration factors (F) setting
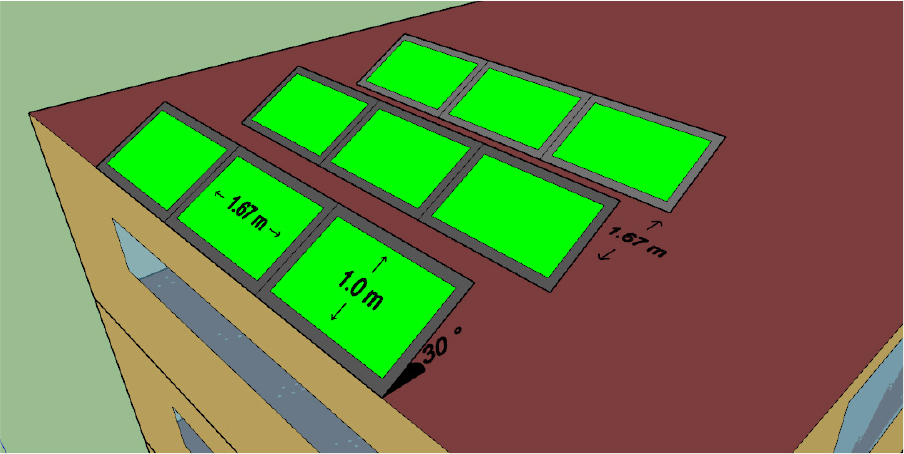
The photobioreactors location on the building roof is intended to allow as much sunlight as possible in PBRs, as if they were solar panels. Therefore, the ABNT NBR 15569 (2021) [19] standard was used, referring to the design and installation requirements of a solar water heating system for buildings in Brazil, to assist in the definition, orientation, and positioning of the photobioreactors.
Therefore, the photobioreactors must be inclined at 30° considering the horizontal plane. The slope of solar panels should be the sum of the latitude (20° for the city of Belo Horizonte) plus 10°. The PBRs were positioned 15° clockwise from the north axis, respecting the 30° limit established by the standard [19].
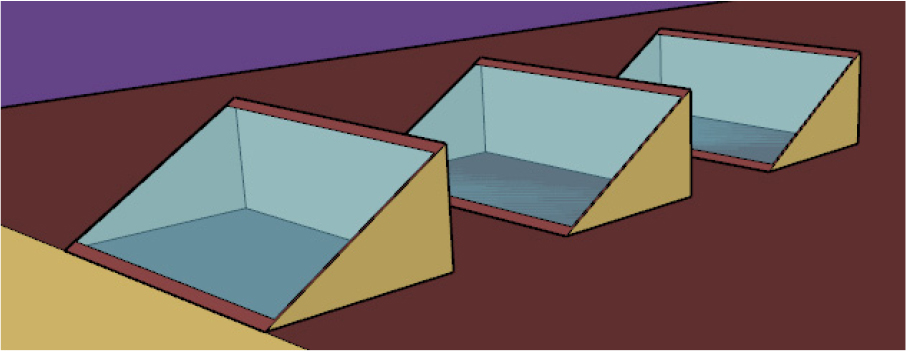
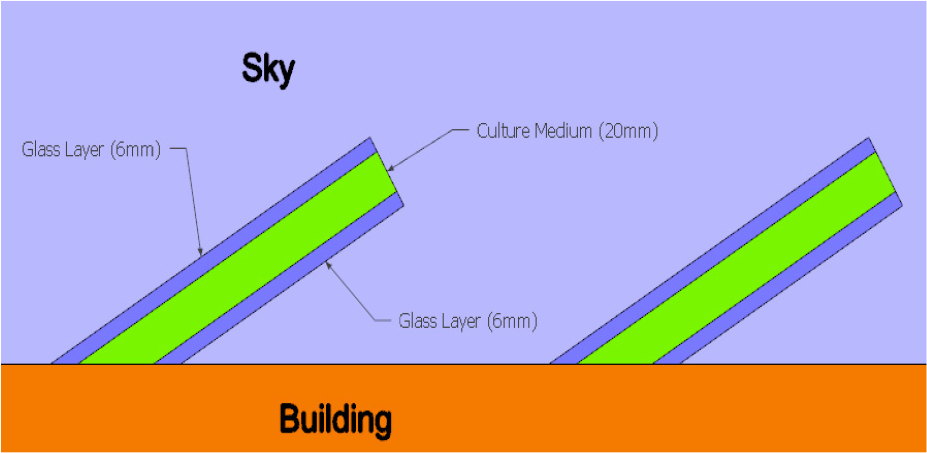
The modeled PBRs consist of glass panels 1.67 m wide (L) and 1.0 m length (H). The distance (D) between panels is 1.67 m. Its position and these measures are shown in Figure 3. Two layers of CEBRACE COOL-LITE ST 167 glass, 6 mm thick, and a 20 mm hollow body between each were considered for the PBRs layers (See Figure 4).
The dimensions choice is related to the configuration factors setting. Configuration factors (F) can be understood as the fraction of radiation that leaves one surface and is intercepted by the other surface [20]. The reference [21] sets configuration factors for several surfaces.
For the present research, two photobioreactors, one in front of the other, can be seen as two surfaces that emit and reflect radiation. The area between two photobioreactors delimited by the width of the PBR on the roof and on top of each panel form two other surfaces that emit and reflect radiation. Then, an can be defined for each surface, where m is the surface emitting or reflecting radiation and n, the surface receiving the radiation. In Figure 5, the configuration of the considered surfaces and the established configuration factors are represented.
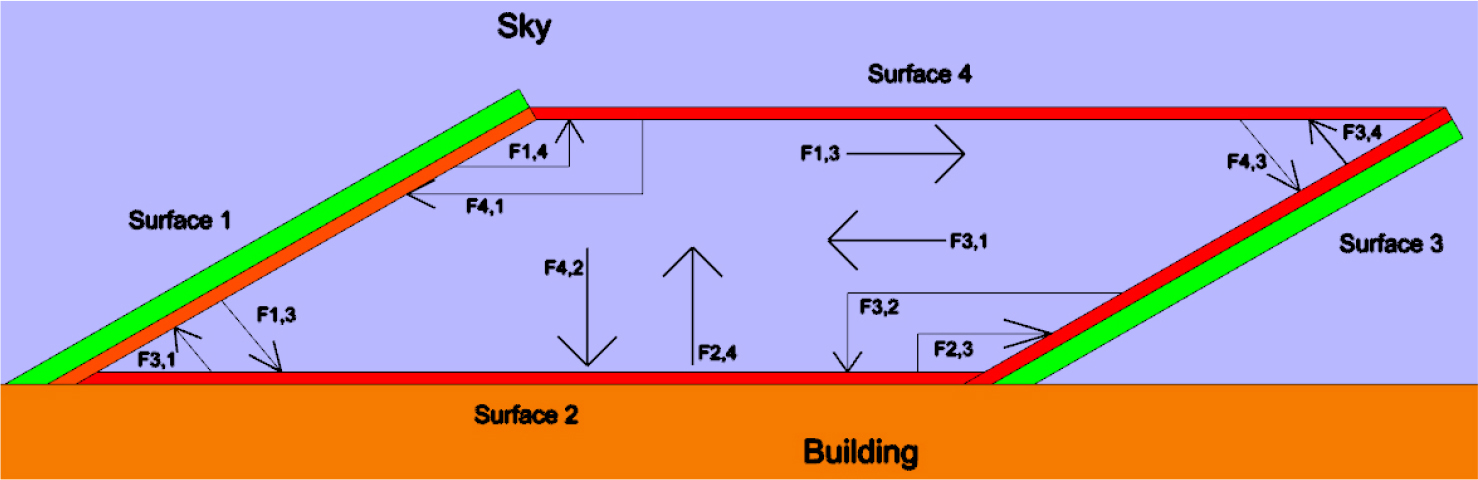
A photobioreactor was considered as Surface 1 and the PBR behind it was defined as Surface 3. The area delimited by the photobioreactors on the roof is Surface 2, while Surface 4 is the upper area delimited by the PBRs. According to Figure 4, the angle between Surface 1 and 2 is 30°. So, the angle between Surfaces 3 and 4 is also 30°, and the angle between Surfaces 2 and 3 and between Surfaces 1 and 4 is 150°. Such surfaces can be considered as rectangles with one common edge and included angle. For this configuration, the reference [22] establishes Equations 1 and 2 to define the factors F2,1 and F2,3 through coefficients A and B:
For values of = 1.0 m, 1.67 m, 0.6, and 1.0. The reference [22] presents tables with different combinations of A and B for different angles between surfaces to define configuration factors. To facilitate the calculations, the dimensions of the photobioreactor () were defined in order to obtain values of and that generated a combination present in the tables of [22].
For an angle of 30° between surfaces 1 and 2, it can be stated that = 0.452. Similarly, = . For an angle of 150° between surfaces 2 and 3, = 0.017. Similarly, [22]. According to the reciprocity relation between configuration factors, and can be defined through Equations 3 and 4, respectively:
which is the area of Surface 1 and is the area of Surface 4. Similarly, it can be concluded that and . By the summation rule, and can be calculated through Equations 5 and 6:
Similarly, and . In Appendix A the values of the obtained configuration factors are presented.
Energy balance in photobioreactor
The evaluation of the thermal behavior of the photobioreactor was based on the limit and optimal temperatures for cultivation. The microalgae species considered in this work is Chlorella Vulgaris. The optimum range for the cultivation of C. Vulgaris varies between 25 and 30°C, and the optimal point is 28°C [23, 24, 25]. In this work, an optimal temperature of 28°C was considered.
Regarding the upper and lower temperature limits, the reference [12] stated that C.Vulgaris presents a good growth rate in the temperature range between 20°C and 35°C. Thus, the present work defined the lower temperature limit at 20°C and the upper limit at 35°C. The energy balance developed by [13] was used as a reference. Figure 6 presents a schematic illustration of the heat rates acting in the photobioreactor.
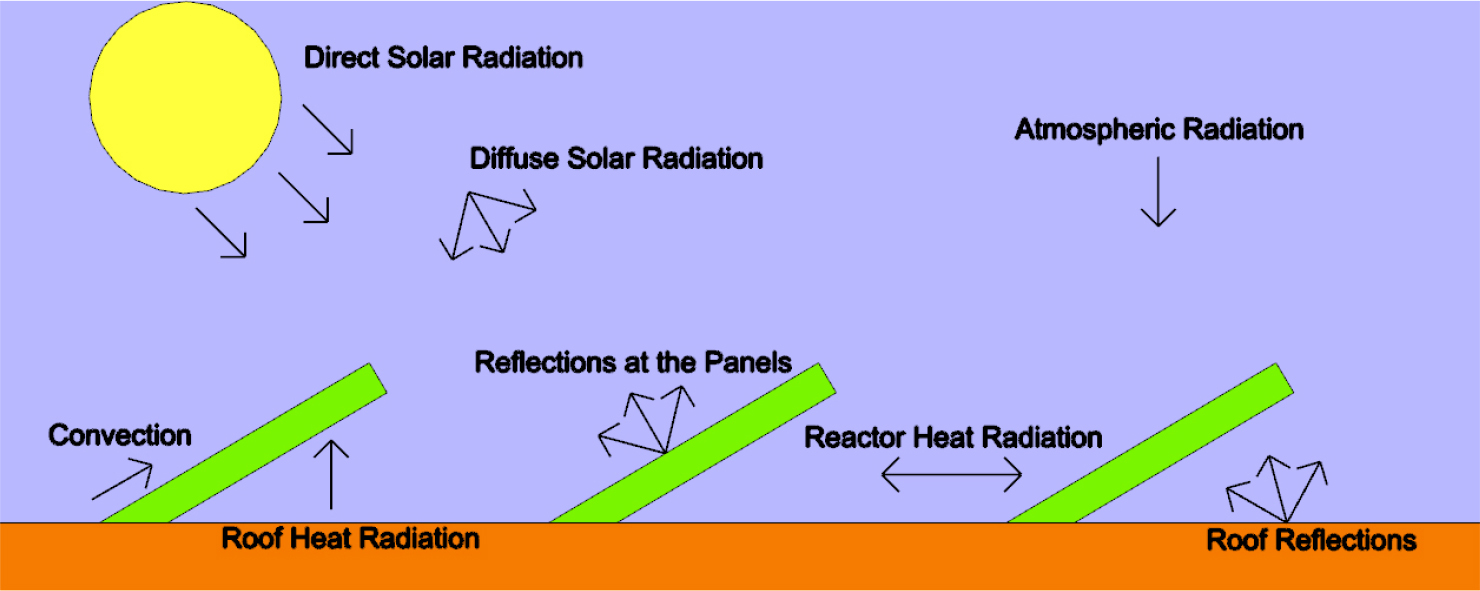
The heat rates represented in Figure 6 can be described as:
∙Direct solar radiation (DIR): Radiation that has not scattered in the atmosphere [25]. Acts only on the surface of the PBR exposed to direct solar radiation;
∙Diffuse solar radiation (DIF): Radiation that has scattered in the atmosphere [26]. Acts on both surfaces of the PBR, as well as all the thermal rates described below. Heat rates at the edges of the photobioreactor were not considered;
∙Atmospheric infrared radiation (ATM): Infrared thermal radiation emitted by the atmosphere;
∙Thermal radiation from photobioreactor (REA): Photobioreactors emit radiation to other PBRs;
∙Thermal radiation from the roof (R): Thermal radiation emitted by the roof of the building;
∙Radiation from reflections (ƩREF): The roof and photobioreactors reflect the radiations described so far and emit the reflected radiation to other PBRs;
∙Convection (CON): Photobioreactors lose or gain heat due to convection caused by the air. If the photobioreactor temperature is higher than the air temperature, the PBRs lose heat. When the temperature of the photobioreactor is lower than the air temperature, the photobioreactor gains heat. In this work, forced convection was considered, as the photobioreactors are 10 m above ground level and there is a convective effect of the wind [13].
In Equation 7, the energy balance in the photobioreactor is represented:
where is the volume of the photobioreactor, is the specific heat of the culture, is the density of the microalgae culture, and is the temperature difference in the time interval . The time interval considered was 600 seconds (10 minutes). In Appendix B, the description of each thermal rate described in this section is presented, as well as the values of .
Temperature control
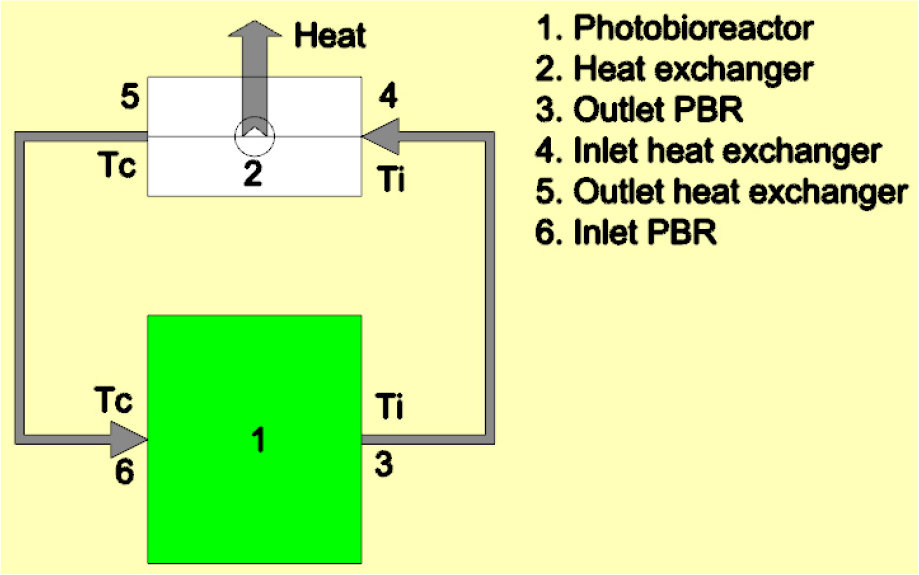
The adoption of PBRs to assist a building’s heating system, as in the BIQ House, is complex, as reported in section 1. The BIQ House concept requires sensor- based control systems and computerized techniques that coordinate the PBRs and a heat pump. This research focused on the temperature control of the photobioreactor, more specifically, on the relationship between the mass flow in and out of the culture in the PBR with the inlet temperature of the culture in the photobioreactor.
An inlet and outlet volumetric flow of 0.016 L s-1 (or 0.000016 m3 s-1) was considered in each PBR; the same flow rate as the BIQ House photobioreactors [12]. The analysis was performed keeping the volumetric flow rate fixed and varying the temperature of the culture at the exit of the heat exchanger (), which is equal to the inlet temperature of the culture in the photobioreactor. Thus, the energy balance in this new control volume differs from that presented in Equation 7 because it contains a new term on the right side of the equation. This term is , where is the inlet and outlet volumetric flow of 0.016 L s-1 and TC is the inlet temperature of the culture in the PBR, which is equal to the outlet temperature in the heat exchanger, and is the outlet temperature of the culture in the PBR. In Figure 7 is represented a schematic of the temperature control.
Result and Discussions
In this section, the results related to the energy balance in the photobioreactor are presented. The thermal behavior of the PBR and the analysis of the thermal rates that influence the thermal behavior of the system are discussed. Finally, it is introduced the possibility to control the temperature of the photobioreactor.
Photobioreactor thermal behavior
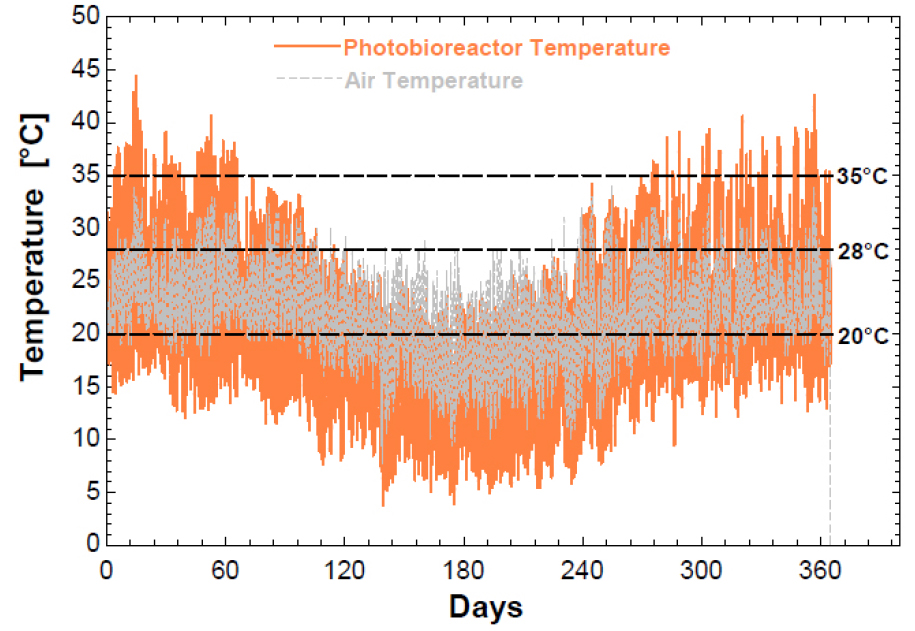
An energy balance to evaluate the annual baseline temperature in a photobioreactor on the building roof of a thermoenergetic model was performed. In Figure 8 the annual thermal behavior of the PBR is presented. The outdoor temperature and the upper (35°C), optimal (28°C), and lower (20°C) temperature limits for the cultivation of Chlorella Vulgaris microalgae are also presented.
The photobioreactor provided temperatures above the upper limit during the summer and spring seasons, which are the hottest seasons of the year for southeastern Brazil. During this period, the temperature of the photobioreactor can exceed the outdoor temperature by between 5 and 10°C. Temperatures close to the upper limit were also reached in early autumn and late winter.
Also, according to Figure 8, in the coldest periods of the year, late autumn and winter, the photobioreactor temperature remains in the range between the lower and optimal limits. It is noteworthy that temperatures below the lower limit are reached in all seasons of the year; such behavior commonly occurs during the night period, when there is no incidence of solar radiation and, consequently, there is no photosynthesis. On colder days, temperatures below 20°C can occur during the morning. To emphasize this behavior, in Figure 9 the thermal profile of the photobioreactor for the days 12/21 (a), 03/20 (b), 06/21 (c) and 09/23 (d) are presented - each day for each solstice and equinox.
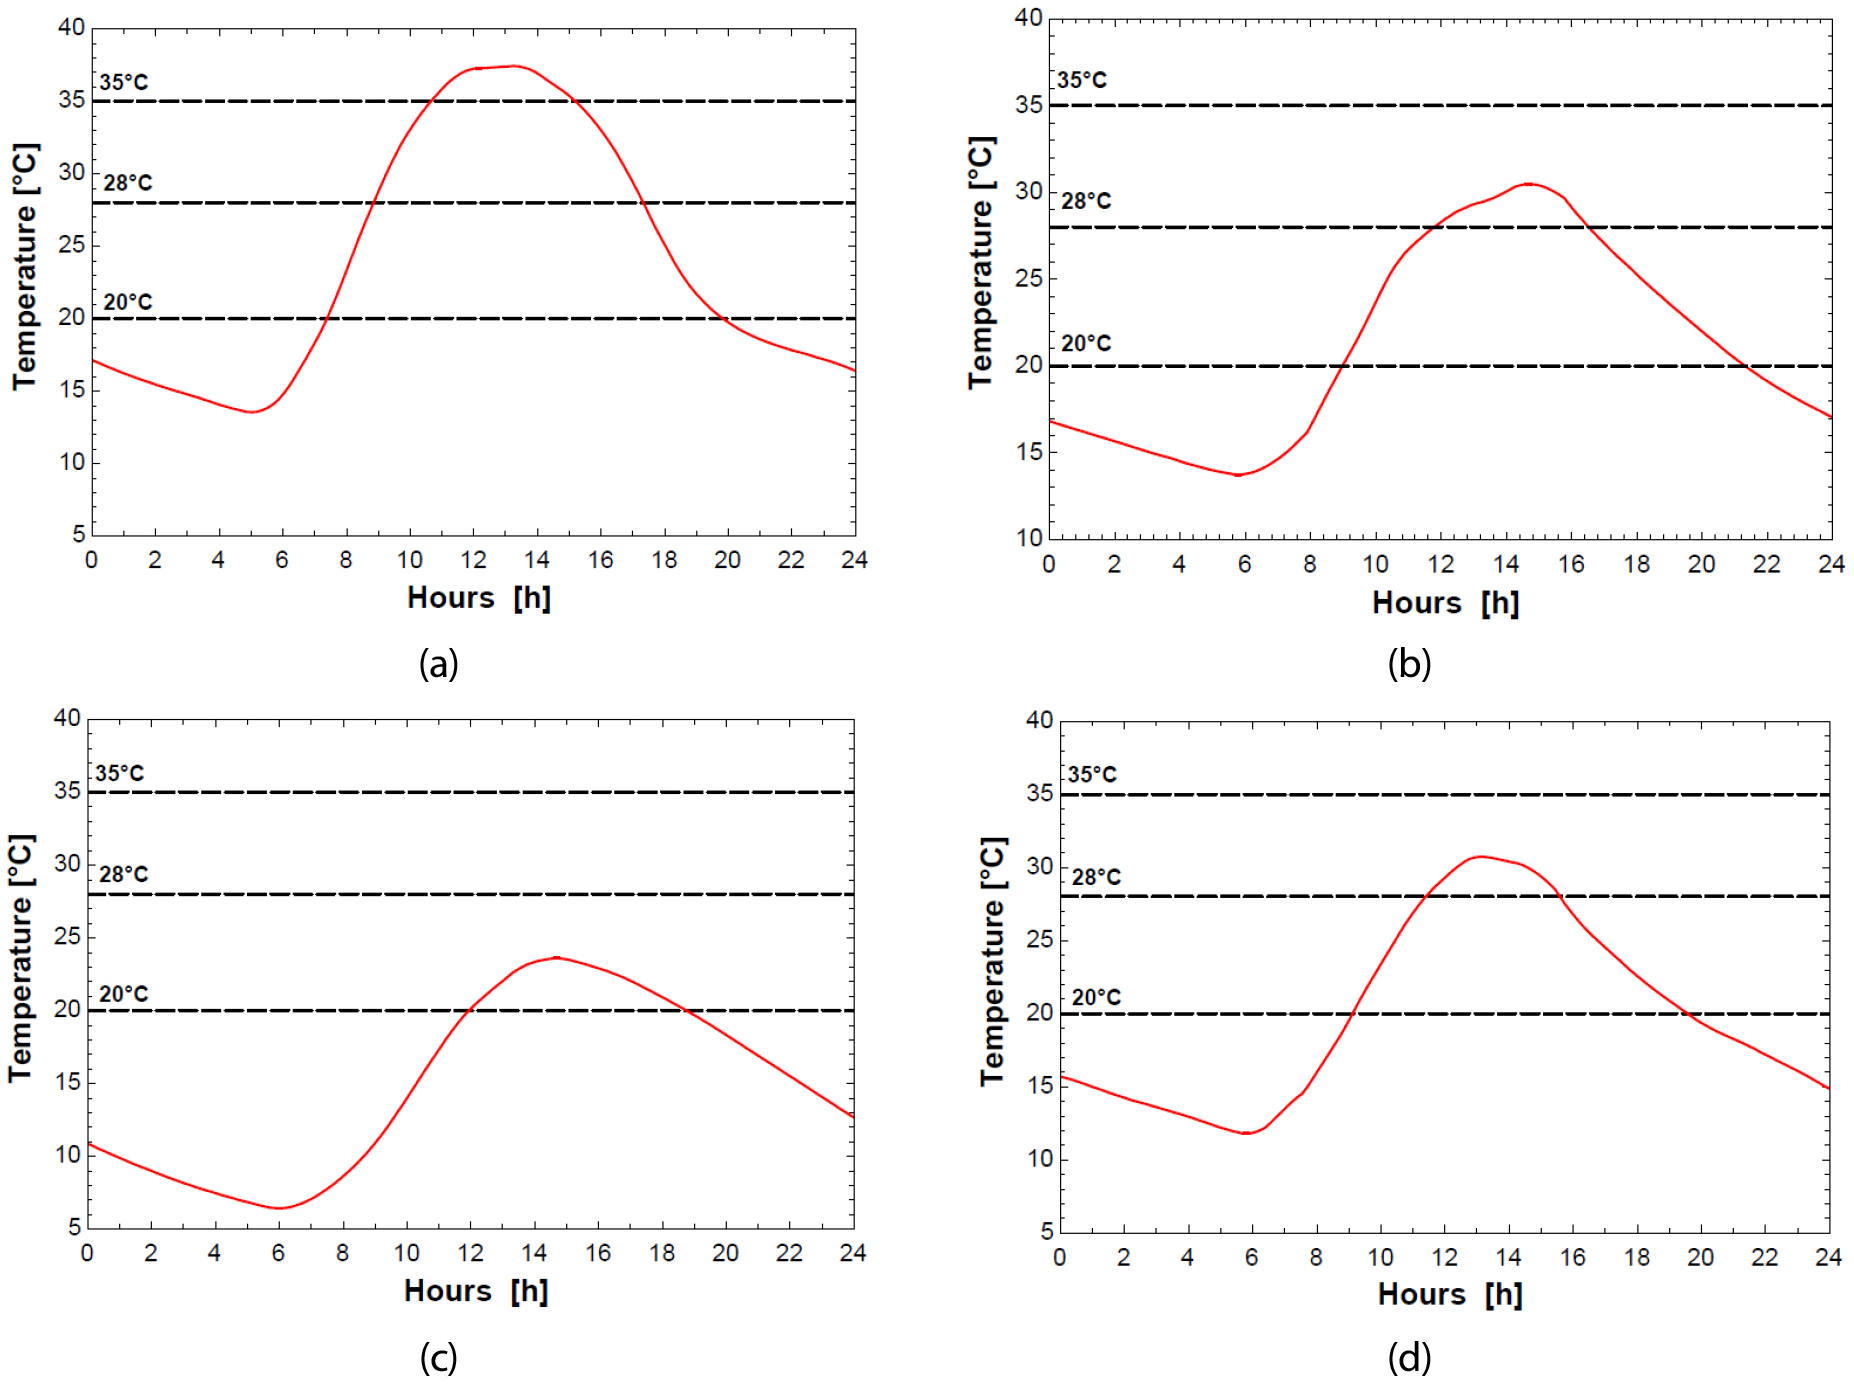
One day was chosen solstice and equinox to highlight the thermal profile of the PBR over a full day. As informed in the previous paragraph, temperatures lower than 20°C occur during the night period, and during the morning on colder days. During the day, the photobioreactor heats up, reaching maximum temperatures during the afternoon. This oscillation of the PBR temperature throughout the day is related to the oscillation of the heat rates that affect the PBR; such heat rates will be detailed in the next section.
Heat rates in the photobioreactor
The thermal rates in the photobioreactor for the summer, autumn, winter and spring seasons are shown in Figure 10. For each season, a complete day was chosen for analysis.
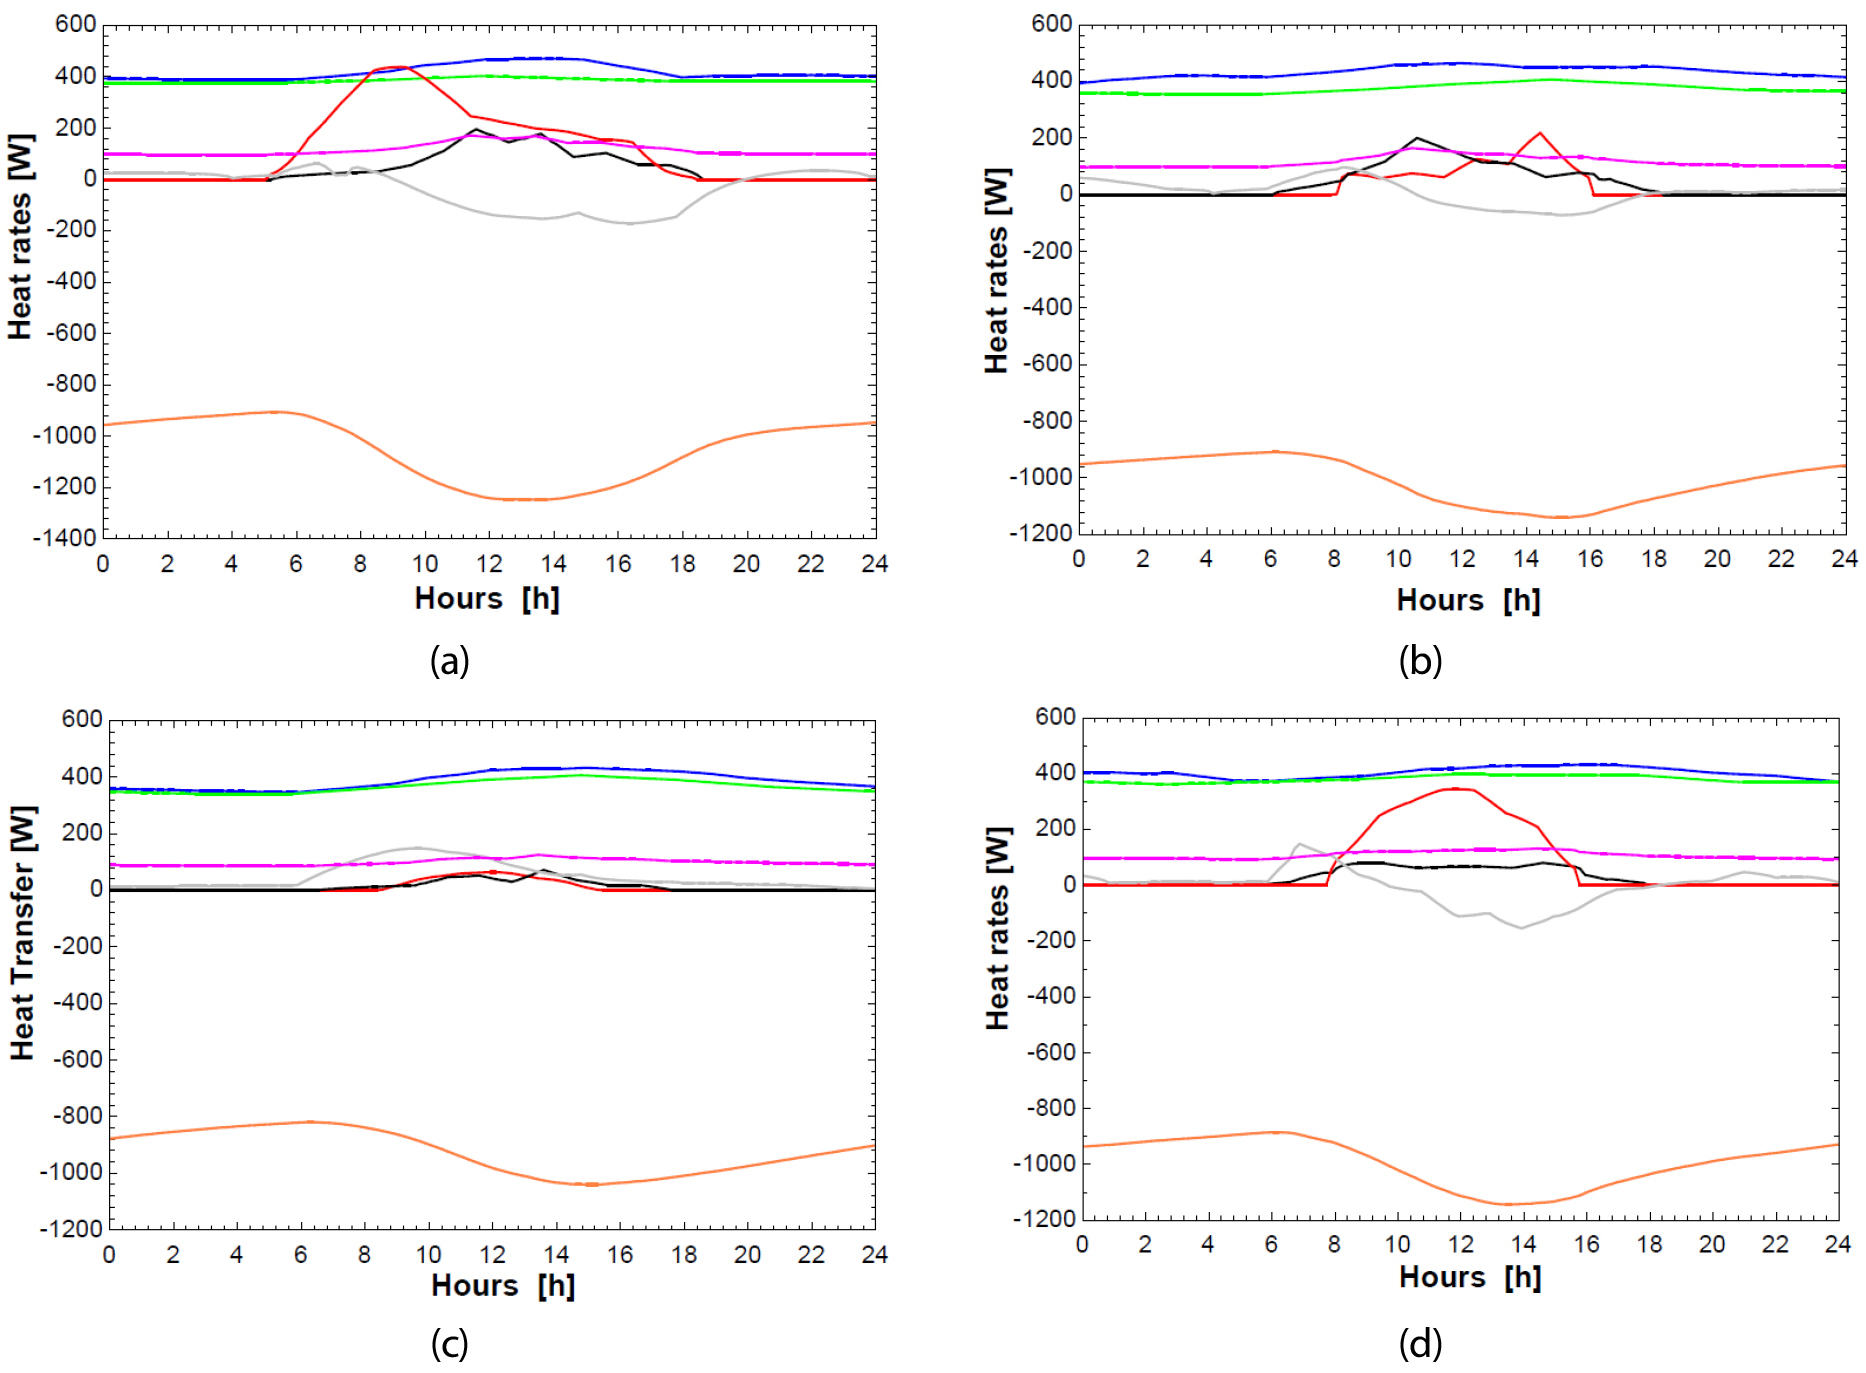
Figure 10.
Heat rates in the PBR for the seasons: (a) Summer (12/21); (b) Autumn (03/20); (c) Winter (06/21); (d) Spring (09/22). Description: (—) Atmospheric infrared radiation; (—) Thermal radiation from the roof; (—) Direct solar radiation; (—) Diffuse solar radiation; (—) Convection; (—) Radiation from reflections; (—) Thermal radiation from the photobioreactor.
It can be seen in Figure 10 that the radiation heat loss by the photobioreactor itself is high compared to the other thermal rates. This heat loss intensifies when the photobioreactor reaches its temperature peak; and, after the incidence of solar radiation (direct and indirect), the loss of heat by radiation causes the PBR to reach a temperature below the lower limit during the night.
Also at night, temperatures lower than the air temperature are reached. At night there are basically four thermal rates, heat loss by radiation, radiation from the atmosphere. roof radiation and reflections. Radiant heat loss by the photobioreactor is greater than the sum of the other three thermal rates, which may explain the low temperatures at night.
Also, according to Figure 10, during the day, solar radiation, especially direct radiation, heats the photobioreactor, resulting in temperatures higher than the outdoor temperature in the hottest periods of the year. It is also noteworthy that the rate of heat related to radiation from the atmosphere, radiation emitted by the roof and the thermal rate due to reflections are relevant for heating the PBR.
The heat rate due to convection is important to reduce the temperature of the photobioreactor in warmer periods of the year; in colder periods, when the air temperature is higher than the temperature of the PBR, as in winter, convection contributed to the heating of the photobioreactor.
Discussion
Modeled photobioreactors experience temperature variations throughout the year. In the hottest times of the year, PBRs overheat, requiring cooling. In winter, milder temperatures mean that the photobioreactor does not reach temperatures above 25°C, and temperatures below 20°C may even occur in the morning.
Temperatures below 20°C in the morning during winter can result in a drop in biomass production, since only in the afternoon temperatures within the optimal range of cultivation would occur. At the BIQ House, for example, the PBRs are deactivated due to the harsh German winter [12]. According to the model presented in this article, there would be no need to deactivate the PBRs, however, a reduction in the production of biomass is expected during the winter due to the fact that only in the afternoon proper temperature conditions for cultivation occur.
For warmer periods, temperature control in the modeled PBR is necessary to remove extra heat from the microalgae cultivation. In this model, a heat exchanger could be used to reduce the temperature of the PBR, as in the BIQ House. Thus, such a heat exchanger could act as an evaporator for the heat pump that would transfer heat from the cold source (photobioreactor) to the hot source (hot water storage system).
Initially, three cases were defined for analysis of temperature control; when the photobioreactor reaches 35, 40, and 45°C maximum temperatures. For temperature control in the photobioreactor, was chosen a value of 20°C for the culture outlet temperature in the heat exchanger. The first situation to be analyzed was the case in which the PBR reaches a temperature of 35°C, the upper limit temperature for the microalgae Chlorella Vulgaris cultivation. Temperature control was started when the culture reached a temperature of 30°C. In Figure 11 the new temperature profile is presented.
In Figure 11 (a) a new temperature curve is represented when considering a cultivation flow rate in the PBR of 0.016 L s-1 with an inlet temperature of 20°C. In this new temperature profile, the photobioreactor temperature ranges between 24 and 26°C until around 17:00, when the temperature of the PBR drops due to the reduction of solar radiation on the photobioreactor. In order to bring the photobioreactor temperature closer to the optimal cultivation temperature (28°C), the culture temperature at the exit of the heat exchanger was changed to 22°C and, later, to 24°C. Through Figure 11(a), it can be seen that the inlet temperature in the photobioreactor raging between 22 and 24°C is able to bring the culture temperature closer to the optimal microalgae culture temperature.
Figure 11(b) shows the second case analyzed, when the photobioreactor reaches a maximum temperature of 40°C. From the analysis of Figure 11(b) it is noted that the inlet temperature of the culture in the PBR varying between 22 and 24°C is able to reduce the temperature of the PBR closer to the optimal temperature for cultivation when the photobioreactor is close to the range of 40°C. Then there is a drop in the temperature of the PBR. Therefore, it would be necessary to increase the inlet temperature of the culture in the photobioreactor to avoid a drop in the temperature of the PBR.
Finally, Figure 11(c) shows the third case analyzed, when the photobioreactor reaches a maximum temperature of 45°C. The behavior of the curves in Figure 11(c) shows that the inlet temperature of the culture in the PBR of 22°C can reduce the temperature of the photobioreactor closer to the temperature of 28°C, when the PBR reaches temperatures close to 45°C without temperature control.
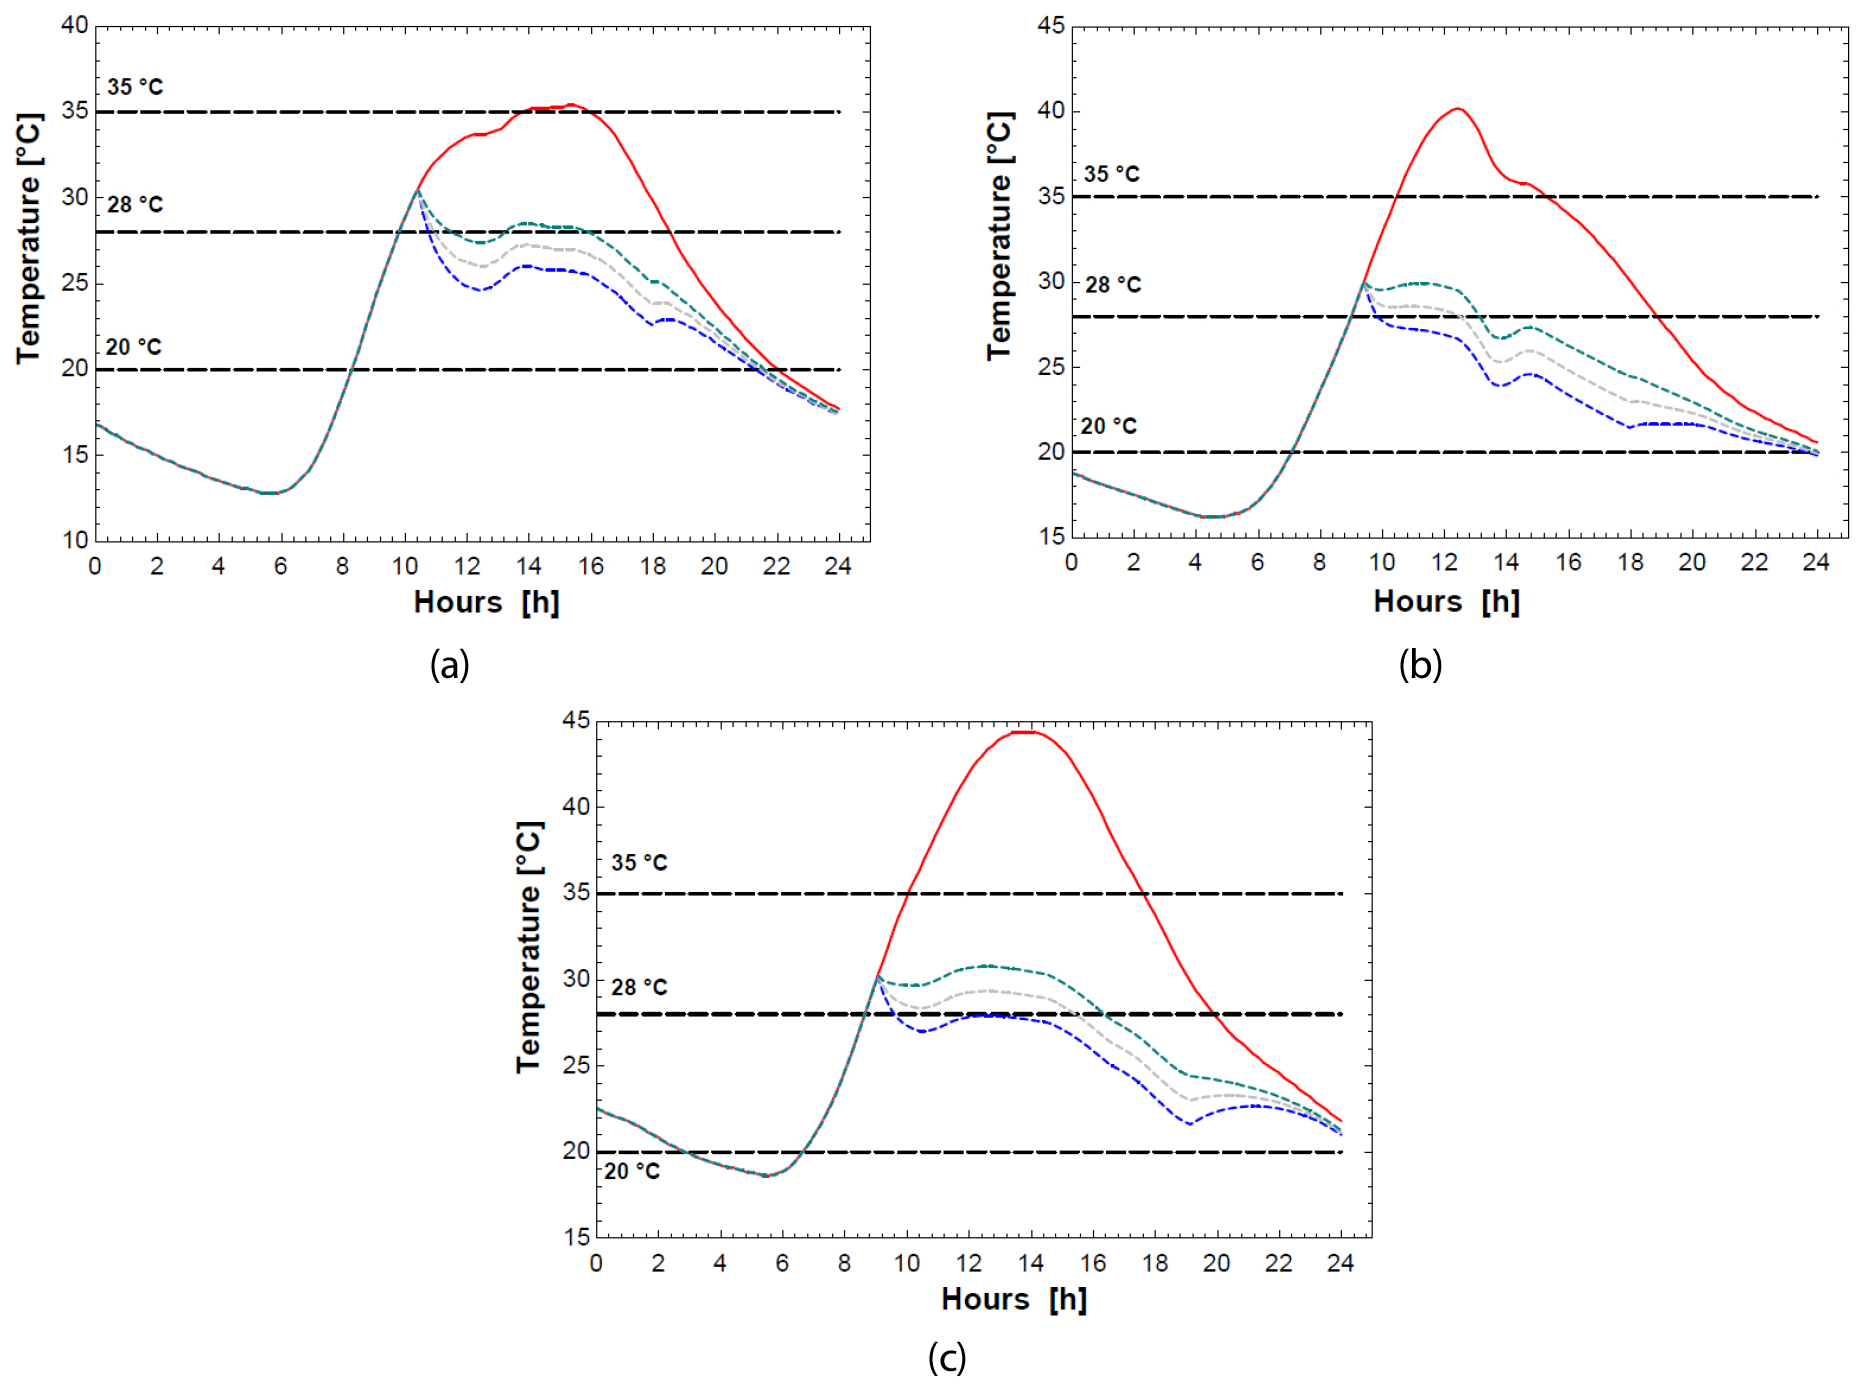
Figure 11.
Photobioreactor temperature control for days: (a) When the PBR reaches a maximum temperature of 35°C (02/05); (b) When the PBR reaches a maximum temperature of 40°C (01/17); (c) When the PBR reaches a maximum temperature of 45°C (01/15). Caption: Temperature control for TC = 20°C (---); For TC = 22°C (---); For TC = 24°C (---); Without temperature control (—).
Conclusions
Through an energy balance, it was possible to obtain the thermal behavior of a photobioreactor on the roof of a Brazilian commercial building under Humid Subtrpical climate conditions. The results indicate that the PBR experiences temperature variations throughout the year. In the hottest seasons, the photobioreactor overheats, requiring cooling. The extra heat could be transferred to a heat exchanger that would operate as an evaporator of a heat pump. Thus, this research presented an initial design as a possible alternative for temperature control in the photobioreactor. A volumetric flow rate was set and the temperature at the outlet of the heat exchanger was varied to bring the PBR temperature close to the optimal range for cultivation. Temperatures between 20 and 24°C were able to cool the photobioreactor for the established volumetric flow. This design allowed the temperature of the PBR to approach the optimal temperature range of 28°C in the hottest days when temperatures above 35°C are reached by the photobioreactor. Temperatures that are within the appropriate temperature range for microalgae cultivation (between 20 and 35°C) but that are above the optimum temperature range are reached frequently throughout the year. In order to conciliate biomass production and heat supply by PBR in other days of the year, cooling of the photobioreactor could be performed considering the same volumetric flow rate of cultivation in the heat exchanger and culture input temperature in the photobioreactor of 24°C. Based on the case when the photobioreactor reaches the temperature of 35°C, the resulting temperature is expected to be below 28°C. Future studies may assess the impact of temperatures below 28°C and above 24°C on the productivity of the photobioreactor and assess whether it is worth cooling the system to remove heat from the PBR under this condition. Future work may model a heat pump system and estimate the amount of heat that can be supplied to the building. Analyzes regarding the inclination of the photobioreactor panels, the thermal and optical properties of the system and studies regarding the pumping of water, nutrients and gases are also relevant, as well as other thermal rates that can influence the temperature in the FBR and were not analyzed by this work. These new research lenses can validate or indicate improvements in the methodology and results obtained in this article. A PBR prototype is also another proposal for future work for field results. The thermal profile presented by this research can serve as a basis for these proposals for future studies, as well as similar studies in another cities with similar climate conditions
Appendix B
In this Appendix, the equations for heat rates presented in section 2.3.2 are described in detail:
∙Direct solar radiation ():
∙Diffuse solar radiation ():
∙Atmospheric infrared radiation ():
∙Thermal radiation from photobioreactor ():
∙Thermal radiation from the roof ():
∙Radiation from reflections (Ʃ):
∙Reflection of diffuse solar radiation at the glass layer of the PBR ():
∙Reflection of diffuse solar radiation at PBR cultivation layer ():
∙Reflection of atmospheric radiation at photobioreactors ():
∙Thermal radiation emitted by a photobioreactor and reflected back by another PBR ():
∙Reflection of the roof radiation at neighboring photobioreactors ():
∙Reflection of diffuse solar radiation at the roof ():
∙Reflection of atmospheric radiation at the ground ():
∙Reflection of thermal radiation from photobioreactors at the roof ():
∙Convection ():
The equations presented here were used in the EES with Equation 7 to calculate the energy balance in the photobioreactor. With parametric tables in the EES, Ti values (PBR temperature) were returned every 10 minutes during all days of the year. The calculation was based on the Euler and Crank-Nicolson methods. The variables that characterize these equations are presented in Table 2.
Table 2.
Variables e constants used in the energy balance
| Symbols | Definition | Value | Reference |
| Microalgae cultivation albedo | 0.3 | [13] | |
| Roof albedo | 0.3 | [13] | |
| Photobioreactor surface area [m2] | 1.67 | - | |
| Specific heat of microalgae culture [J Kg-1 K-1] | 4181 | [13, 27] | |
| Distance between photobioreactors [m] | 1.67 | - | |
| Emissivity of the photobioreactor | 0.84 | [13] | |
| Emissivity of the roof | 0.95 | [13] | |
| Intensity of radiation emitted by the atmosphere1 [W m-2] | - | - | |
| Intensity of diffuse sunlight on the photobioreactor1 [W m-2] | - | - | |
| Intensity of direct sunlight on the photobioreactor1 [W m-2] | - | - | |
| Height of the photobioreactor [m] | 1.0 | - | |
| Forced convection coefficient on the photobioreactor surface1 [W K-1 m-2] | - | - | |
| Photobioreactor width [m] | 1.67 | - | |
| Volume of photobioreactor [m3] | 0.0534 | - | |
| Air temperature1 [K] | - | - | |
| Photobioreactor temperature1 [K] | - | - | |
| Roof temperature1 [K] | - | - | |
| Percentage of solar radiation transformed into chemical energy by the algae2 [%] | 1.5 | [13] | |
| Transmissivity of the photobioreactor glass layer related to the incidence of direct sunlight1 | - | - | |
| Transmissivity of the photobioreactor glass layer related to the incidence of diffuse sunlight1 | - | - | |
| 𝜏 | Thermal transmissibility of photobioreactor glass-1 | - | - |
| 𝜎 | Stefan-Boltzmann constant [W m-2 K-4] | 5.67(10-8) | [13] |
| Density of microalgae culture [Kg m-3] | 997 | [13, 27] |
The EES software was used to describe and calculate the energy balance. Energyplus was used to obtain data regarding the solar incidence on the glass layer of the photobio-reactor, as well as the transmittances and the convective coefficient of this surface. Air temperature and atmospheric radiation were also obtained using Energyplus. In order to obtain the values of these variables, thermal zones were created in the thermoenergetic model on the roof of the building with windows presenting the same dimensions, orienta-tion, and slope of the photobioreactors, as illustrated in Figure 12. Simulation was performed to obtain properties of the photobioreactor glass layer. Values throughout the year were considered for an interval of 10 minutes for all variables obtained through Energyplus. These values were introduced in the EES through the Parametric Table option. The other variables were obtained through searches of bibliographic references presented at fourth collum of Table 2.