

Introduction
Built Environment and Accessibility
Study Area
Space Syntax
Axial Map
Axial Line length
Connectivity
Integration
Axial Intelligibility
Axial Synergy
Empirical Study - Elements of Urban Morphology
Study Area
Quantitative Analysis - Integration Value of Streets
Quantitative Analysis – Connectivity Value of Streets
Mixed-Use Index of Streets
Traffic intensity
Comparative Analysis
Integration Values and Mixed-Use Index Values
Integration Values and Traffic Intensity Values
Connectivity Values and Mixed-Use Index Values
Connectivity and Traffic Intensity
Integration and Destination accessibility /distance to transitigher
Methodology
Quantifying Syntactic Properties of Street Network
Study Area 1- velachery
Study Area 2- Madipakkam
Study Area 3- Medavakkam
Study Area 4- Porur
Study Area 5 - Thiruvanmiyur
Results
Conclusion
Introduction
World urbanisation prospects of 2018 reveal that 55% of the world’s total population lives in urban areas, and it is predicted by the year 2050. It will increase exponentially to 68%. Urban areas should evaluate themselves in relation to a sustainable model, which includes a greater sense of community, mixed-use developments, higher population densities, improved public spaces, improved quality of life, and lower energy consumption [1]. The growth rate in the metropolitan area ultimately impacts the environment, irrespective of the town’s size and physical form. Poor urbanity through sprawled street networks makes the city accessible through mobility by consuming higher energy leading to an increased environmental carbon footprint. Street networks characterising disconnectedness shall be classified as network sprawl, leading to lower mixed-use and lower-density developments, thus demanding higher mobility. Cities of developing countries depend highly on non-renewable resources, particularly fossil fuels, for mobility, leading to carbon monoxide emissions. A well-integrated street network facilitates higher built environment density and a greater functional mix, thus encouraging walkability and public transportation, configuring a vital urbanity. This paper reveals the street networks of recently evolved residential neighbourhoods of Chennai, characterising Sprawl leading a poor urbanity due to the rapid pace of urbanisation.
Built Environment and Accessibility
Accessibility is the ability to reach destinations and transportation Accessibility is a means of linking our origin and goals, offering designs that facilitate multiple travel modes, reducing congestion, and building sustainable transport neighbourhoods [2]. Accessibility and mobility-friendliness are the prime strategies in recent urban theories and smart urban growth. Accessibility is the ease of ability to connect destinations. Measuring the distance engaged in travel is mobility [2]. Sprawl in street networks leads to the need for increased travel, and Street network configuration demanding Mobility curtails accessibility. Greater Connectivity achieves a greater level of Mixed-Use Building Typologies, where all the essentials within reach are accessible and require less mobility. For example, if a neighbourhood is mono-functional and basic errands are distant from the origin, the access to basic errands depends on the vehicle. In that situation, accessibility depends on mobility [3].
Urban Mobility is related to network topology due to the Potential interaction between the scale of the network and the potential Pattern of gravity regulating the mobility, connectivity, geometry, and group functions [4]. Higher densities (FSI) provide more potential for functions to be combined [5] Greater density-built Environment maximises the number of destinations with shorter distances by achieving a greater degree of the functional mix; hence density is positively related to accessibility [6] The variables that impact walkable Accessibility are Street network Design, density and mixed-use building typologies, the Design element being the most important among them [7], In addition to that, the recent trends add two more Dimensions to it, namely Destination accessibility and distance to transit [8]. The opportunity accessibility index and the infrastructure accessibility index, which take an infrastructure-based and a distance-based approach, respectively, to measure accessibility, have been developed as a result of recent studies that have helped to improve the accessibility evaluation process of metropolitan areas [9].
The development process is a progression where the urban environment transforms from an isolated location to a significant one. Transformation in the metropolitan area is according to the street network geometry comprising streets with high integration values influencing the Greater building density and a higher degree of mixed typologies [10]. The theory of the natural process of urban Transformation encompasses the associations between the efficiency of street networks, building density, and land use mix. The theory considers reinforcing the spatial elements of evolving modern urban designs to prevent low-density, mono-functional, segregated street patterns from lacking street life. In determining accessibility, street networks are considered a significant parameter. Street networks implicitly or explicitly affect growth and improvement. Street network performance is an observable quality by analysing through space syntax to quantify syntactic parameters. The assessment of street network effectiveness by space syntax is employed as a tool for Design and Urban planning projects.
Study Area
Chennai, a development based on the sea coast, evolved as a city originating from a port and experiences several urban issues. Understanding the morphology of Chennai, the city’s core areas witness a barrier to transforming into a vibrant urban setup in terms of achieving higher density and mixed land use. The developments could not cope with rapid population migration and led to the evolution of sprawl development in residential neighbourhoods surrounding the core areas. Such developments are dominating a debate about its configuration in terms of accessibility.
Analysing the proposed land use map of Chennai metropolitan development authority 2026, the Study areas reveal the associations between street network characteristics and mixed Residential zones, as only the adjacent land parcels abutting the streets of higher Axiality are classified under Mixed use zone, and the rest of the spaces are classified as mono-functional entities.
Moreover, these study areas characterise low-density developments predominantly and witness a rapid peripheral expansion. Street networks are the primary element of urban morphology. The configuration of street networks orders the natural processes of urban Transformation from mono-functional dull entities into vital neighbourhoods [10] Evaluating the efficiency of street network configuration in organically evolved urban areas is complicated. If street configurations facilitate effective travel for the people, the development is more liveable and sustainable. The research initiated the question of whether the recently evolved neighbourhood of cities characterises street-network Sprawl leading to accessibility issues.
The study reveals the configuration of street network characteristics of recently developed neighbourhoods of Chennai and assesses its development potential as a vibrant urban space in the future. The prime factor available to us is the street network topology to predict the urban character of tomorrow. Syntactical parameters such as Intelligibility, synergy, and Axiality reveal the efficiency of the street networks. The research aims to analyse the street network as a prime factor contributing to vital urbanity in terms of higher density, mixed-use Developments facilitating accessibility. Randomness is a common feature of the organic street network pattern. Quantifying geometric properties such as symmetry repetition, alignment, parallel elements, etc, is difficult. Thus ‘Space syntax’, a method that provides quantitative descriptions of street networks based on the topological aspects, is employed to understand the network topology. Inherent associations within the variables are identified by correlating each other to understand the efficiency of street networks.
Space Syntax
Space syntax is a phenomenon that understands spatial Organisation and its effectiveness by quantifiable Syntactic values by the topological distance within the Street network. It refers to the sum of turns required to reach from one location to another, replacing the metric [11] The space syntax emphasises that the movement trend in a city is likely to be shaped largely by the Topology of Its Street network on its own, independent of all other factors [12] The Depthmapx algorithm is employed to generate the syntactic values. The Syntactic parameters for analysing the spatial configuration of urban morphology are Connectivity, Integration, Intelligibility, and Synergy. Space syntax has contributed to a Concept of the natural movement of Economic processes, which claims that the street network topology influences traffic flow and economic Activity establishments [13].
Axial Map
The axial map is the primary map for studying the street network parameters. Axial lines are the sight lines (straight lines) that pass through each space; it is the distance at which the observer will provide an Unrestricted Sense of Visibility and permeability when they Pass across the city and aim in multiple directions. Axial line Maps are created as two-dimensional maps. Axial lines are graphically represented with hot colours for the higher values of the measure. In comparison, the ones represented with cold colours possess lower values. The Depthmap algorithm analyses axial maps and quantifies the following syntactic measures.
Axial Line length
‘Axial line length measures the metric length of axial lines [14].
Connectivity
‘Connectivity measures the number of spaces immediately connecting a space of origin’ [15] Connectivity values of an axial line quantify the number of lines that cross that given axial line. Thus, the Connectedness of space is represented as an axial space, which signifies the number of adjacent connected spaces in the neighbourhood. A positive correlation of Axial Lines with connectivity values indicates accessible and mobility-friendly street networks. Street networks characterise multiple numbers of cul-de-sacs in residential areas, and fewer connections represent low connectivity. The space is less connected to the surroundings [16].
Integration
An integrated street network facilitates Accessibility, Integration Value, a measure of how other spaces in the environment are integrated with the space in question. A global measure of the relationships between humans and the urban environment provides insight into the interactions between humans and urban space. ‘Integration usually indicates how many people are likely to be in a space and is thought to correspond to rates of social encounter and retail activities’ [17].
The street alignment and network configuration are the only parameters considered in constructing the system using graph theory. As axial lines intersect more and longer, they integrate more. Thus, the most integrated street segments require the least number of turns to reach other segments. Predictions of movement capacity often dispute a measurement of integration. Shortly, street integration shows the accessibility of one street segment to all other street segments within a defined area based on its Topology. ‘Axial global integration is defined as the integration values of axial lines at the infinite radius which can be used to represent a picture of integration pattern at the largest scale’ [17] ‘Axial local Integration is defined as integration values of axial lines at the radius 3 (root plus two topological steps from the root), which can be used to represent a localised picture of integration’ [17].
Axial Intelligibility
‘Axial intelligibility indexes the degree to which the number of immediate connections a line has is a reliable guide to the importance of that line in the system. It is a correlation between axial connectivity and global axial integration. A strong correlation, or “high intelligibility,” implies that the whole can be read from the parts’ [18] As a rule of thumb, the intelligibility correlation of urban areas is about 0.45. In contrast, the correlation of unintelligible systems is about 0.2 or even lower, where a value of 1 indicates strength, while a value of 0 indicates randomness [19]. It was argued that axial lines strongly influence intelligibility, which may explain why naturally grown cities become less intelligible as they grow larger. In contrast, gridded cities gain connectivity with longer lines [17].
Axial Synergy
‘Axial synergy is defined as the correlation between radius-3 and radius-n integration. It measures the degree to which the internal structure of an area relates to the larger-scale system in which it is embedded [17].
Empirical Study - Elements of Urban Morphology
Chennai is an organically evolved city with a lot of Diversity. An incredibly high population density in the city centre has led to congestion. A city with an extremely high population density is also experiencing hasty but low density and Sprawl. Hence, for the study, the recently developed top five residential neighbourhoods based on consumer preferences of Chennai city are considered. They can be analysed as a system of spaces using Depthmapx, an analysis of axial maps. The Detailed method of analysis is demonstrated for a single study area.
Study Area
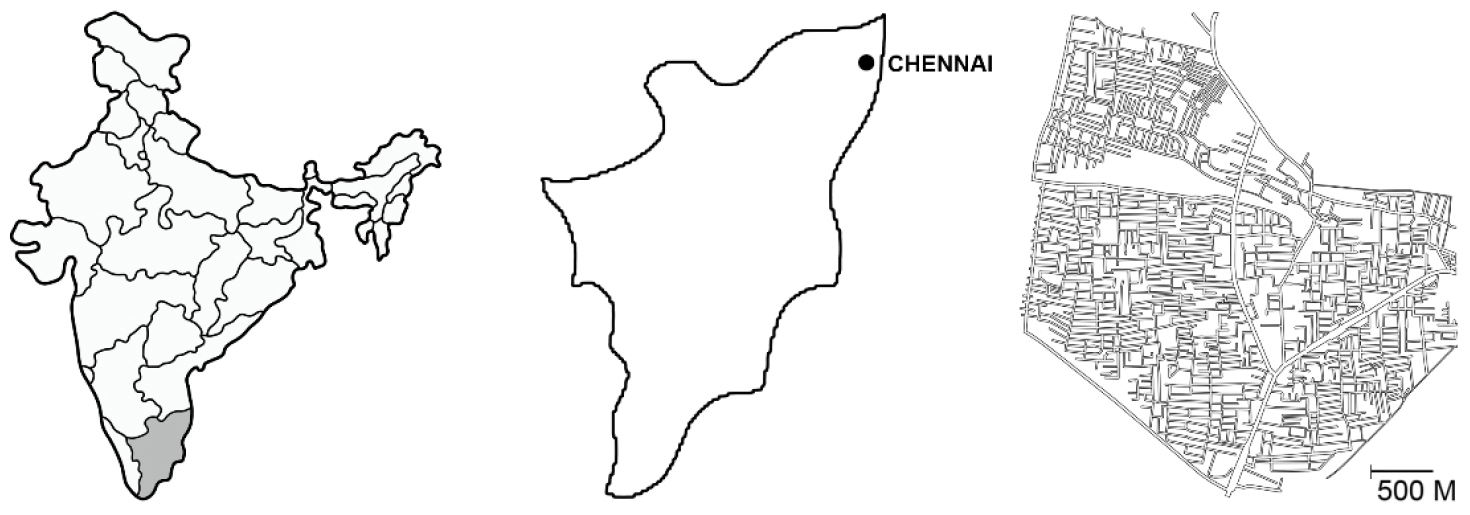
Velachery is a residential neighbourhood in the southern part of Chennai, Tamil Nādu state, India (Figure 1). Over a decade of community development can be witnessed due to the growth of the Information technology sector in the southern part of Chennai. It is a significant hub connecting the More developed and well-connected roads and the city’s central business districts to the increasingly developing business-class IT corridor. Velachery marks a fine harmony between the old and modern Chennai and witnesses growth and development.
Design density and Diversity are the three key elements of urban accessibility [5] Understanding the relationships between the elements of morphology concerning the Topology of the street network, Mixed-use Index of Streets, and Traffic intensity reveals the impacts of network sprawl over the development. The Topology of the street network decided by an authority, individual, or community dictates the Development potential of the Urban place. It influences the transformation process of converting dull mono-functional entities into vital urban areas. Street Network configuration measured by the space syntax algorithm inferring the values of Connectivity, Integration reveals the geometrical properties, and understanding the impact of it on the Mixed-use index and traffic intensity is essential.
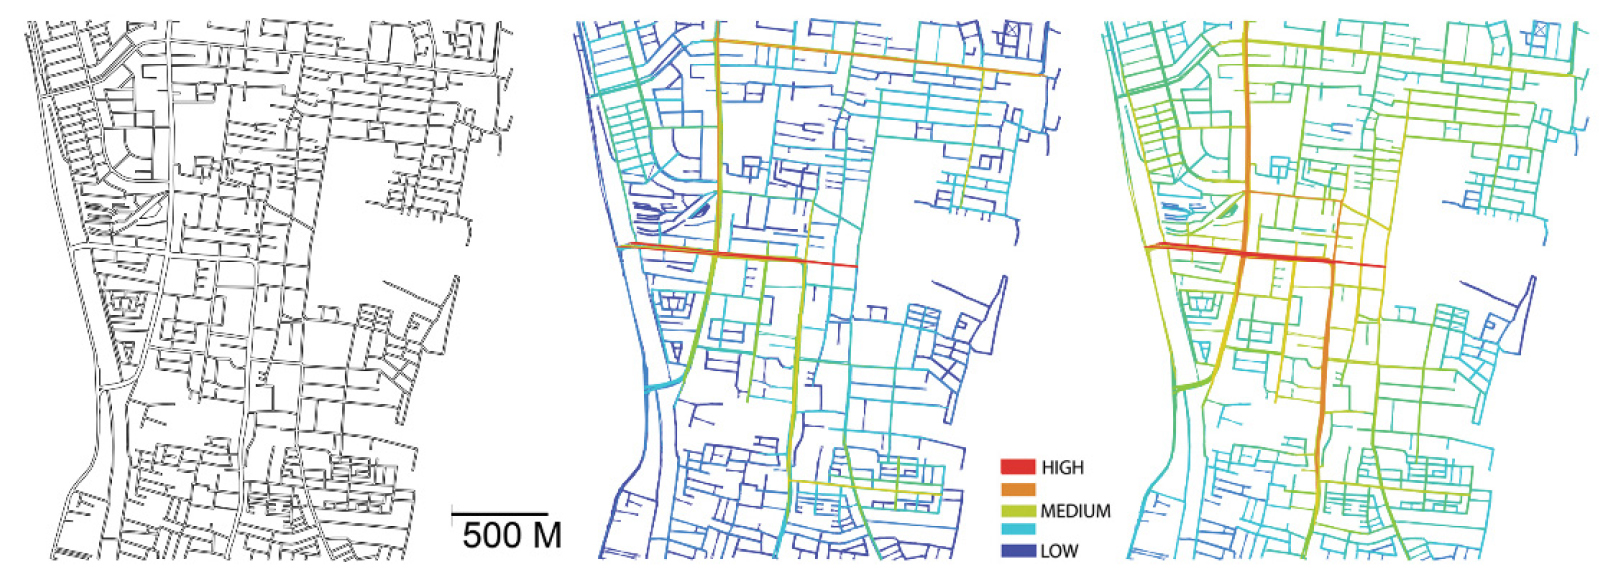
Quantitative Analysis - Integration Value of Streets
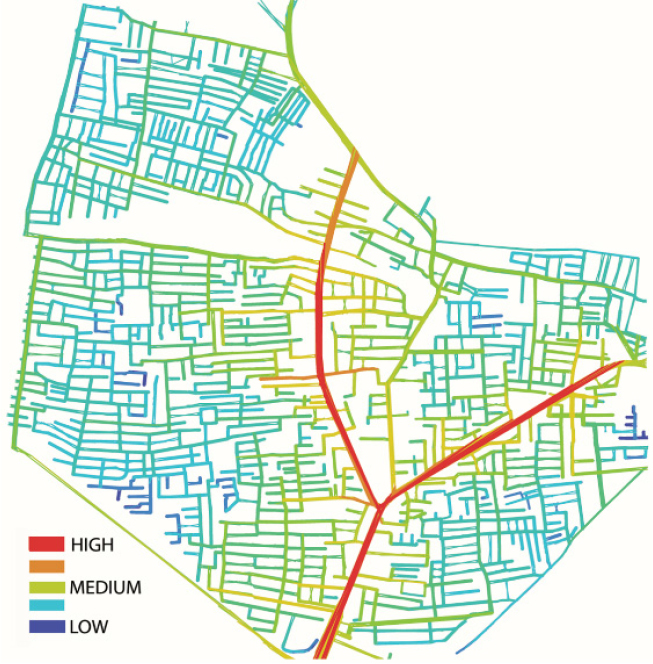
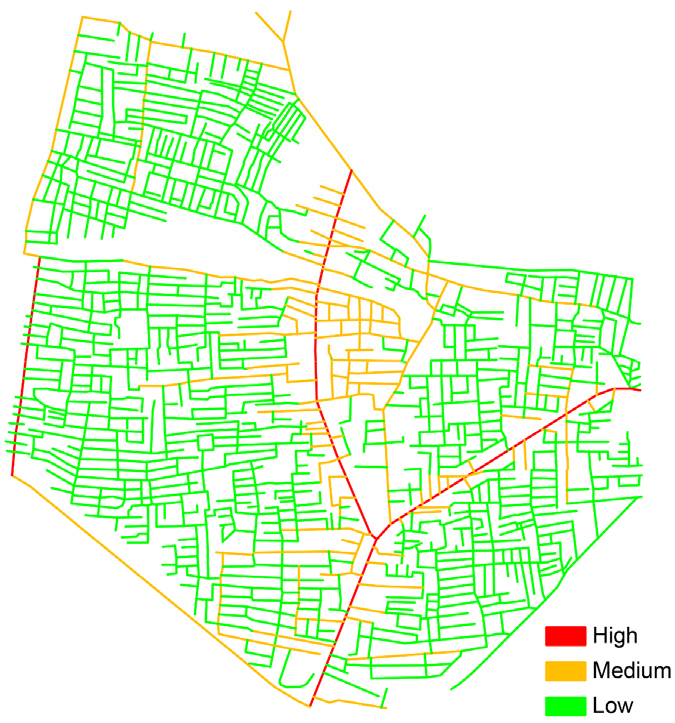
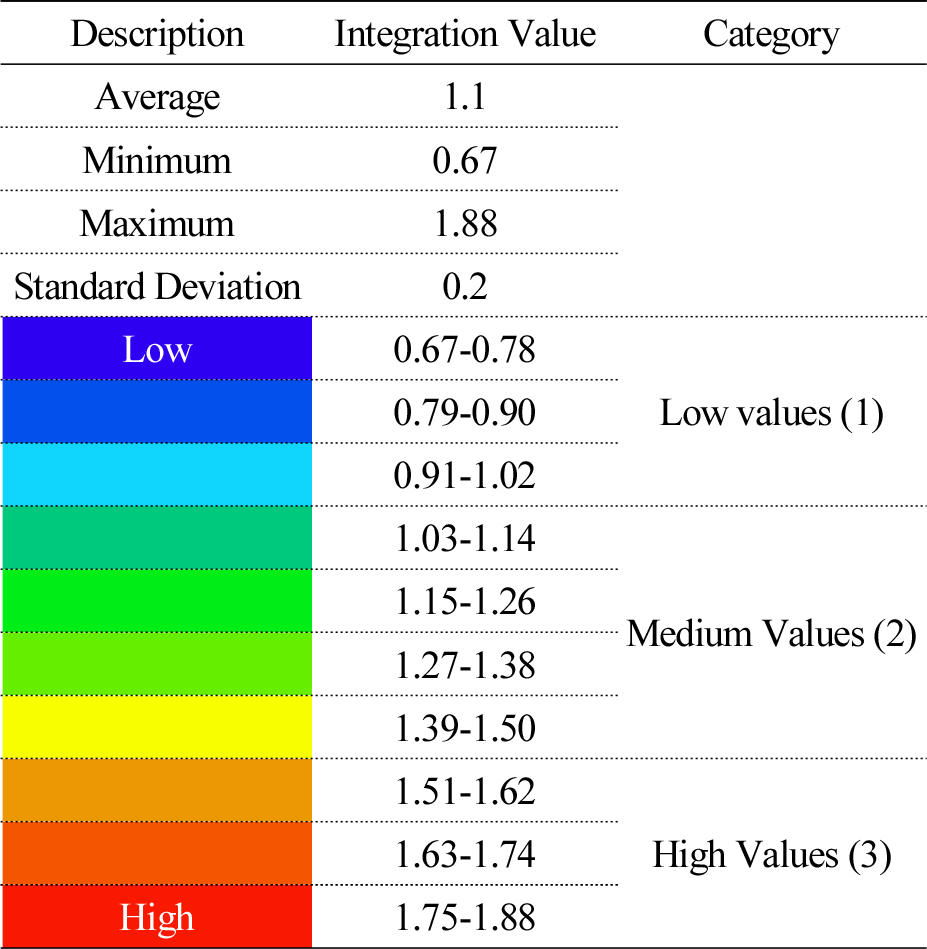
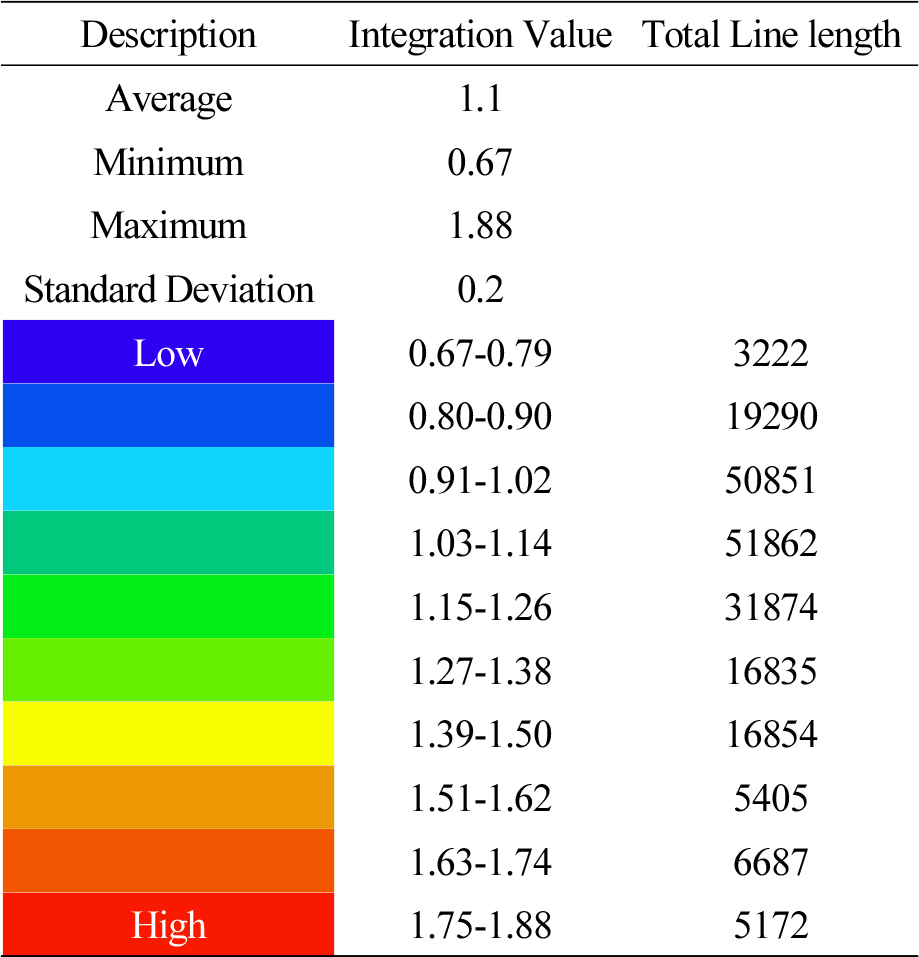
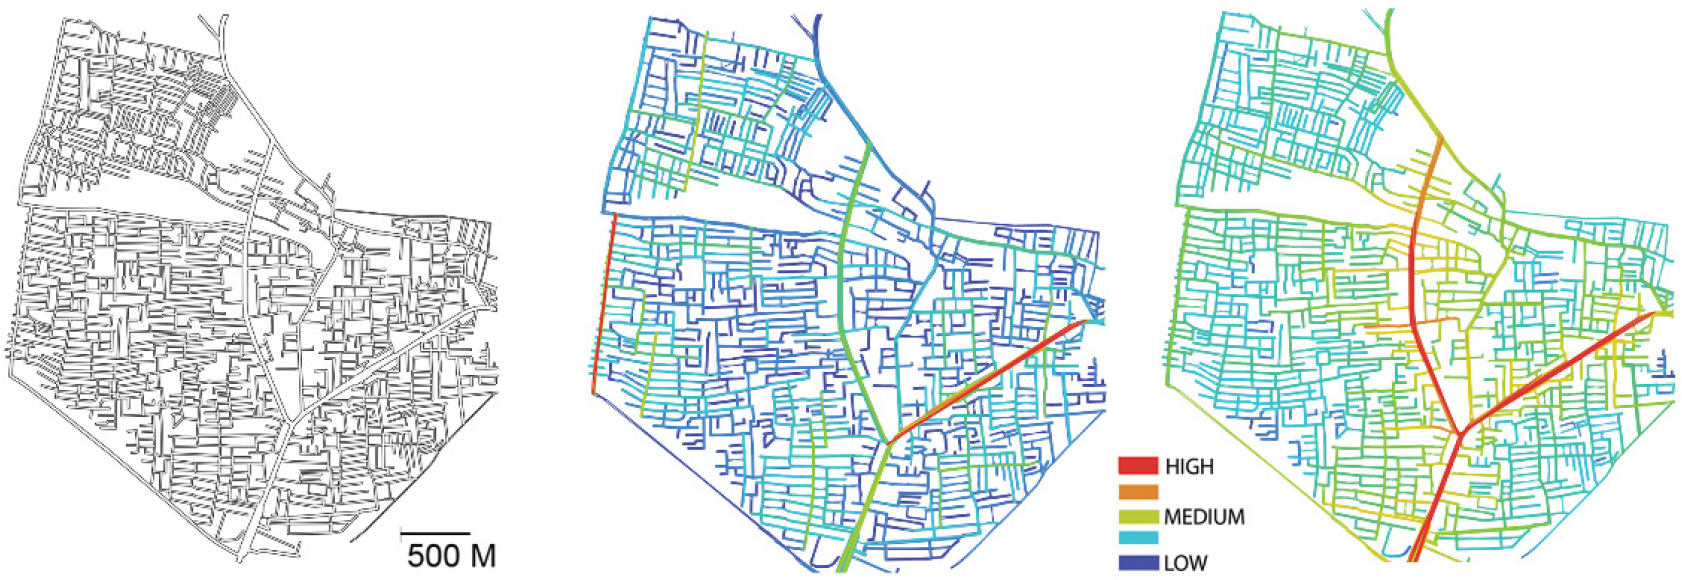
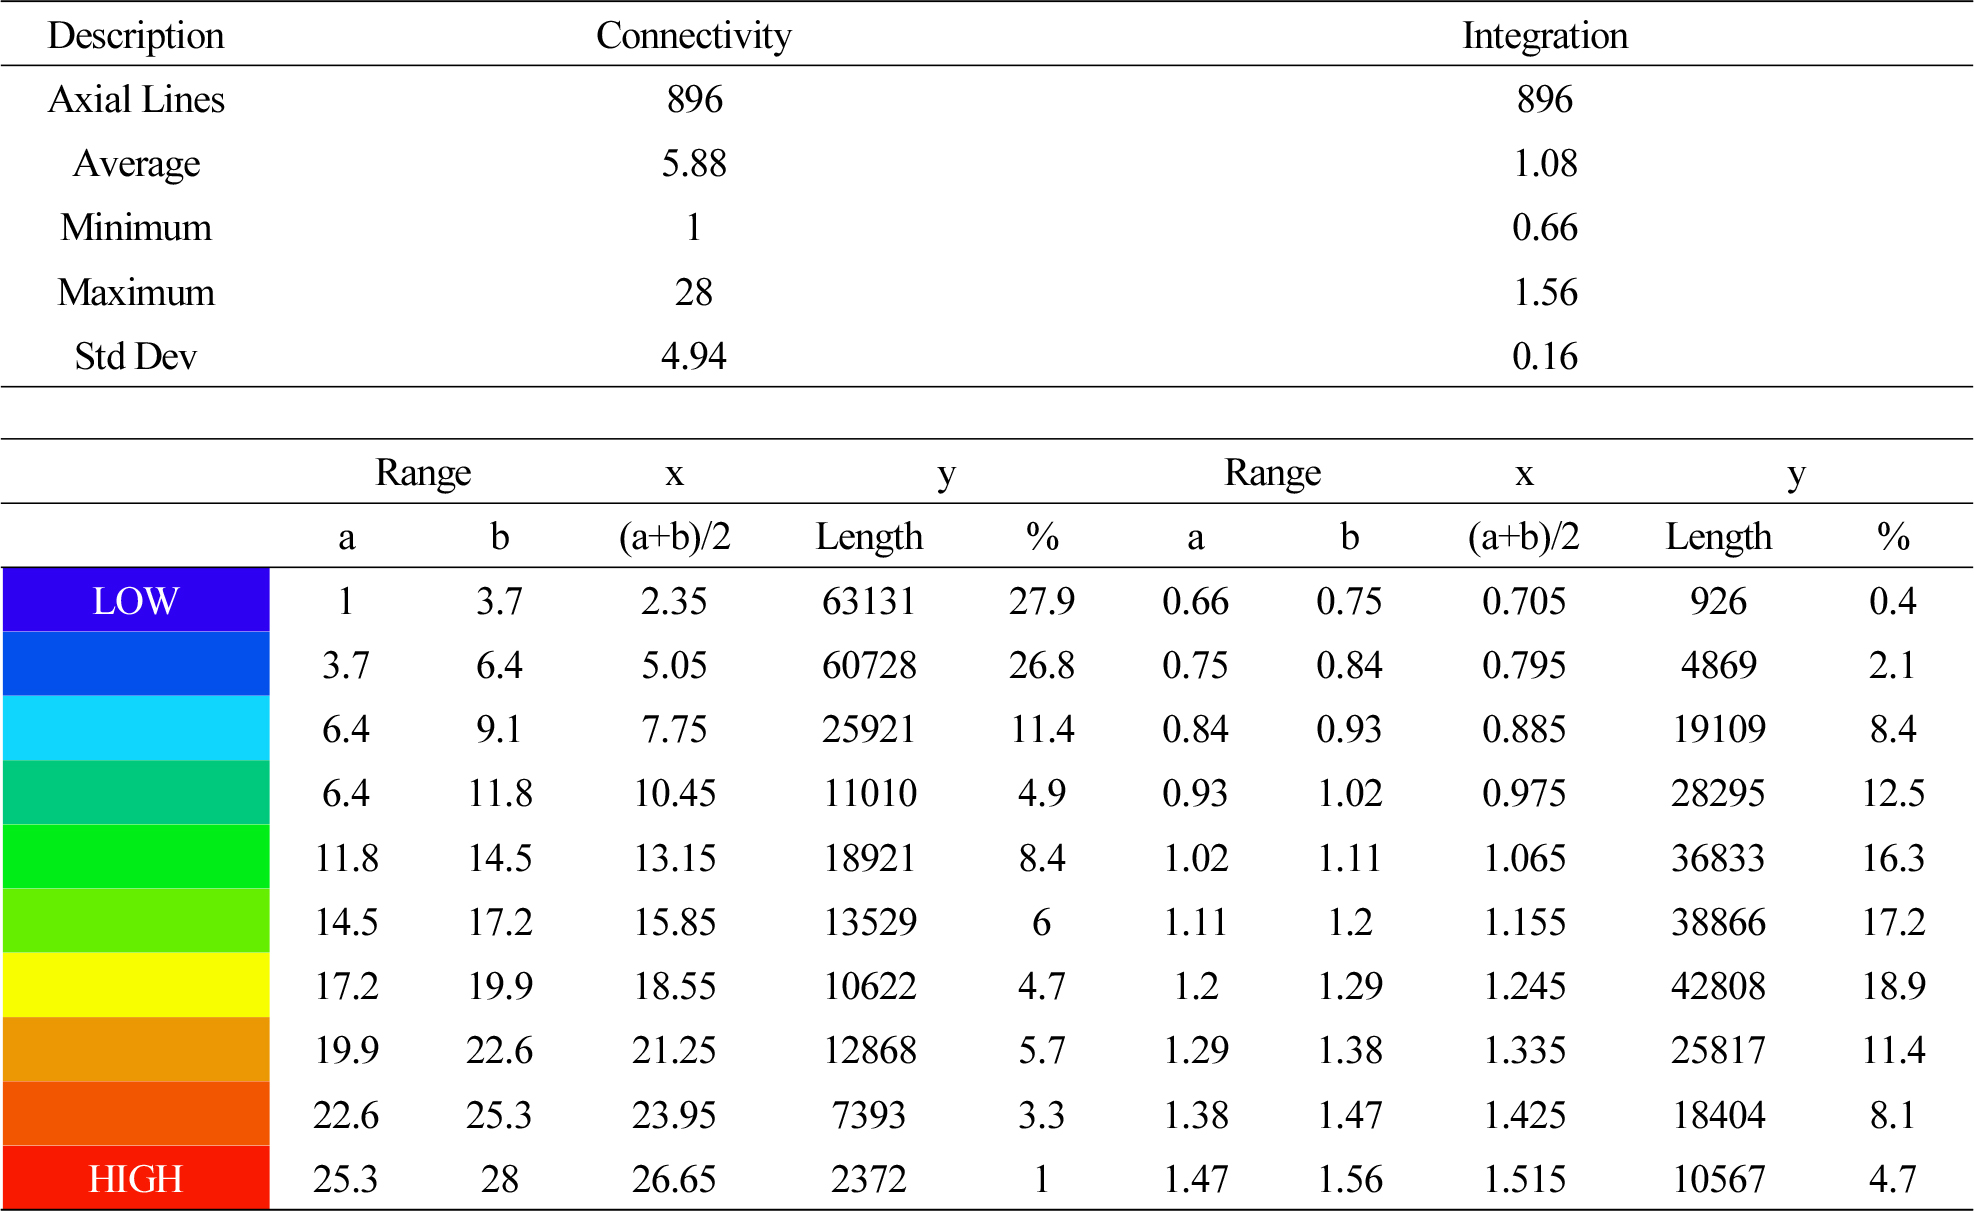
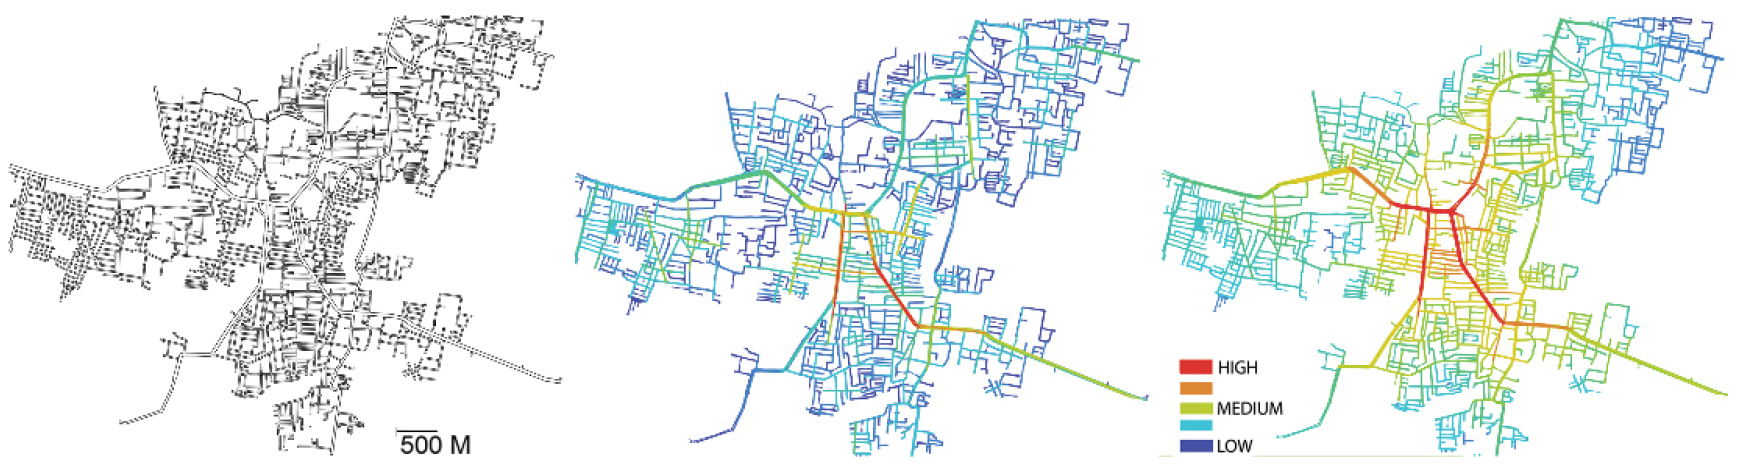
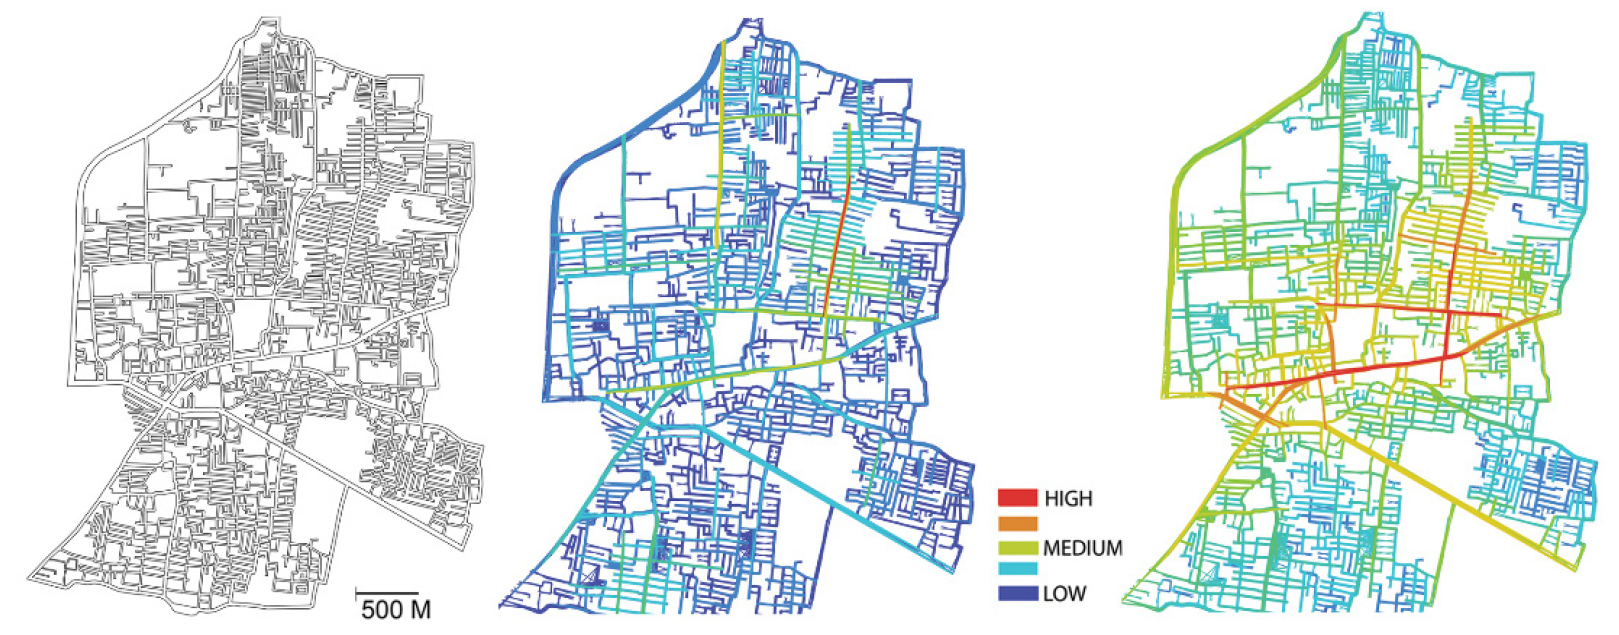
Integration Values measure the Topology of the street network through Depthmapx: visual and spatial network analysis software by Space syntax. The Entire study area is subject to an axial analysis, and Global integration values of the respective streets are obtained (Figure 2). The global integration values are categorised into ten divisions and simplified into three levels categorised as high, medium, and low (Table 1 & Figure 3).
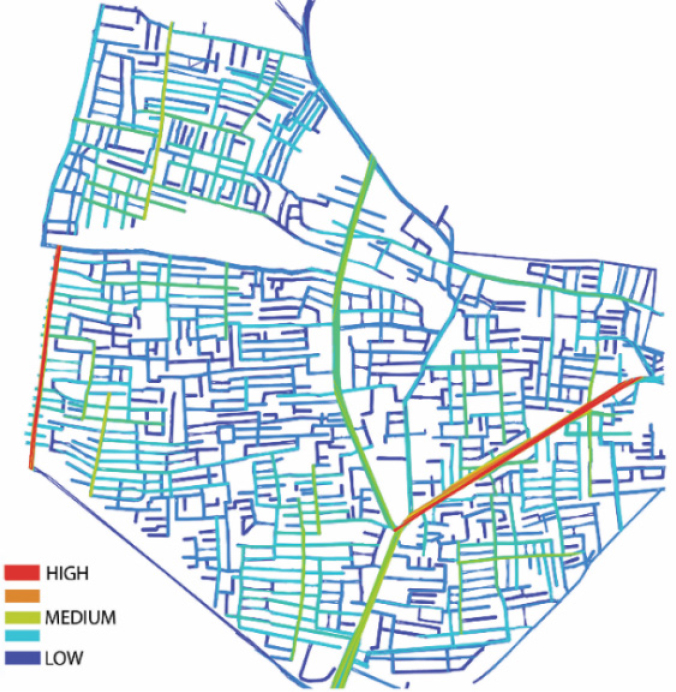
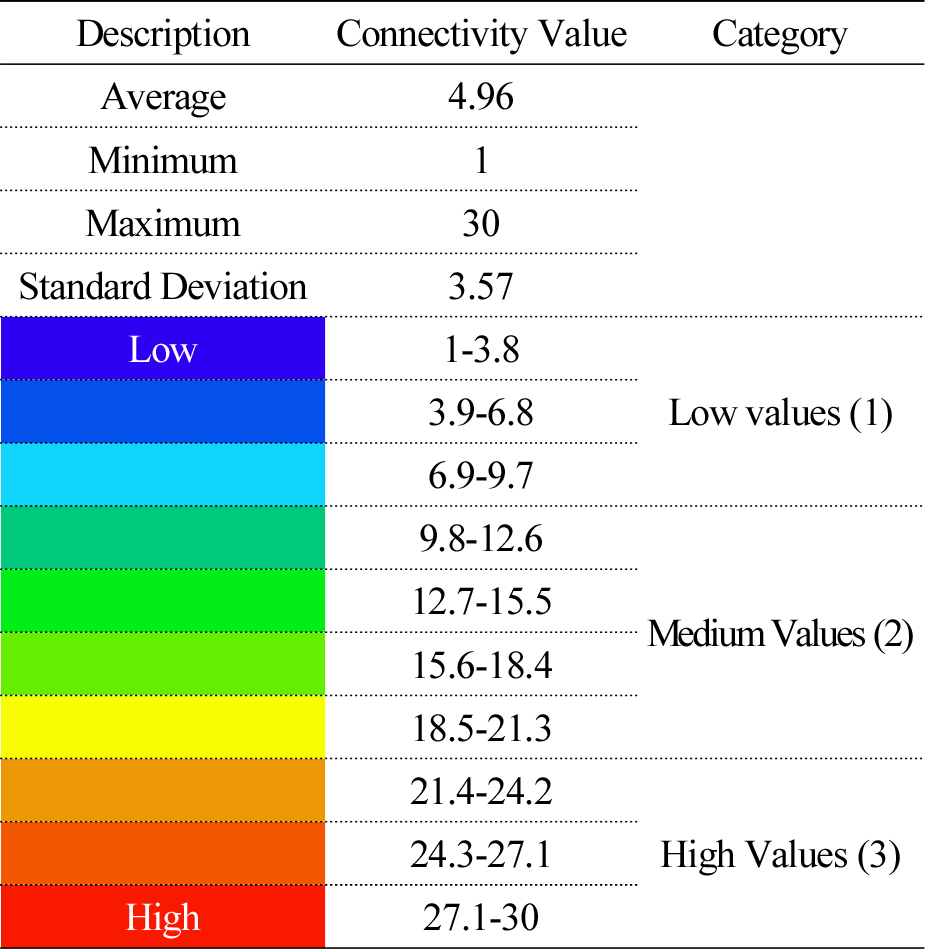
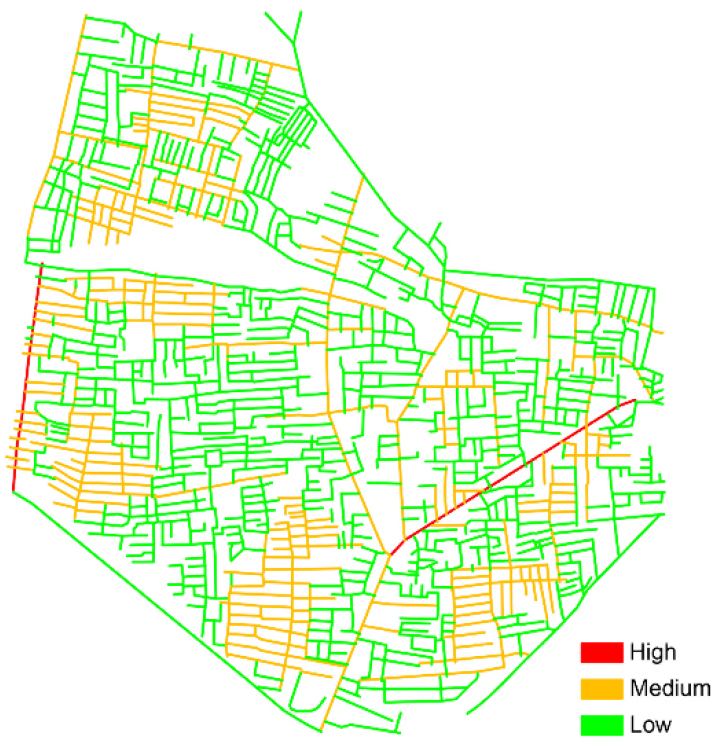
Quantitative Analysis – Connectivity Value of Streets
Connectivity Values measure the number of connections of every street of the network through Depthmapx: visual and spatial network analysis software by Space syntax. The Entire study area is subject to an axial analysis, and connectivity values of the respective streets are obtained (Figure 4). The global integration values are categorised into ten divisions, simplified into three levels, and categorised as high, medium, and low (Table 2 & Figure 5).
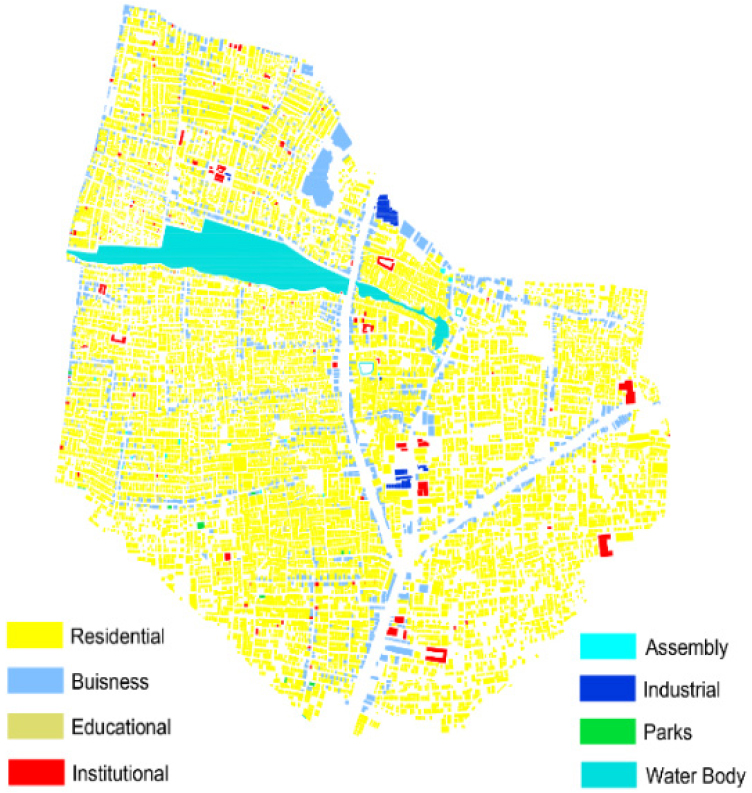
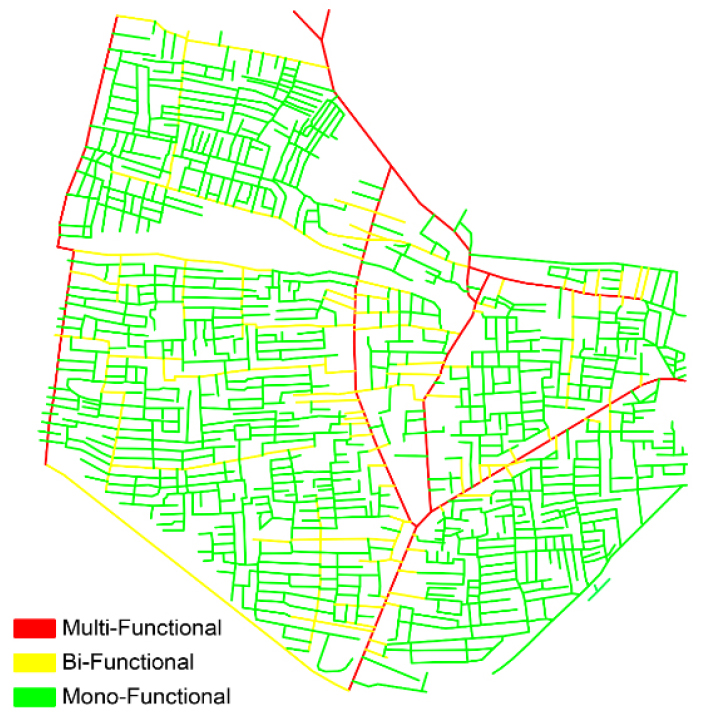
Mixed-Use Index of Streets
The mixed-use index of streets is Measured by surveying the functional entities in terms of work, amenities, and Housing. The street shall be considered multifunctional if all functional typologies are located within a single street. Streets possessing a mix of any two typologies shall be regarded as Bifunctional, and Streets possessing only a single typology on an entire street shall be considered functional. The land use map depicting the Functional typologies (Figure 6) and the Categorisation of the same (Figure 7).
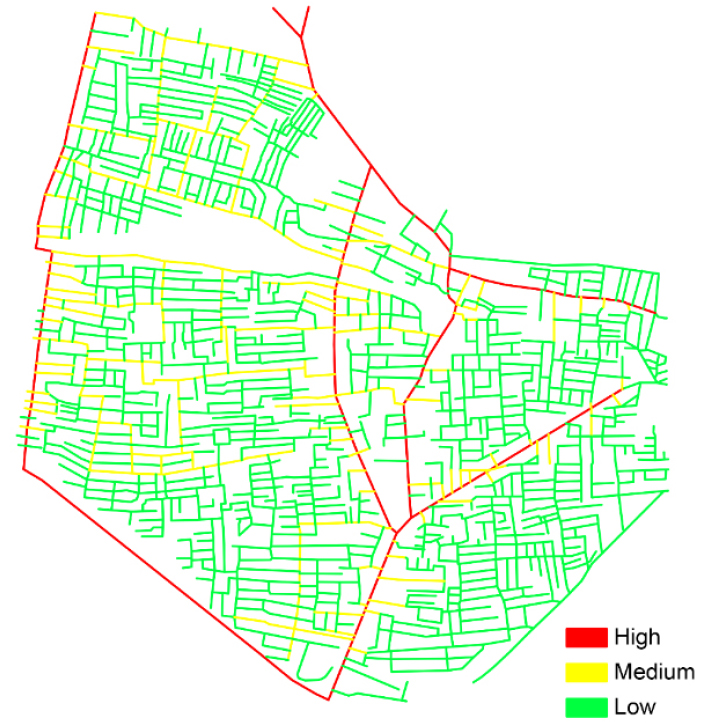
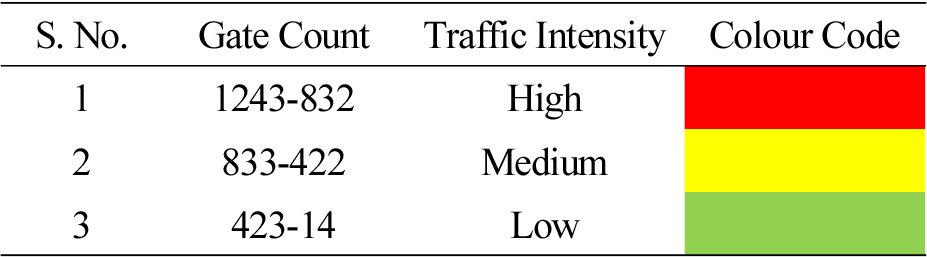
Traffic intensity
The traffic intensity is measured by the Gate count method, counting the number of vehicles and Pedestrians crossing the fixed imaginary line parallel to the width of the street. The survey was conducted at multiple timings at equal intervals to assess the traffic intensity at all the streets to quantify and categorise it into high, medium, and low. The maximum and minimum average no of gate counts are 1243 and 14, respectively. The Entire streets of the study area are analysed and categorised into High, Medium, and low-intensity traffic (Figure 8 & Table 3).
Comparative Analysis
Integration Values and Mixed-Use Index Values
The relationships between the Topology of street networks are measured in terms of Integration values by comparing the integration value map (Figure 3) and the Mixed-use index value of streets (Figure 7). The Study area reveals a positive correlation, where a higher concentration of various functions at the street level are witnessed at the streets possessing higher Integration values, and lower values characterise mono-functional entities.
Integration Values and Traffic Intensity Values
The Empirical Analysis of Understanding the relationships between the street integration values (Figure 3) and Traffic intensity (Figure 8) reveals a positive correlation where higher integrated streets possess Higher traffic intensity, and Streets possessing lower integration values possess Lower Traffic Gate counts.
Connectivity Values and Mixed-Use Index Values
The Connectivity values (Figure 5) and mixed-use Index Values of streets (Figure 7) are compared to understand their relationship. The streets of higher connectivity value characterise greater Mixed-use Functions by possessing Multifunctional Entities at the street level. Lower Connected streets are predominantly Mono-functional Residential entities where many trips originate and destine, and mono-functional Streets demand higher mobility travel.
Connectivity and Traffic Intensity
Depthmapx quantifies the Connectivity values of the study area by generating the axial line map. The connectivity values of the streets (Figure 5) are categorised into high, medium, and low values for better comparison. The traffic intensity map (Figure 8) is compared to analyse the relationships between Traffic intensity and street connectivity values. Streets Possessing Higher and medium Connectivity values characterise higher traffic intensity. Also, increased traffic movement in lower connected streets describes a longer travel demand.
Integration and Destination accessibility /distance to transitigher
Household Questionnaire Survey was conducted to understand accessibility in terms of reaching destinations for daily errands and Public Transportation points, the user opinion on the travel Ability in local streets (Mode, Time, and Distance) to reach and perform basic activities such as Work, play, Study, shopping basic errands by Accessing the Schools, Offices, Playgrounds, public parks, Shopping spots, and public transportation points were recorded and correlated with the syntactical parameters.
The study area had multiple streets; the data was collected from at least one household on each street. The accessibility parameters concerning destination accessibility and distance to transit are measured quantitatively. The results were correlated with the integration values of the streets. The Correlation value (R) is 0.91, Stating that the Households residing on the streets possessing higher integration and connectivity values had better access to public transportation points and easy access to daily errands. In contrast, the accessibility factor is curtailed for the people living along the streets possessing lower integration and connectivity values.
The empirical studies reveal the interrelationships within the elements of morphology, the Topology of street network measured in terms of integration value and Connectivity values being an independent factor, the Mixed-use index, Traffic intensity, Destination accessibility, and distance to public transit are influenced positively by it. Mixed-use index and Traffic intensity of the streets are positively Correlated with the Integration values and connectivity value of streets, and the traffic intensity and Mixed-use functions of streets are positively correlated (Table 4).
Table 4.
Relationship between the Syntactical and Morphological parameters
Quantifying the Topology of street networks and understanding their influences on Traffic intensity, Mixed-use developments, Destination accessibility, and distance to public transit shall act as an appropriate tool to understand the transformative potential of any place in a vibrant urban area facilitating accessibility. Hence quantifying the Syntactic properties, such as integration and connectivity values of the streets, reveals the transformation potential of a place into a vibrant urban setup.
Methodology
Quantifying Syntactic Properties of Street Network
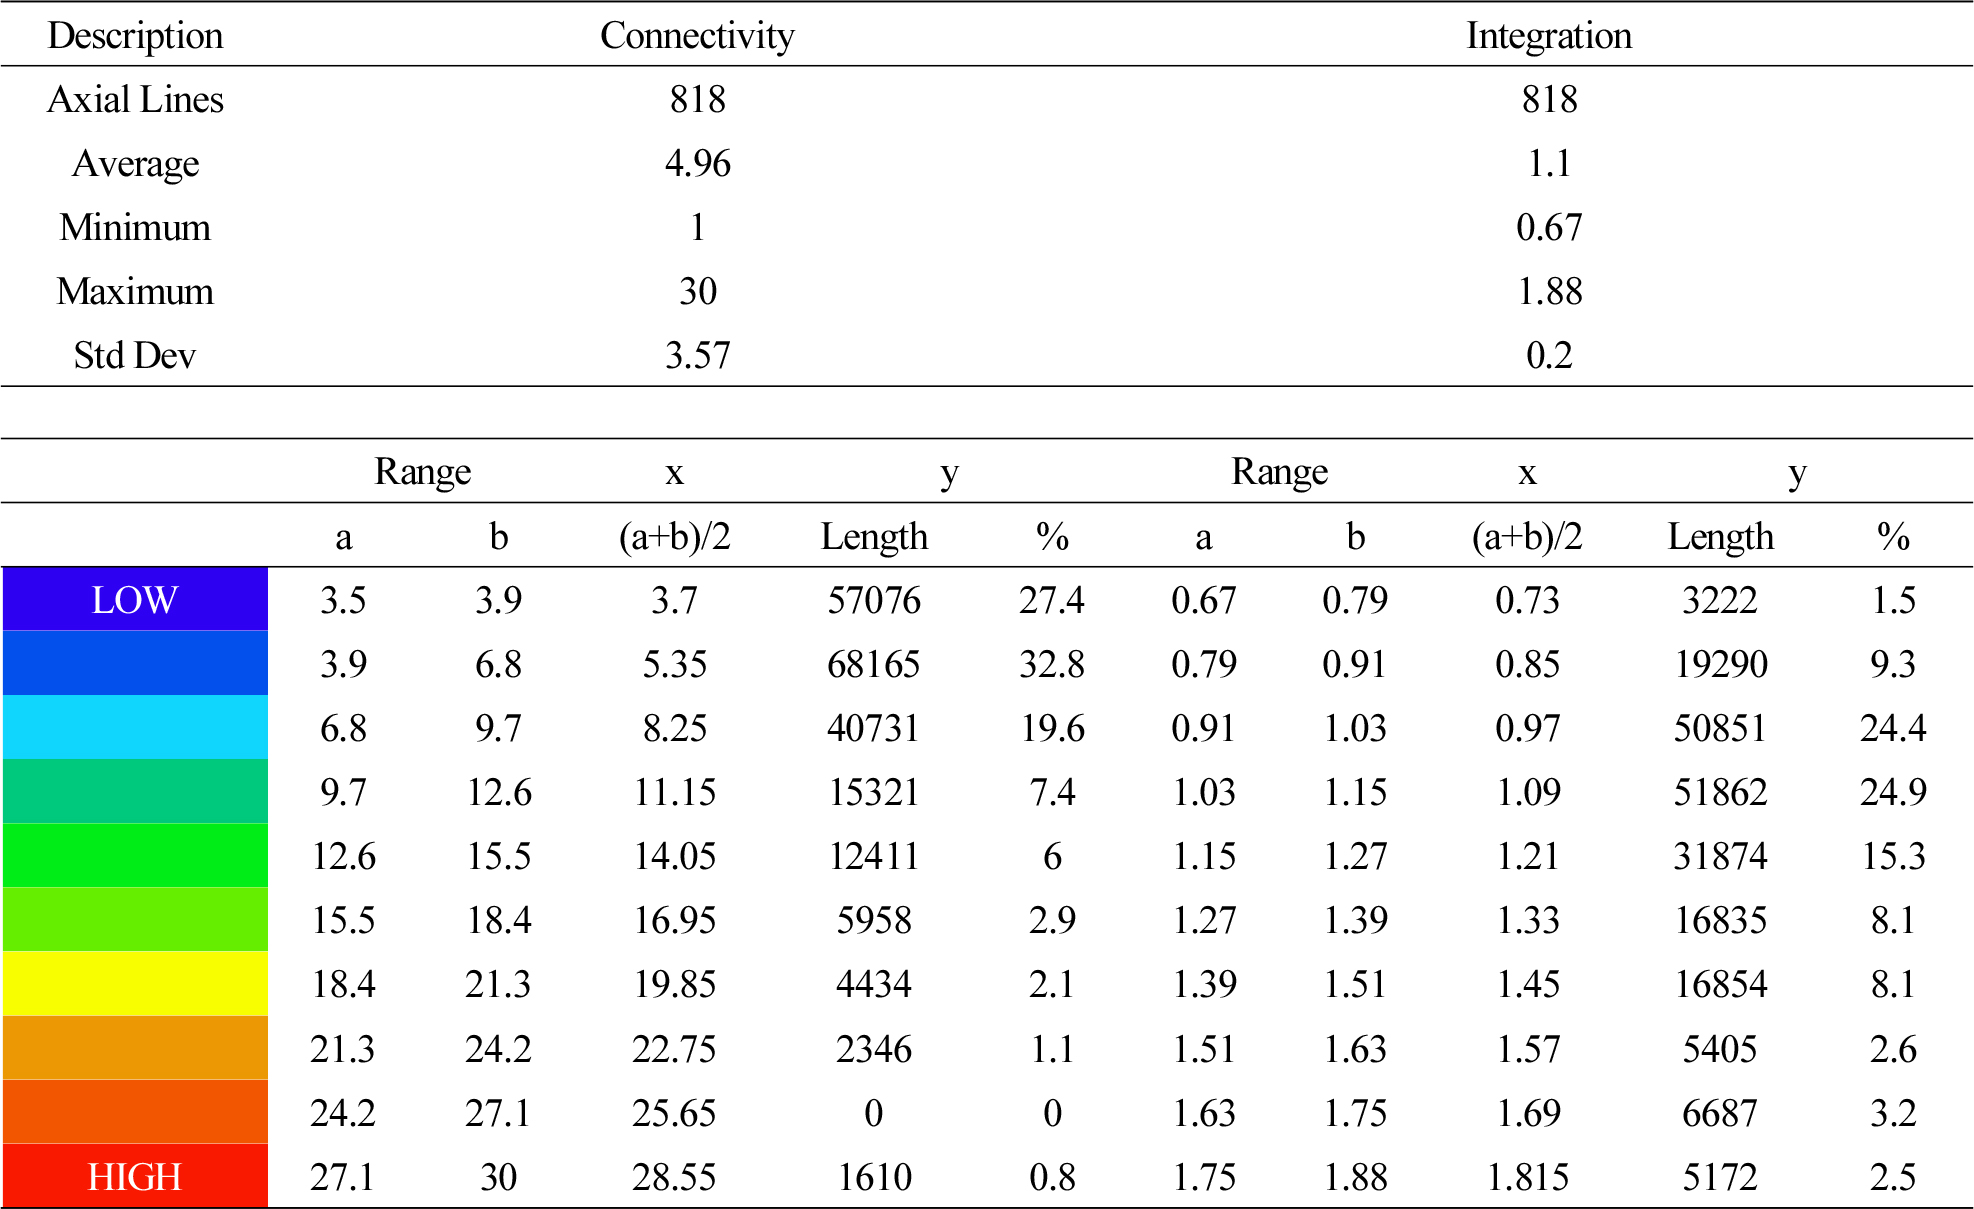
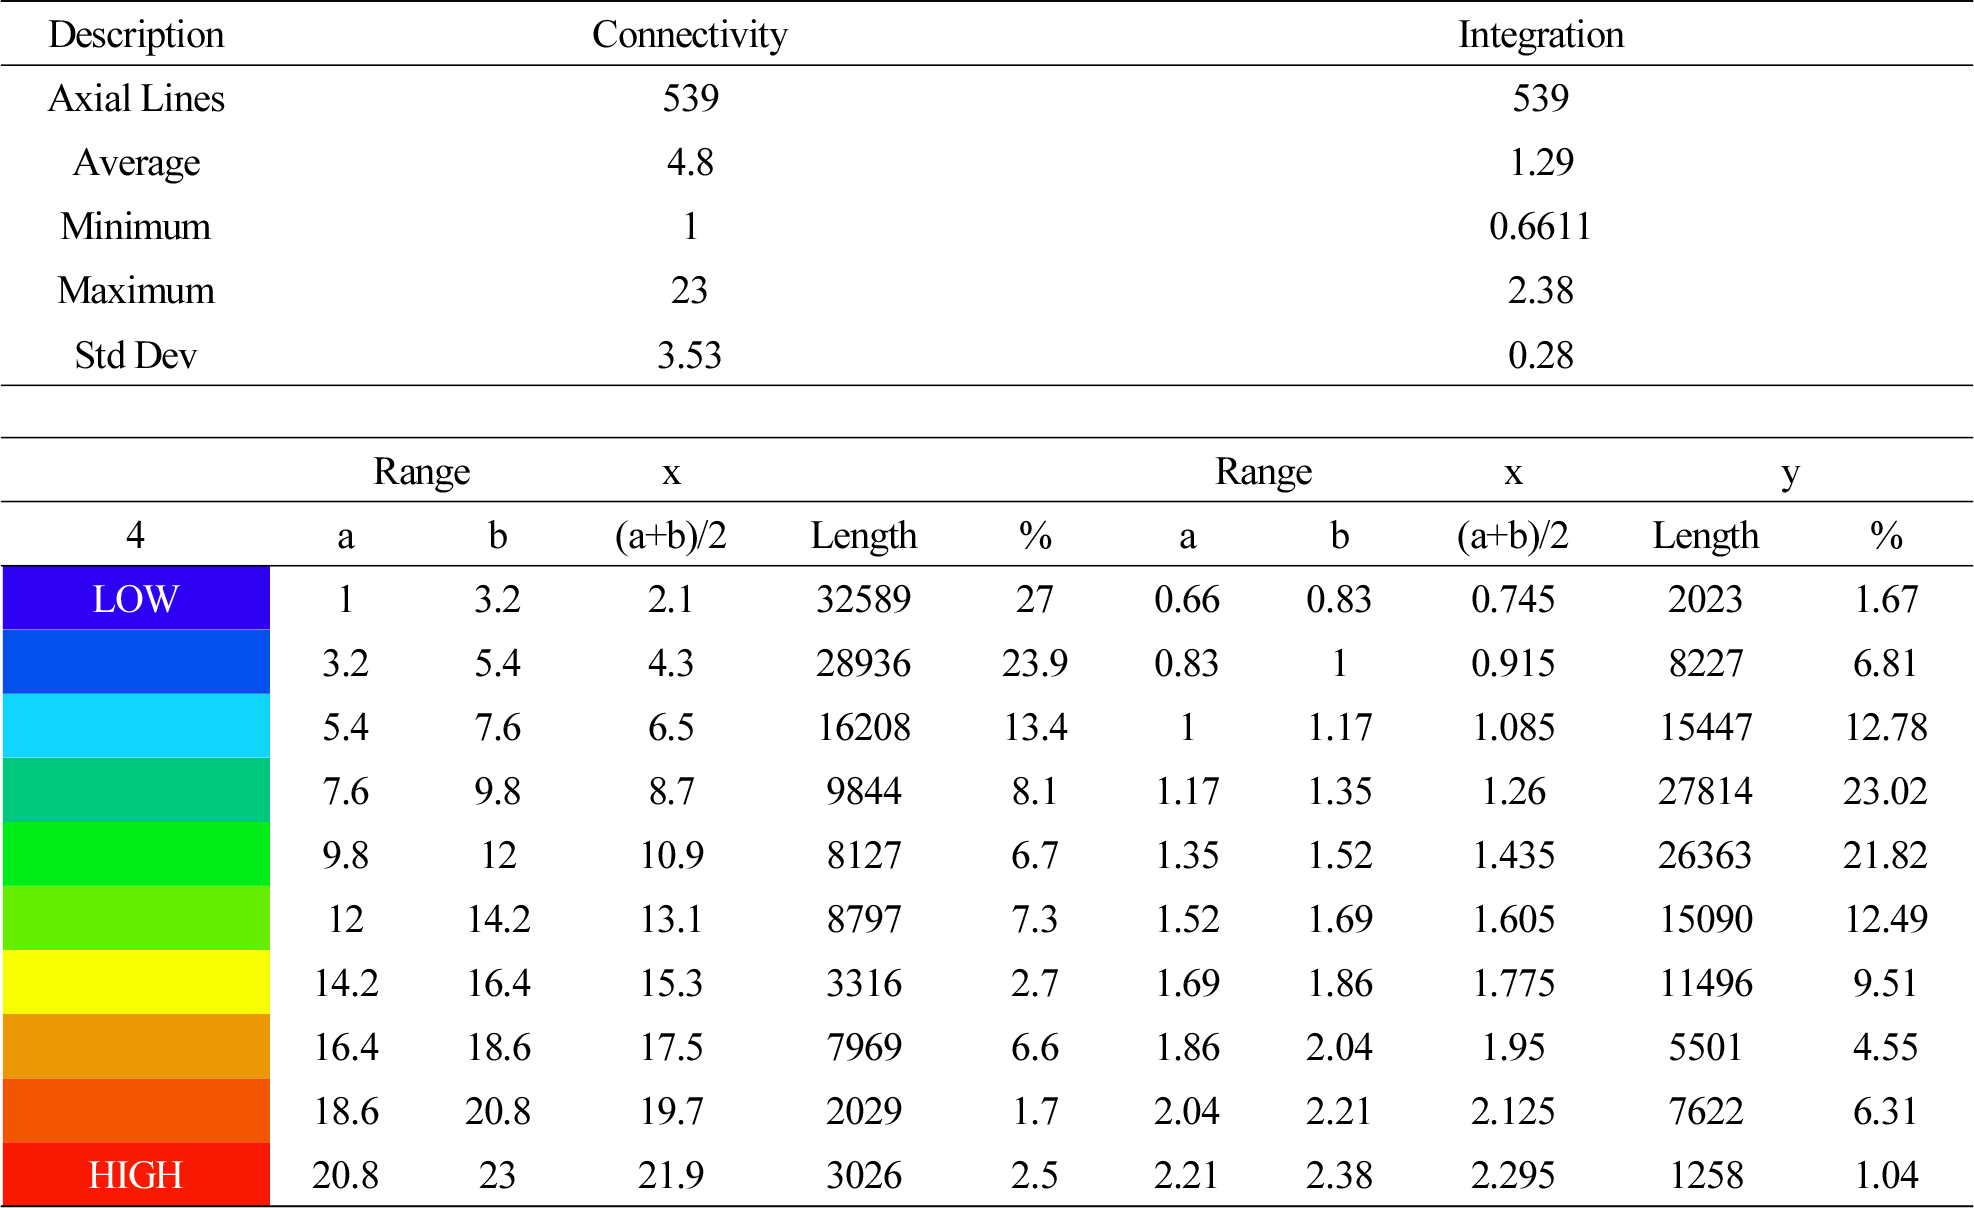
The areas surrounding the core area of the city area are selected for the study. Study areas are subjected to Space syntax analysis using the Depthmap algorithm. The street network patterns of neighbourhoods with stipulated boundaries are Digitized and drafted from open street maps as drawing files. The axial map is generated for the same by axial analysis by the Depthmap Algorithm. An axial map is reduced to the fewest line maps for accuracy. The attribute list provides us with the data of the total number of axial lines, maximum and minimum values, and standard deviation in the form of numeric for syntactic measures such as Connectivity, Integration, and its respective line length (Figure 9). The values ranging between the Minimum and maximum of each parameter (x) are categorised in ascending order into ten divisions. The total number no of line lengths of all the segments that fall under each category is summed up to arrive at the total length of axial lines (y) of a particular range, where (x) is the average of the Minimum (a) and maximum (b). The respective total Line length (y) is given by y = L1+L2+L3....+Ln, and the formula for x and y are below, respectively, where a and b in the Equation represent the lower and upper limits, L and n represent the length of line and no of line, respectively.
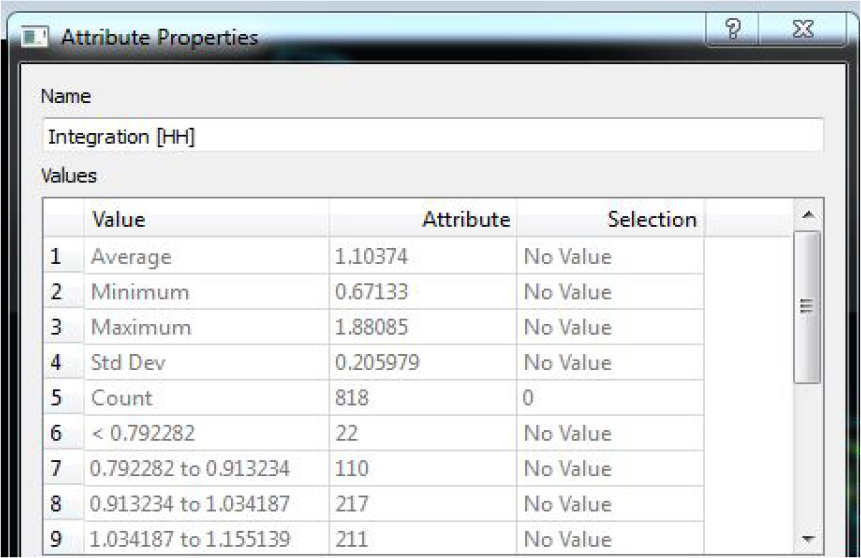
The example for calculating the total line lengths of the range is described below in Table 5. The integration value range between 0.67- 0.79 has 22 streets, the sum of all 22 street lengths is 3222
Table 5.
Integration Value Range (0.67-0.79) and its respective Line lengths
Pearson’s correlation coefficient is calculated by relating the syntactical values of Connectivity and integration values in ascending order (x) with respective total line lengths (y) to understand the association between the properties and line length. The percentage of each category of axial lines is also represented to understand the distribution of street network values.
Intelligibility and synergy values are systems generated through the Depthmap algorithm by correlating Connectivity / Global Integration values and Global Integration Value / Local integration values, respectively. The morphological structure on the axial line distribution based on each study area’s syntactic values is represented in Table 6.
Study Area 1- velachery
Velachery is a diverse urban area that combines residential enclaves with corporate hubs, IT structures, bustling commercial complexes, expansive malls, and state-of-the-art multiplexes. This neighborhood’s evolution was accelerated by the growth of the information technology corridor, resulting in swift advancements. This rapid progress contributed to an upsurge in the transient population and gave rise to a variety of urban challenges.
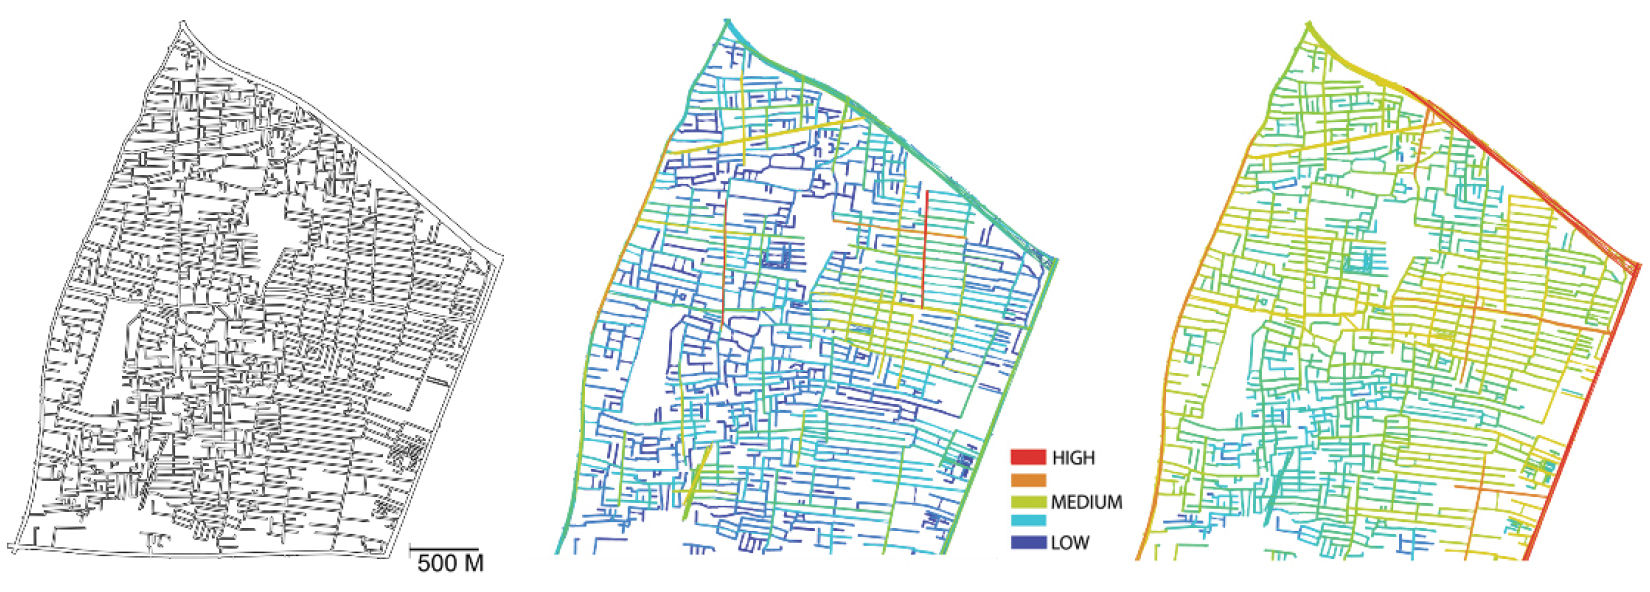
The syntactic analysis measure reveals a higher count of streets possessing low connectivity and Integration values and vice versa (Figure 10 & Table 7).
Study Area 2- Madipakkam
Madipakkam, located in the south of Chennai, is a suburban town recently put under the Greater Chennai Corporation. In the form of Mid-rise apartment complexes and villas mainly consists of horizontal residential developments.
The neighbourhood of Madipakkam represents a higher percentage of Low Street network connectivity values. The lowest range of connectivity values between 1 - 3.7 holds 28 percent of total line length, and subsequent low values between 3.7 and 6.4 constitute 27 percent revealing the street disconnectedness. The highest value of connectivity constitutes 1 percent of total street lengths. The distribution pattern in terms of connectivity values of the sum of line lengths is descending concerning the range of connectivity values in ascending order revealing a strong negative correlation. The middle range of integration values constitutes 64 percent axial lines supporting mixed land use and higher density, facilitating Accessibility and Mobility (Figure 11 & Table 8).
Study Area 3- Medavakkam
Medavakkam is a suburb of south Chennai. This area is a rapidly growing residential location due to its proximity to the IT corridor and SEZ. In 2012, a global property consultancy Knight Frank study revealed that the neighbourhood has emerged as India’s sixth-largest residential real estate investment destination in the country’s 13 top residential destinations.
Axial line analysis of Medavakkam represents a lower percentage of high and medium connectivity values, and higher percentages of medium integration values revealing negative relationships (Figure 12 & Table 9).

Study Area 4- Porur
Porur is a residential neighbourhood in the southern- west area of Chennai. Although the region is renowned for manufacturing and Chemical plants, the locality’s main demand factors are the surrounding presence of the many IT parks and industrial estate.
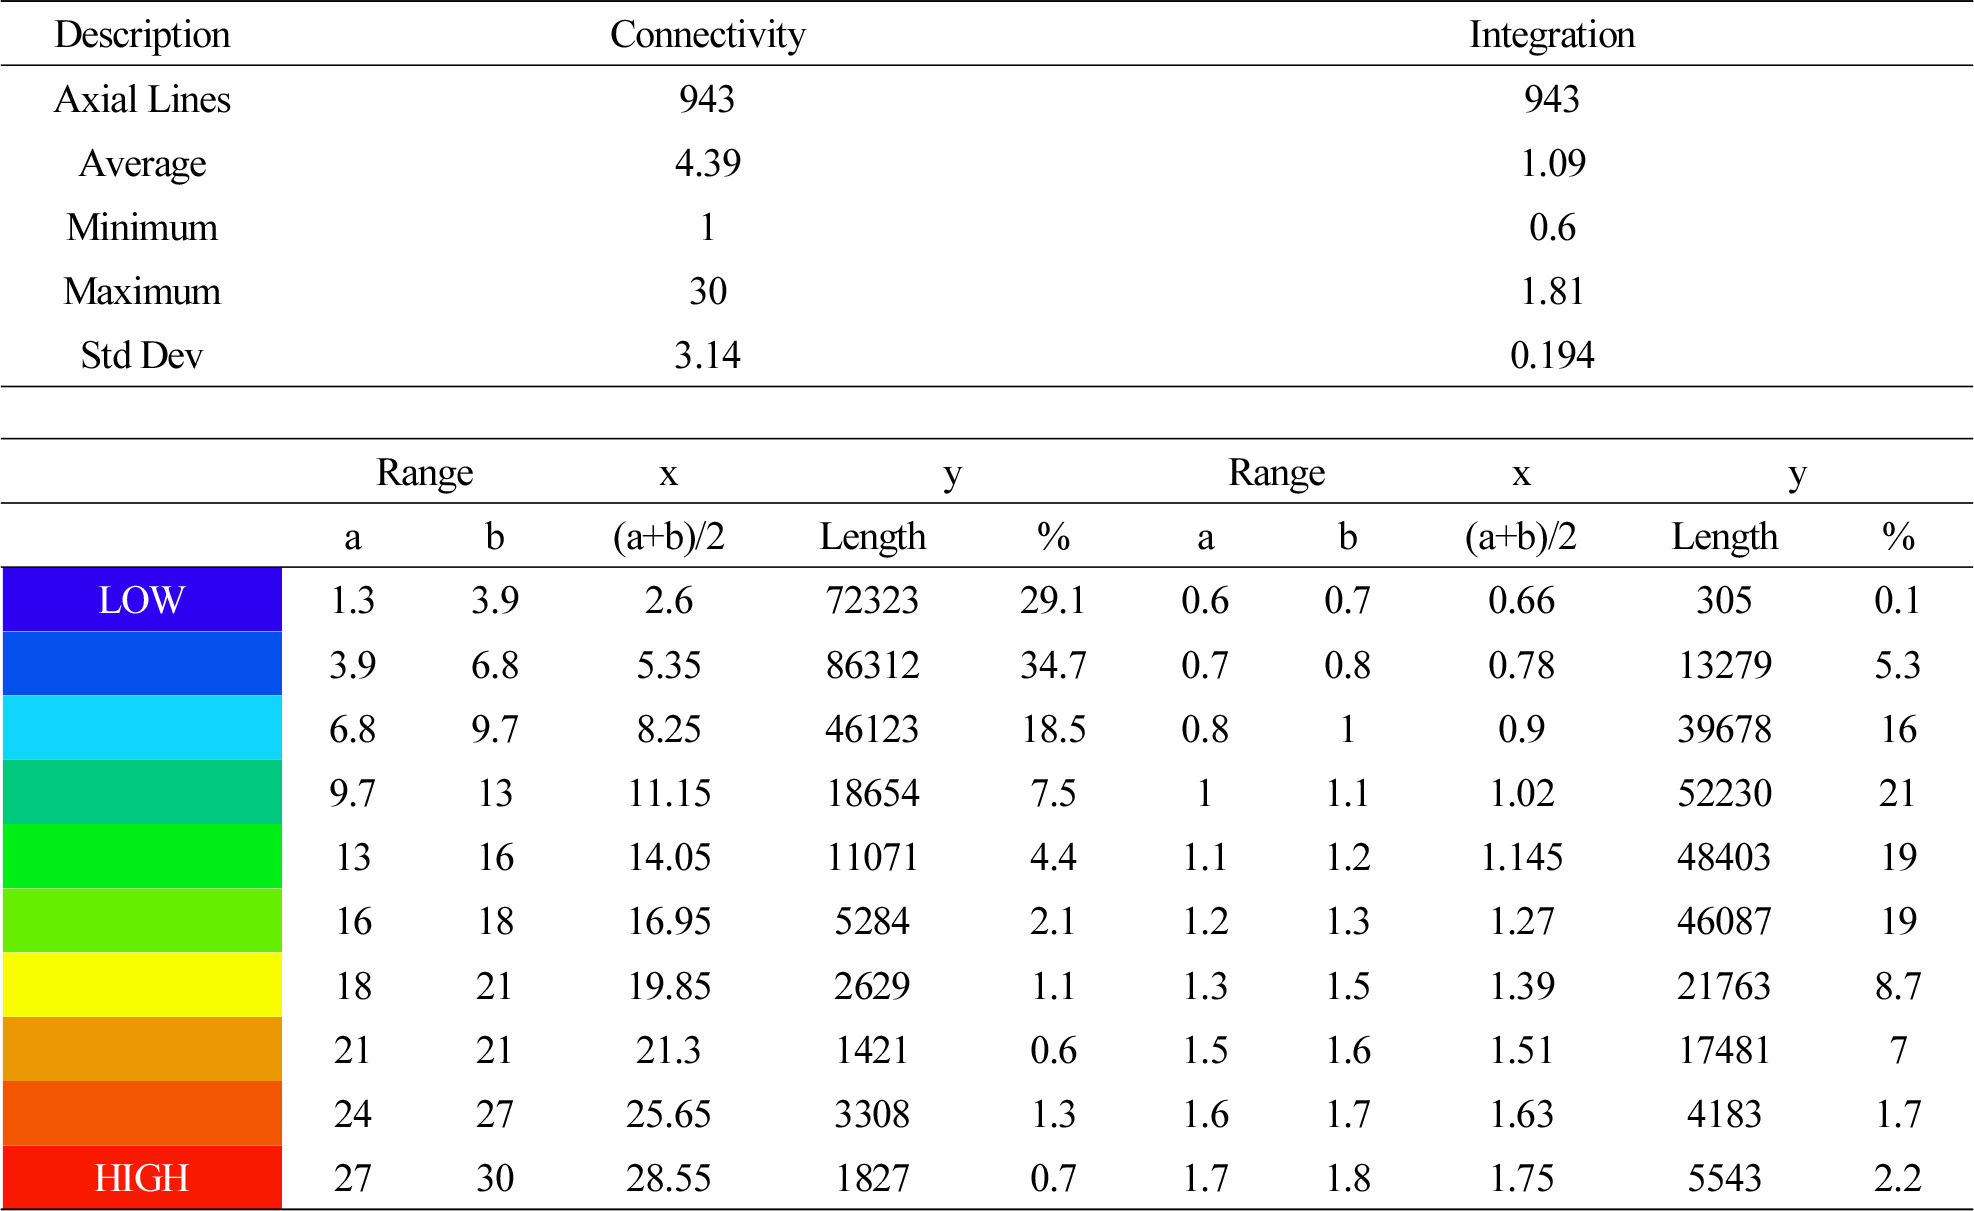
The neighbourhood of Porur represents a higher percentage of low Street network connectivity values. The lowest connectivity values between 1.3 and 3.9 correspond to 29 percent of total line length, and the 34 percent group into the subsequent low value between 3.9 and 6.8 and 0.7 percent of axial lines relate to the highest value of connectivity. Twenty-one percent of axial lines contribute to the lower street network integration values, and the medium range of integration values comprises 68 percent of axial lines; only 11 percent of streets hold higher integration values (Figure 13 & Table 10).
Study Area 5 - Thiruvanmiyur
Thiruvanmiyur is a residential neighbourhood that has seen steady growth in its economy. With the proposal of Chennai’s pioneer technology office space, the Tidel Park within the neighbourhood, the eventual plans for many information technologies parks, universities, corporate offices, and research centres around Tidel Park showed innovations for the neighbourhood.
The axial line analysis reveals a higher percentage of lower connectivity values; 66.84 percent of axial lines constitute medium integration values, and the association between the range of integration values and its respective sum of line lengths stands negative (Figure 14 & Table 11).
Results
To quantify and substantiate the relationship between the spectrum of syntactical values and corresponding percentages., the correlation coefficient between syntactical values with percentages is calculated to understand the distribution pattern of axial lines (Table 12).
Table 12.
Correlation Values of Syntactic Parameters & Sum of Line Length
The organically evolved residential neighbourhoods reveal identical distribution characteristics across the study areas. The correlation between the sums of all Line lengths and their range of connectivity values indicates a Strong negative correlation that reveals higher no axial lines possessing lower connectivity values. Axial line with higher connection values adds to the capacity of active travel, higher connectivity, and higher movement. Street network patterns with higher no axial lines with higher connectivity values increase accessibility and mobility. Street network patterns with the mere number of streets with higher connectivity values are vulnerable to higher traffic as the particular stretch invites more significant traffic. A negative correlation of Axial Lines with connectivity values of the study areas indicates that the residential neighbourhoods are inaccessible and constrain mobility.
As a variable used to determine the association between people and urban spaces, it will indicate the potential for transactions and the level of integration value of the street network considered the most vibrant functional area. Analysis of all 5 study areas exposes the association between the sum of line lengths and integration values as unfavorable, except for Madipakkam. A strong positive correlation between the variables insists on Accessibility and Mobility, whereas the negative constrains it. Therefore, necessary interventions are required to augment the street network to increase the integration values and achieve mixed land use and density, facilitating Accessibility and Mobility. The strong correlation between Integration and Connectivity implies that the whole street network patterns shall be understood from the parts. Typical urban areas or towns tend to have an intelligibility correlation of about 0.45. In contrast, unintelligible systems will have values of 0.2 or even less, where a value of 1 is substantial, and 0 is random. The study areas of Chennai City comprehend a positive association of the variables representing typical urban areas and unintelligible street networks limiting accessibility by restricting through wayfinding parameters.
Correlation between the Local Integration and Global integration values measures the degree to which the local structure of an area relates to the larger-scale system in which it is embedded. A weak correlation implies that local areas are segregated globally, even in residential regions near the centre. In contrast, the strong correlation encompasses integrated across the larger scale of the system. 30 percent of Areas of Madipakkam, Medavakkam, Porur, and Velachery relate with the global structure in which it is entrenched. Thiruvanmiyur, a settlement with a slight influence of the temple as the centre of development, exhibits 65% of local areas comprehending the global structure.
Conclusion
Compared to other cities, Chennai has a rapid growth pattern due to the constant immigration of people from rural areas. The lack of planning governance led the city to grow haphazardly. Currently, the transportation policy of Chennai concentrates on providing ease of accessibility by means of providing public transportation; the Metro rail system is being implemented phase-wise to control traffic by reducing private transport. Multiple main streets connecting the Business center and residential neighbourhoods are widened to accommodate vehicular traffic. As the city grows, the main streets carry higher traffic leading to further expansion or widening of streets, which is a constant repetitive process.
The street network of the study areas of Chennai characterises a disconnectedness and Sprawl based on several parameters of its own. It does not facilitate mixed land use and higher density, constraining accessibility and mobility. According to the theory of natural urban transformation processes, the efficiency of the street network plays a significant role in transforming a region into a vital one. Regarding mixed- use, higher density, and accessibility, the street network efficiency is measured by syntactical values and quantified to understand its dynamics and forecast the development potential. In understanding the street network syntactic properties, there is a negative correlation between syntactical values (Connectivity, Integration) and the percentage of distribution of axial line. Therefore, it represents the development potential of these neighbourhoods may be curtailed, and there are mere chances of transforming them into a vital places in the future.
The study results are a fact that the recent trends of street networks reveal Sprawl which may curtail the developmental factors and contribute to an imbalanced urban setup in terms of Land use Mix and density. It mandates urban design interventions to overcome the situation and ensure evolving into vital neighbourhoods. Moreover, the syntactic structure study of these recently evolved residential neighbourhoods reveals an inherent common character of connectivity and integration and slight variations in Integration, Intelligibility, and synergy values. More case studies shall be analysed to understand the commonness of syntactic values of street networks and their distribution. The analysis paves the way forward hypothesis of whether these regions possess the potential to transform into vital urban places, and further research is required to validate it. Necessary possible interventions at all minor street levels (not only concentrating on major streets) by increasing the connections and integrating them within the street network enhance accessibility.
