

Introduction
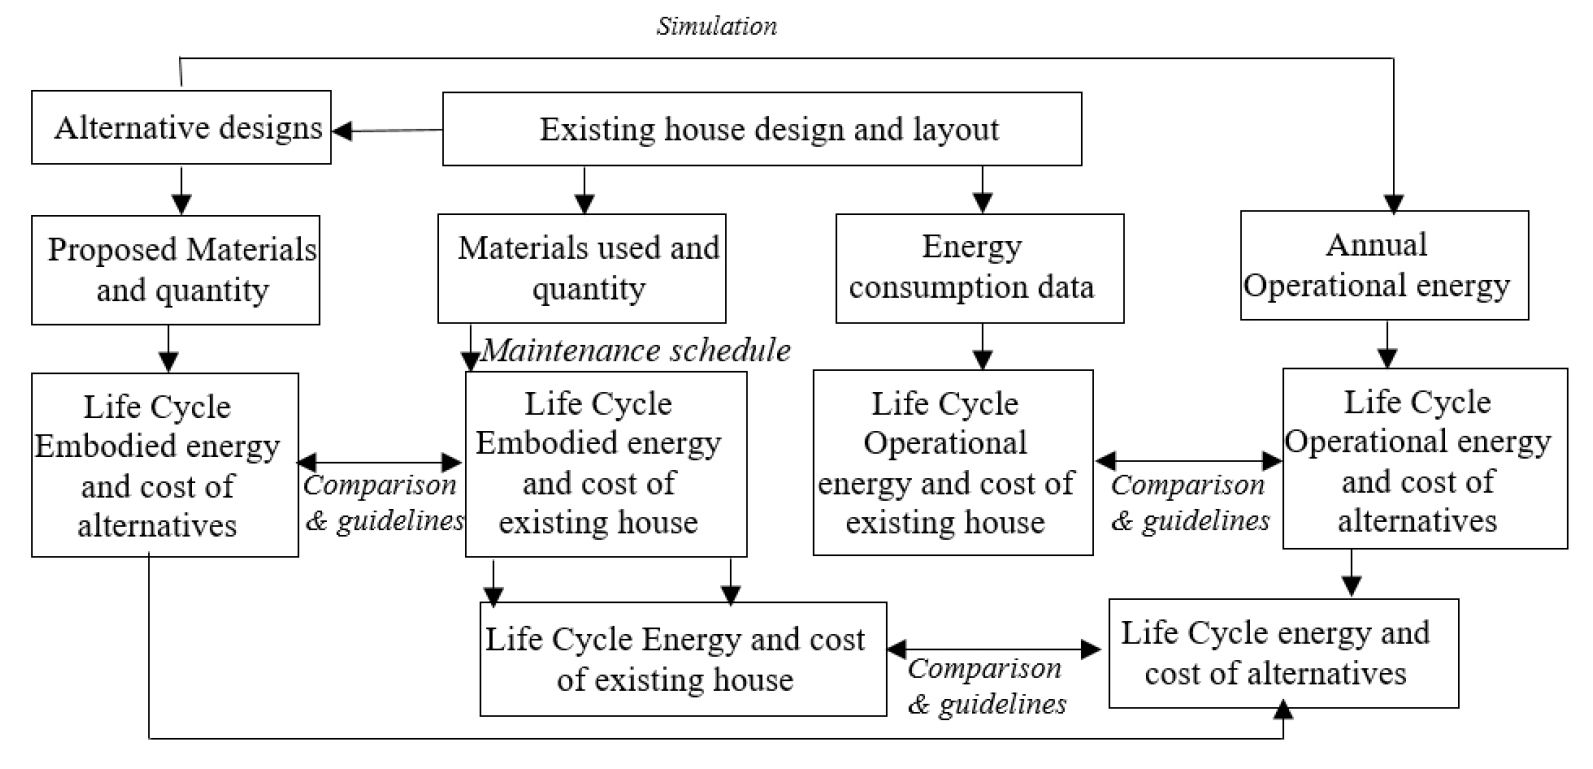
Methodology
Literature Review
Mass housing at Hamirpur
Alternative designs for existing mass housing
Results and Discussion
Conclusions
Introduction
As per International Energy Agency (IEA), the residential buildings consumed about 10% of the world’s delivered energy in 2013 [1] and has reached 26.92% in 2021 [2], at the rate of 2.12% than the anticipated rate of 1.5% per year in 2013. Further, the electricity consumption of residential buildings accounts for 28% of the total energy use in non-Organization for Economic Cooperation and Development (non-OECD) countries which is continuously rising. Hence, there is a need to control energy demand in residential buildings. In Himachal Pradesh, Himachal Pradesh Housing and Urban Development Authority (HIMUDA) was constituted in 2004; to plan and fulfill the Housing needs of different income groups through the planned development of Housing colonies [3]. It is responsible for developing and providing mass housing to the people in and outside the state of Himachal Pradesh and provides built houses, residential plots, and flats to the masses, and has developed many housing colonies in various places in the state. One such development of Housing colony was done at Nayanagar, Hamirpur in 1998 wherein 72 HIG and 19 MIG houses were developed under the regulations framed by Town and Country Planning Department [4]. Nowadays, energy efficiency is one of the major targeted objectives and has been introduced by many countries during the last few decades [5]. With the same objective in mind, the Himachal Pradesh government in 1994 introduced the Ministry of New and Renewable Energy (MNRE) financed Passive Solar Building Program [6] under which the development of public, semipublic, and under various government buildings including the Housing board shall have solar passive features in their design. In 2009, the government included solar passive building design [7] into the Town & Country Planning Rules. Further Energy Conservation Building Code (ECBC) has been notified in the state but is limited to commercial buildings [8]. Built residential buildings which are the outcome of a preconceived design, consume various types of energy throughout their life cycle, and hence the design must be made intentionally energy efficient and must be carefully selected among alternatives. Therefore, the preconceived design must be evaluated along with its suitable alternatives for their performance towards various types of energies throughout its entire designed life span. The scope of this study is to identify the impact of change of design on the Life Cycle Energy use and Life Cycle Cost of the households. In this study, the impact of various design characteristics such as total exposed area, volume, compactness ratio, and Window to Wall Ratio (WWR) of the existing house and three other alternatives have been compared.
Literature Review
As per the definition cited by Ding [9], embodied energy comprises the energy consumed by any material during the extraction and processing of raw materials, transportation of the original raw materials, manufacturing of building materials and components, and energy use for various processes during the construction and demolition of the building. In India, studies by Kumar et al. [10], Reddy and Jagadish [11], TERI [12], Harrison [13], Chani et al. [14], Gumaste [15], and Maïni [16] highlighted embodied energy values of various building materials using a cradle to gate approach. Dixit et al. [17], identified various factors responsible for variation in the calculation of embodied energy of materials which were considered by the author and also developed the embodied energy index of various common materials further used in the study area [18] and the same has been used in the present study also. Gago et al. [19] developed an energy model for the residential sector in Andalusia, Spain considering lighting energy by using physical characteristics and energy use pattern of the house. Kjaerbye et al. [20] studied the effect of the building regulations on energy consumption in single-family houses in Denmark using building characteristics, socioeconomic parameters, and weather data to determine the buildings energy consumption for heating using natural gas over different periods of time (before, after changed regulations). Similalry, a methodology was developed to determine the energy consumption pattern using energy performance classification of residential stock of Hamirpur [21]. Andersen & Sattrup [22] studied the impact of the height/width ratio of buildings located in an urban street with the energy use for heating, daylighting, ventilation, and cooling in a building. Similarly, Ratti et al. [23] studied the relationship between energy use and urban texture of a typical cluster of 3 cities namely London, Toulouse, and Berlin. It was found that energy use is not only dependent on building design, systems used in building & their efficiencies, and occupational behavior, but also on urban geometry; as it was found affecting the solar gain and daylight of the building. Hence, the surrounding physical characteristics are included in this study. Kaza [24] used RECS 2005 data of 4382 houses and found that household space heating and cooling energy use is dependent on housing type than on housing size. Hence, the possible house types were considered in this study. Monteiro et al. [25] suggested using the Life Cycle Energy Analysis rather than the most preferred Operational Energy Analysis, which evaluates the household for energy consumption. Further, in this study, a new house was compared with the existing 25 years old house having improved building envelope conditions in the Portuguese context using the Life Cycle Energy method. It was found that the new design saves more energy than the old design. It is seen that in Life Cycle Analysis, most commonly two forms of energy are considered: embodied and operational for a certain life span of building [26, 27, 28], that is for 50 years.
Mass housing at Hamirpur
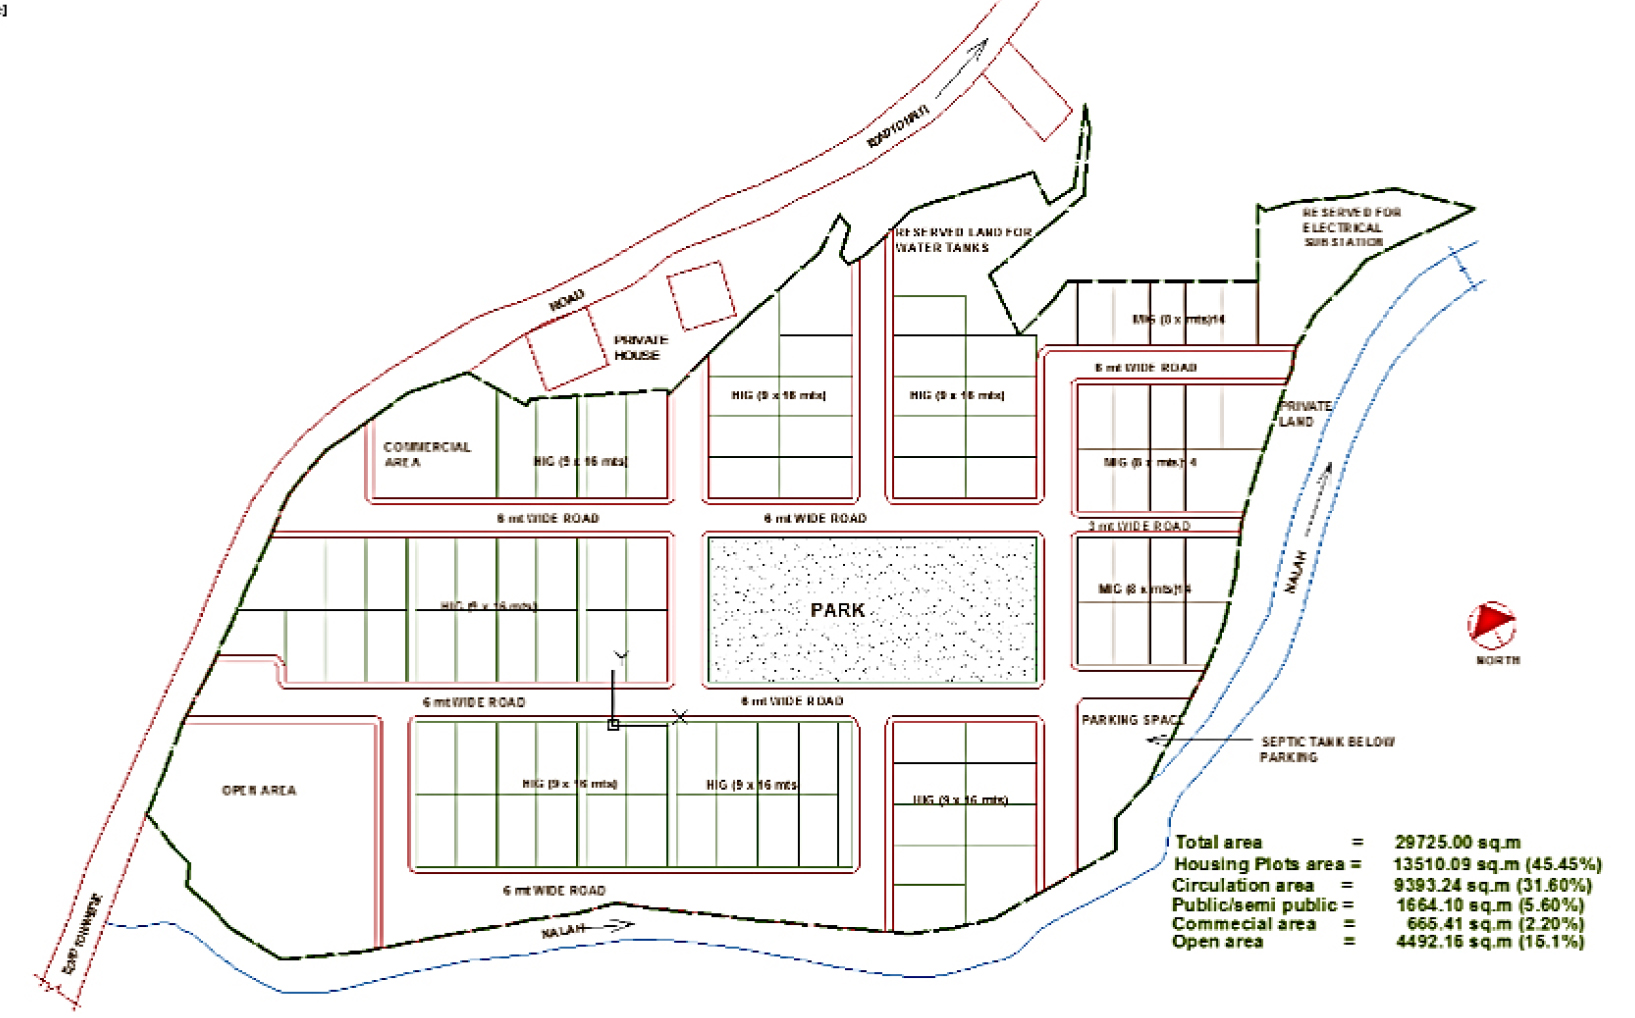
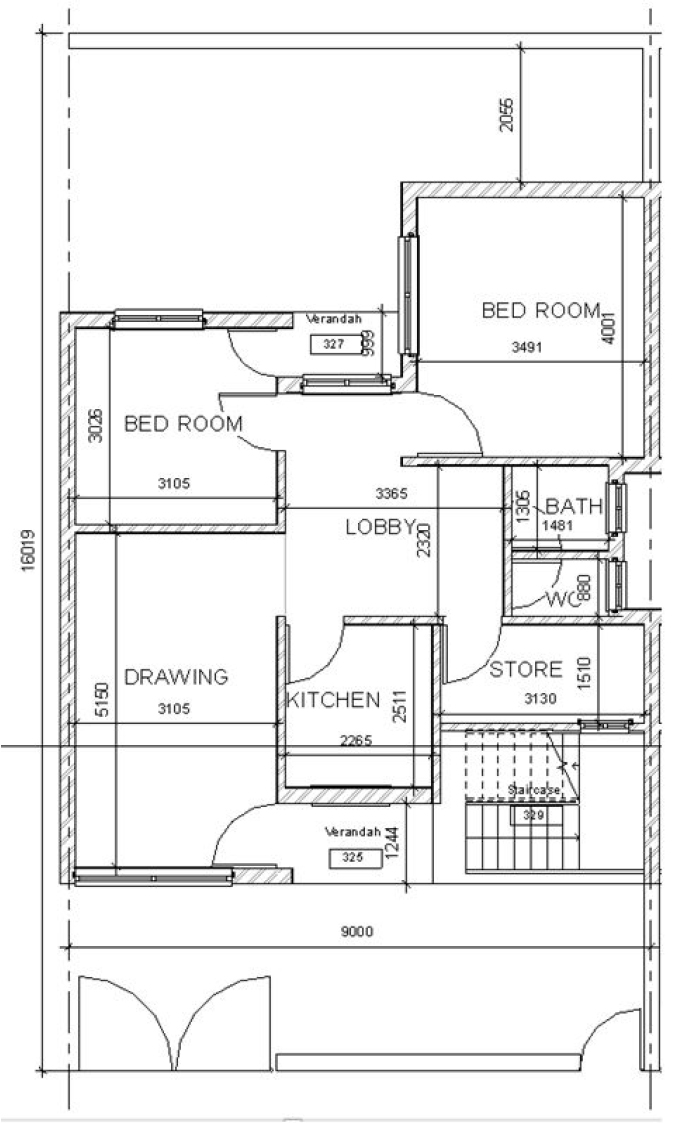
The housing colony at Nayanagar comprises 93 houses, designed and developed by HIMUDA (Himachal Pradesh Housing and Urban Development Authority) and sold to individuals. It consists of 70 High Income Group (HIG) houses and 23 Middle Income Group (MIG) houses, having 2 access gates from the main road. The total site area is 29724.88 m2. The plot size of the HIG plot is 9 m x 16 m. and the MIG plot is 8m x 14 m. The site is sloping toward the southeast side. The specifications of a typical HIG house are shown in Table 1. The layout along with a land-use breakup is shown in Figure 2. Each house is a single-storied naturally ventilated building with front and rear setbacks of 3 m and 2 m respectively.
Table 1.
Specifications of a HIG house
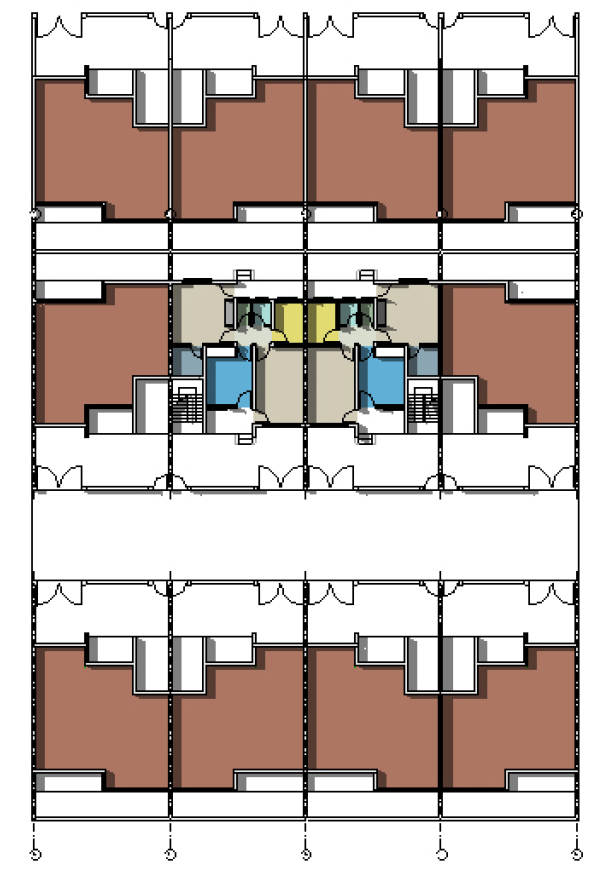
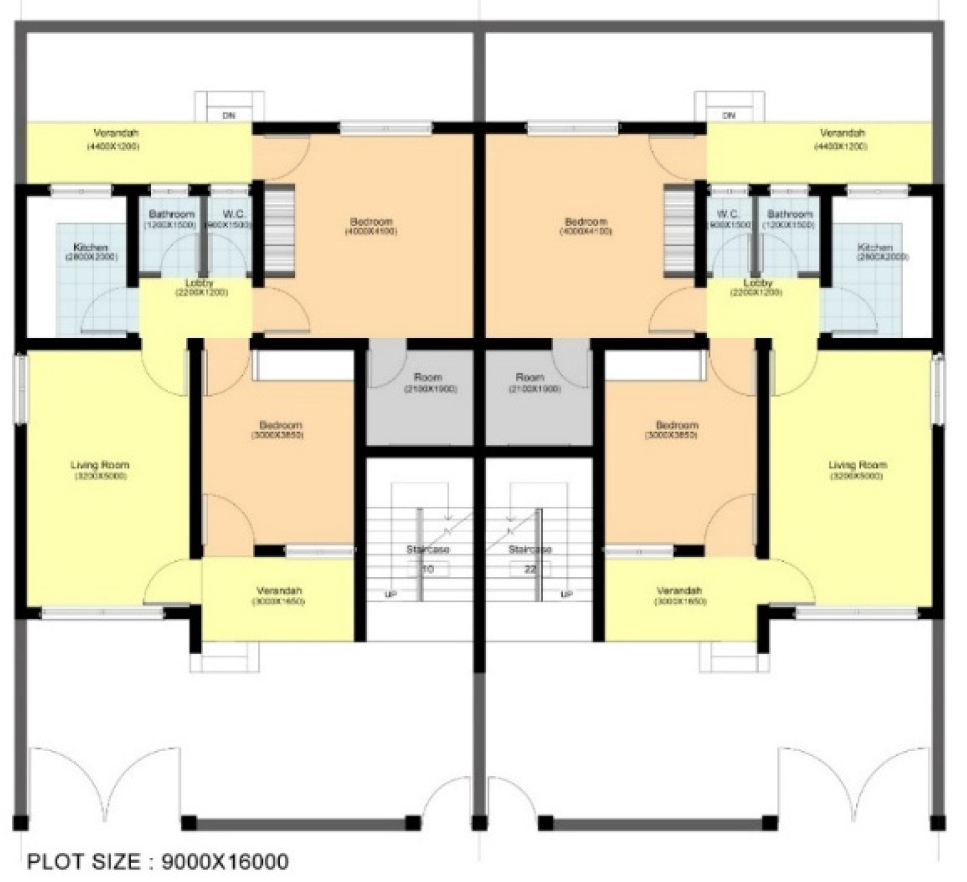
The typical cluster arrangement of HIG houses is shown in Figure 3. The typical plan of the pair of the house is shown in Figure 4.
Energy consumption pattern of existing mass housing at Hamirpur
As mentioned in the literature review, two types of energy are considered in this study, namely embodied energy and operational energy, and their respective procedure adopted are discussed one by one.
Embodied energy
The embodied energy of each building envelope material is calculated as mentioned in equation 1, as shown below.
Where,
= Initial Embodied energy of the building (MJ) and is calculated using equation 2, and
= Embodied energy for maintenance (MJ) and is calculated using equation 3
Where,
= Quantity of material (m2 or m3)
= Embodied energy of the material (MJ)
Where,
= Quantity of material required for maintenance (m2 or m3)
= Embodied energy of the material (MJ)
= Maintenance Span in years (as per maintenance schedule)
The maintenance schedule considered for this study is that the structure does not require any maintenance throughout the life span of 50 years, except painting work that has to be undertaken every 5 years.
The embodied cost (CM) is calculated as per equation 4 below.
Where,
= Quantity of material (m2 or m3)
= Cost of material (Rs.)
Cost of materials and cost of initial construction
The cost of various identified building envelope assemblies is calculated from the Himachal Pradesh Schedule of Rates (HPSR) 2009 given by [29]. As the cost given here is for the year 2009 and hence, 25% extra is added to the mentioned cost to predict the present cost for the year 2021. In the absence of rates for some materials in HPSR, the market rates are taken. Considering the maintenance schedule, the total Life Cycle Embodied Energy and construction cost is determined and shown in Table 2.
Table 2.
The embodied energy of existing House
Operational energy
A survey was conducted using the interview method in which data was collected using a questionnaire from 12 houses (3 houses of each orientation). Data on one-day energy consumption, for four months each representing a season, of various appliances were recorded along with the appliance wattage to obtain monthly breakup of average energy consumption. Also, energy bill information was obtained from Himachal Pradesh State Electricity Board, so that the breakup calculated must be within 10% range of per day consumption as per day energy meter reading. The data obtained for all houses are shown in Table 3, and the average energy consumption breakup was obtained. The cost of one kWh operational energy is taken as Rs. 4.7.
Table 3.
Annual operational energy consumed in each house
| House No. | Annual operational energy breakup | Annual operational energy Total * (kWh) | Annual operational energy cost (Rs.) | ||||||
| LD (kWh) | LN (kWh) | H (kWh) | Hw (kWh) | C (kWh) | V (kWh) | M (kWh) | |||
| 1 | 98.55 | 234.51 | 547.5 | 538.38 | 547.5 | 2.63 | 972.76 | 2941.83 | 13826.6 |
| 2 | 34.68 | 88.97 | 0 | 116.34 | 45.63 | 1.64 | 333.06 | 620.32 | 2915.504 |
| 3 | 180.68 | 354.05 | 602.25 | 246.38 | 365 | 12.73 | 1120.55 | 2881.63 | 13543.66 |
| 4 | 70.26 | 167.9 | 109.5 | 150.56 | 228.13 | 16.43 | 731.83 | 1474.6 | 6930.62 |
| 5 | 73.91 | 24.18 | 0 | 77.56 | 228.13 | 0.12 | 354.78 | 758.68 | 3565.796 |
| 6 | 32.85 | 153.3 | 328.5 | 209.88 | 273.75 | 0 | 781.47 | 1779.74 | 8364.778 |
| 7 | 23.73 | 55.21 | 27.38 | 109.5 | 164.25 | 2.46 | 118.63 | 501.15 | 2355.405 |
| 8 | 53.38 | 73 | 219 | 219 | 120.45 | 0.16 | 353.5 | 1038.5 | 4880.95 |
| 9 | 53.84 | 93.53 | 219 | 212.16 | 182.5 | 0.16 | 199.29 | 960.48 | 4514.256 |
| 10 | 37.41 | 70.26 | 147.83 | 383.25 | 219 | 0.16 | 250.85 | 1108.76 | 5211.172 |
| 11 | 44.71 | 121.82 | 82.13 | 355.88 | 182.5 | 0.16 | 312.44 | 1099.64 | 5168.308 |
| 12 | 38.33 | 253.68 | 164.25 | 504.16 | 775.63 | 8.21 | 759.2 | 2503.44 | 11766.17 |
Alternative designs for existing mass housing
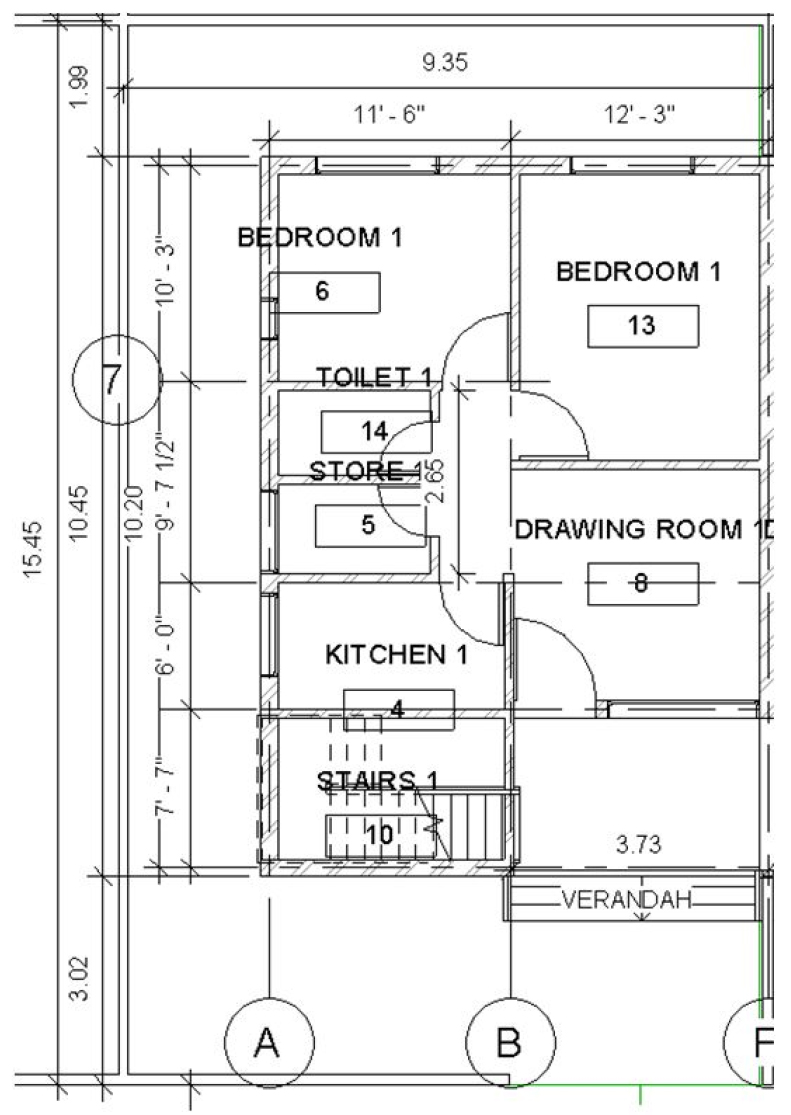
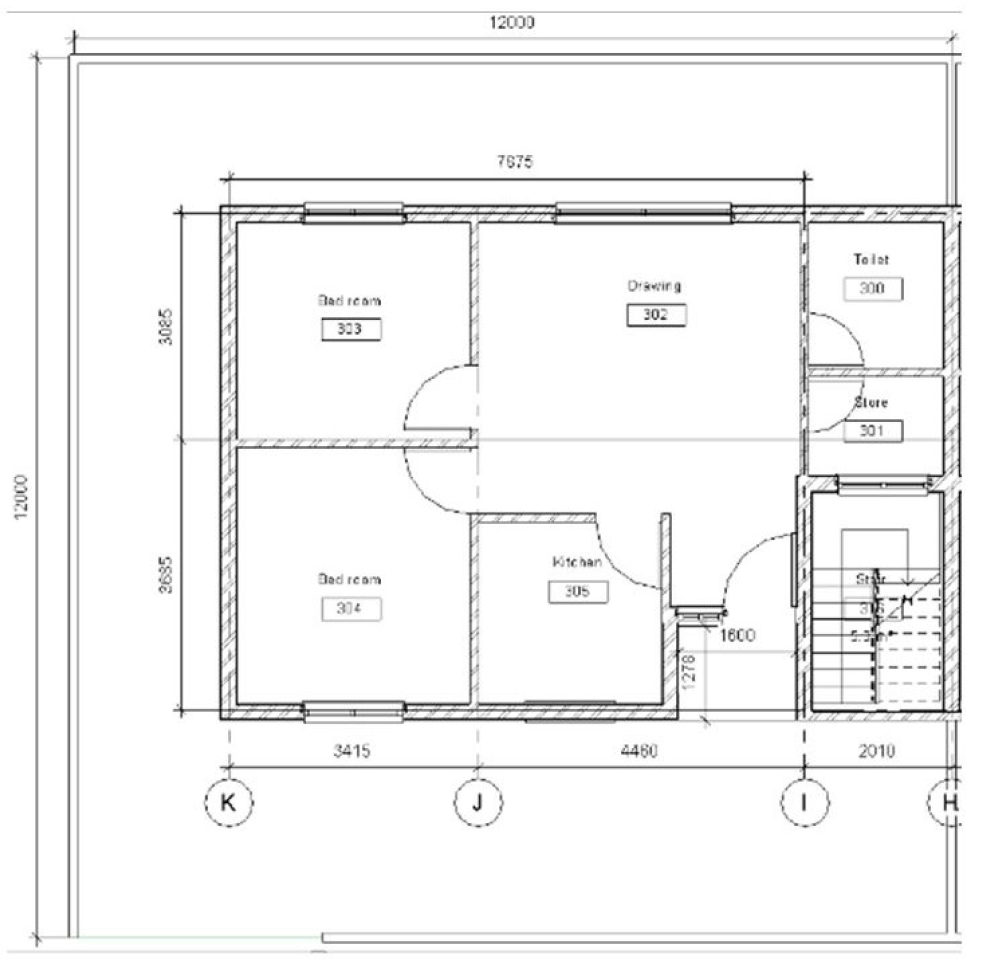
The plot size of the existing HIG house was 144m2 and the same is considered for three other comparable alternatives as per details given in Table 4.
Table 4.
Details of alternative designs.=
| S. | Case | House Type | Plot size (length x width in m) | Room sizes | Built up Area (m2) | Exposed Surface area (m2) | Volume (m3) | Compactness ratio | Exposed Walls area (m2) | Window area (m2) | WWR |
| 1. | Base case | Row house | Plot size -144 m2 (16X9 m2) | As per details in Figure 3 | 122.8 | 347 | 369.8 | 0.94 | 119.6 | 20.9 | 0.17 |
| 2. | Alternative-1 | Row house | Plot size -144 m2 (16X9 m2) | Same number of rooms and room sizes | 146 | 326.8 | 424.5 | 0.77 | 93 | 23.2 | 0.25 |
| 3. | Alternative-2 | Semi detached | Plot size- 144m2 (15.45X9.35 m2) | 120.9 | 301.6 | 363.1 | 0.83 | 97.1 | 22.2 | 0.23 | |
| 4. | Alternative-3 | Semi detached | Plot size-144 m2 (12X 12 m2) | 109.6 | 356.3 | 328.6 | 1.08 | 152.4 | 18.8 | 0.12 |
The designs of all cases are shown in Figure 5 to Figure 7.
Embodied energy and cost of alternatives
The embodied energy and cost of all the alternatives are calculated and presented in Table 5. The material specification is considered the same as in the existing house.
Table 5.
Embodied energy and construction cost of the alternatives
| Alternative-1 | ||||||
| Assembly | Area (m2) | Embodied energy/unit assembly (MJ) | Total Life Cycle Embodied Energy (MJ) | Construction Cost/unit | Total construction cost (Rs.) | |
| Wall | Brickwork | 252.00 | 2526.40 | 636652.62 | 5519.67 | 1390957.88 |
| Painting | 504.00 | 32.00 | 322560.00 | 72.50 | 365400.00 | |
| Windows* | 23.22 | - | 14574.37 | 247431.11 | ||
| Floor | 178.00 | 425.39 | 75719.20 | 1187.74 | 211417.11 | |
| Roof | 205.00 | 353.97 | 72563.75 | 1400.31 | 287063.55 | |
| Total | 1122069.94 | 2502269.65 | ||||
| Alternative-2 | ||||||
| Assembly | Area (m2) | Embodied energy/unit assembly (MJ) | Total Life Cycle Embodied Energy (MJ) | Construction Cost/unit | Total construction cost (Rs.) | |
| Wall | Brickwork | 166.09 | 2526.40 | 419600.96 | 5519.67 | 916743.67 |
| Painting | 332.17 | 32.00 | 212590.79 | 72.50 | 240825.51 | |
| Windows* | 22.19 | - | 13600.93 | 0.00 | 265776.31 | |
| Floor | 155.10 | 425.39 | 65978.34 | 1187.74 | 184219.48 | |
| Roof | 197.64 | 353.97 | 69959.50 | 1400.31 | 276761.09 | |
| Total | 781730.52 | 1884326.05 | ||||
| Alternative-3 | ||||||
| Assembly | Area (m2) | Embodied energy/unit assembly (MJ) | Total Life Cycle Embodied Energy (MJ) | Construction Cost/unit | Total construction cost (Rs.) | |
| Wall | Brickwork | 182.40 | 2526.40 | 460815.23 | 5519.67 | 1006788.56 |
| Painting | 364.80 | 32.00 | 233472.00 | 72.50 | 264480.00 | |
| Windows* | 18.79 | - | 11471.05 | 0.00 | 240524.36 | |
| Floor | 140.70 | 425.39 | 59852.20 | 1187.74 | 167114.54 | |
| Roof | 174.20 | 353.97 | 61661.49 | 1400.31 | 243934.00 | |
| Total | 827271.97 | 1922841.46 | ||||
Operational energy consumption of alternatives
The operational energy of alternative designs is determined using energy simulation software named Autodesk Ecotect 2011. The thermal comfort range adopted for this study is 18.9°C to 27.9°C, the weather file used is as determined by the author [26] and the simulation parameters are used as mentioned by the author [21, 30]. It is assumed that the change in design does not impact the energy demand for hot water, ventilation, and appliance consumption and hence is considered constant in all alternative designs. The calculated data are presented in Table 6.
Table 6.
Operational energy consumption of alternative design
| Case | LT (kWh) | H (kWh) | Hw (kWh) | C (kWh) | V (kWh) | M (kWh) | Annual operational energy Total (kWh) | Life Cycle | |
| Operational energy | Cost @Rs. 4.7/kWh | ||||||||
| Existing house | 61.9 | 203.9 | 277.7 | 260.3 | 37.3 | 524 | 1365.1 | 68255 | 320798.5 |
| Alt-1 | 11.4 | 165 | 277.7 | 239.1 | 37.3 | 524 | 1254.5 | 62725 | 294807.5 |
| Alt-2 | 28.7 | 240.2 | 277.7 | 191 | 37.3 | 524 | 2619.6 | 130980 | 615606 |
| Alt-3 | 82.8 | 703.1 | 277.7 | 1148.2 | 37.3 | 524 | 2773.1 | 138655 | 651678.5 |
Results and Discussion
Embodied energy and cost
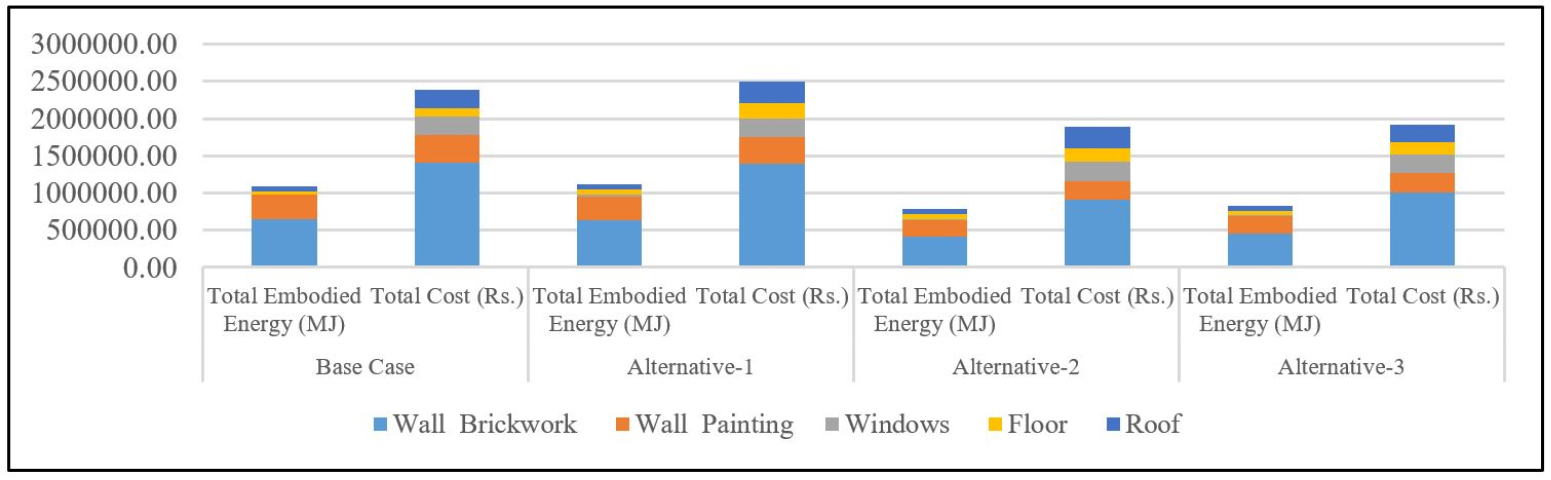
The total Life Cycle Embodied energy and total construction cost of all designs is calculated and the comparison is presented in Figure 8.
It is seen in Figure 8 that in alternatives 1, 2, and 3; total embodied energy is 103.41%, 72.05%, and 76.24% to the base case, whereas total construction cost is 104.81%, 78.92%, and 80.54% respectively. It is seen that even with the use of the same materials in all alternatives; the increase in embodied energy percentage is not proportionate to the increase in the total cost of all cases. Further, it is seen that the total embodied energy is proportional to the built-up area, whereas the same is not true for exposed surface area, volume, compactness ratio, and WWR.
Operational energy and cost
The breakup of operational energy and Life Cycle Operational Energy & Cost is shown in Figures 9 and 10 respectively.
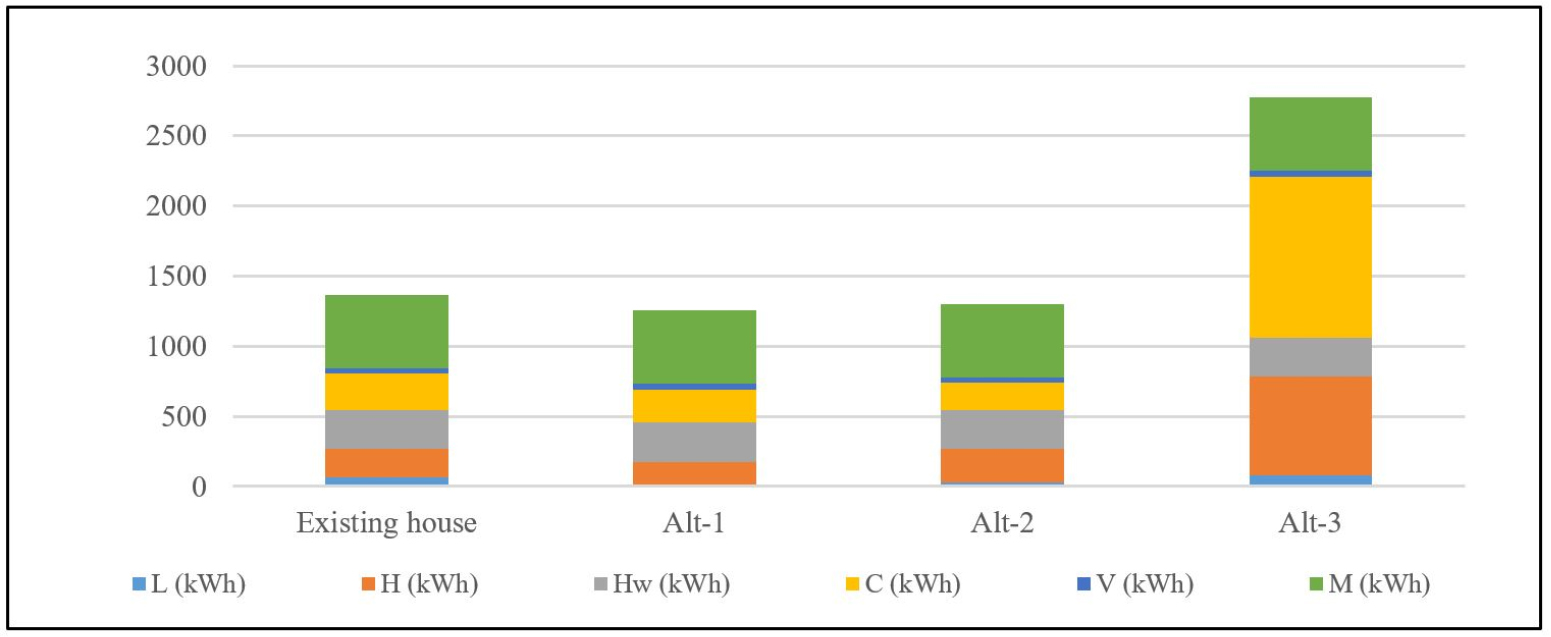
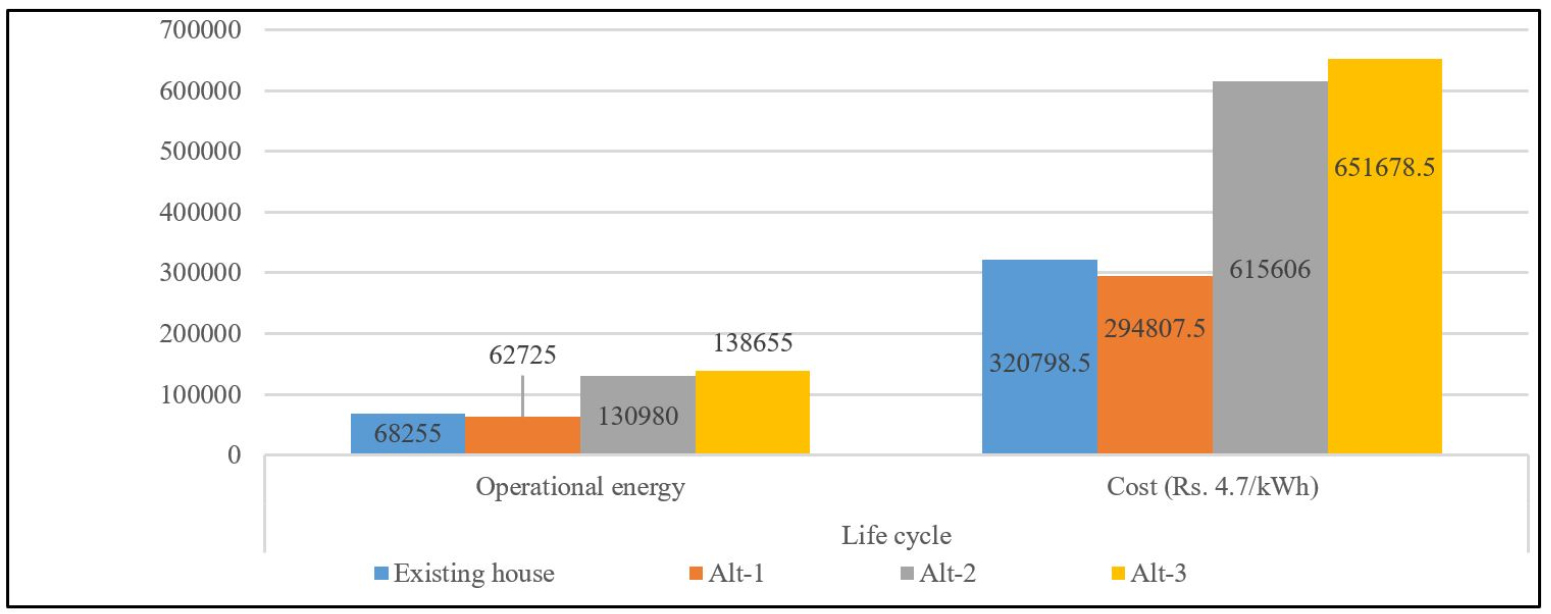
The energy used in lighting in the base case is 61.9 kWh whereas the same has been reduced to 11.4 kWh (18.4%) and 28.7 kWh (46.4%) in alternative-1 and 2 respectively whereas it has increased to 82.8 kWh (133.8%) in alternative 3. The heating energy in alternative-1 has been reduced to 80.9% as compared with that of the base case whereas it has been increased to 117.8% and 344.82% in alternative- 2 and alternative-3 respectively as compared to the base case. The cooling energy has been reduced to 91.9% in alternative-1 and 73.38% in alternative-2 as compared with that of the base case respectively whereas it has been increased to 441.1% in the alternative- 3 (compared with base case). The total energy consumed together by lighting, heating, and cooling has been found reduced to 78.96% and 87.4% in alternative-1 and alternative-2 whereas it increased to 356.24% in alternative-3. The total Life-Cycle Operational Energy is found lowest in alternative -1 (91.9%) whereas it is highest in alternative-4 (203.14%). Similar is the trend for operational energy cost as it is directly proportional to the energy consumption.
Life Cycle Energy and cost
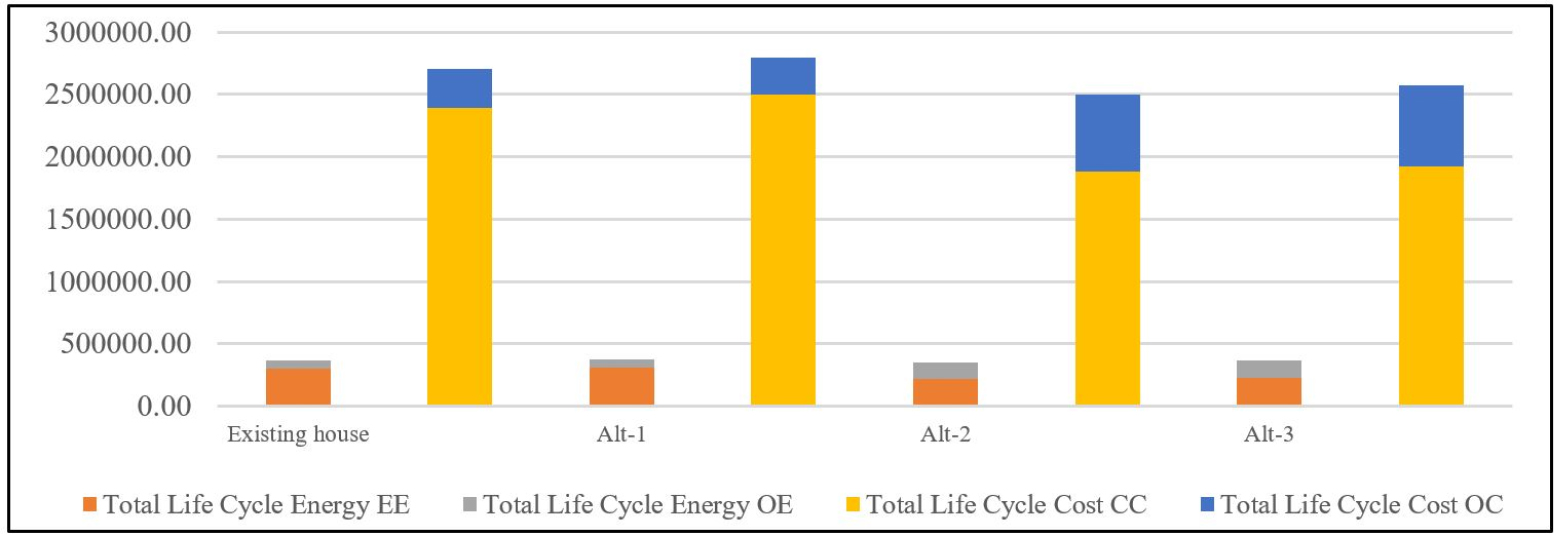
The Total Life Cycle Energy and Cost of all cases are presented in Figure 11. The embodied in MJ has been converted to kWh (1MJ= 0.278 kWh) for comparison.
It is seen that the total Life Cycle Energy of the existing house is 369896.45 kWh whereas it is 101.29%, 94.16%, and 99.66% for alternative-1, alternative-2, and alternative-3 respectively. It is lowest in alternative-2, since the overall proportion of Life Cycle Embodied Energy is more (62.39%) than operational energy (37.61%), even though the same consume 191.89% operational energy than the existing house. It is seen in Figure 11 that the proportion of embodied energy and operational energy in the existing house is 81.55% and 18.45% respectively. However, it is 83.26% and 16.96% in alternative-1 and 62.39% and 37.61% in both alternative-2 and alternative-3 respectively. Hence, it is clear that embodied energy contributes much more than operational energy in naturally ventilated residential buildings. Also, the change in design results in huge variations in the embodied and operational energy and their proportion to the total LCE.
Conclusions
Considering the Life Cycle Analysis, it is seen that alternative-3 consumes the least energy, even though the same is found to be consuming more operational energy than the existing house. Hence, it is important to consider the Life Cycle Energy Analysis than the usual Operational Energy Analysis. However, it is seen that the Embodied Energy Analysis and Life Cycle Energy Analysis must be performed for the naturally ventilated buildings, as the proportion of embodied energy is much higher than operational energy.
It is found that the operational energy use in a building is not a function of the built-up area, whereas it is more dependent on the compactness ratio. Since the solar heat gains, heat losses, and daylighting are also dependent on the exposed surface area along with its built-up area. Buildings with compact shapes consume lesser energy as their exposed area is lesser. Hence most compact buildings shall be designed. It can be said that the total energy consumption is directly proportional to the compactness ratio.
The compactness ratio greatly affects the heating and cooling load of a building whereas the lighting load is affected by the Window to Wall Ratio (WWR). Higher WWR provides better daylighting but excessive heat gains, heat losses, and unwanted glare. In this context, therefore, determining the uppermost desirable WWR is a scope of further research. The total embodied energy and cost are proportional to the built-up area. Hence, the total built-up area of the proposed development shall be less.
