

Evaluation of Urban Fabric
The Abstraction of the City
Indicators System
A synthetic Index of Sustainability
Automation
Conclusions
Evaluation of Urban Fabric
“Measure what is measurable, and make measurable what is not so” - Galileo Galilei
The city is, among other definitions, a spatial and relational phenomenon, the most comprehensive work of human activity (Whitman cited in Chueca, 2011, p.19). It is a scene of life, so that understanding it means approaching its inhabitants. Therefore, the desire to study the city represents an act that involves tackling its immense complexity, observing its parts and abstracting the different layers that constitute it.
La ciudad es esto (Hermida et al., 2015a) proposes a tool for measuring and comparing urban sustainability taking as a main issue housing densification and intensification of uses. Besides, this tool considers the different variables that affect urban life and mobility, green infrastructure and social cohesion (Hermida et al., 2015b, p. 29). In fact, compact city is assumed as a sustainable urban model and densification as a key variable for analysis.
The Abstraction of the City
Due to the expansive growth of cities and their wasteful consumption of resources it is necessary to measure their ability to face these pressures (Cabrera et al., 2015). The dispersed city has failed as urban model (Arbury, 2005) and its effects require a change of course. For this reason cities should look at themself to assess how much they have deviated from the compact model, which defends cities with a greater sense of community, mixed and walkable uses, higher densities, more space for its inhabitants and less for the car (Lehmann, 2010). It is necessary to measure how the city resembles the compact and diverse model and thus demonstrate urban sustainability (Rueda, 2008). With this in view techniques of spatial representation GIS (geographic information systems), that integrate mapping and information resources allowing the organization, storage, analysis and modeling of large amounts of geo-referenced data (Olaya, 2011) are used. Drawing on these data it is possible to create indicators represented in layers of geographic information that may overlap to measure urban sustainability addressing spatial heterogeneity.
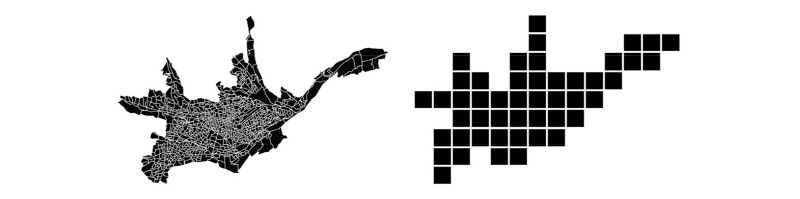
While GIS tools are useful and maps are essential to navigate and locate boundaries and landmarks, some representations are inefficient to visualize and communicate information as the visual impact of data displayed in a spatial way is influenced by the way space is divided (London Data Store, 2015). Irregular divisions of cartographic maps carry the “modifiable area unit problem” MAUP (Openshaw, 1981) due to the variability of spatial boundaries and the lack of a regular unit area which present spatial and statistical calculations (densities, proportions, etc.). To reduce the visual impact and to maintain possibilities of comparative analysis a regular grid is chosen. This divides the territory analyzed in uniform cells (Figure 1). The grid is dimensioned according to the average area of a city block and its cells contain at least 4 blocks. In the case of Cuenca-Ecuador, the cells are sized 200 m × 200 m (Hermida et al., 2015a, p. 35).
Indicators System
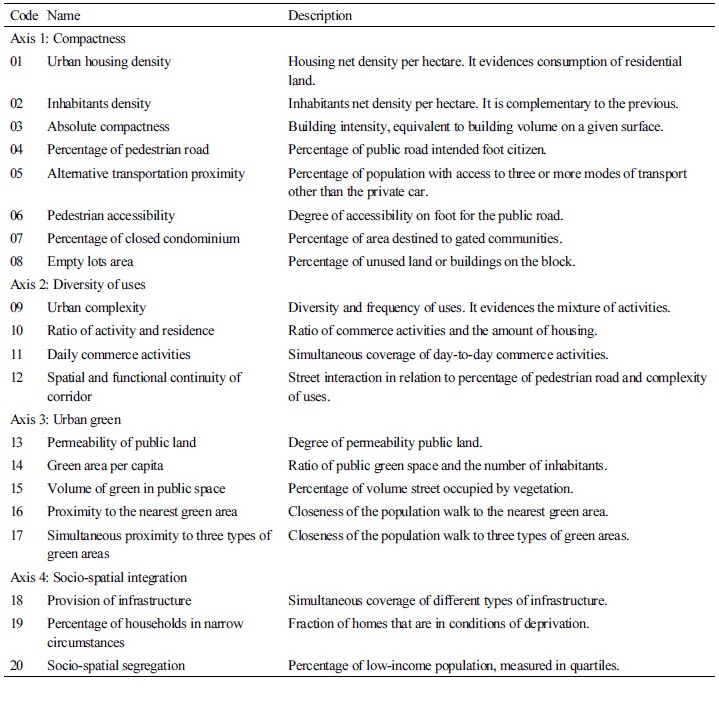
The construction of this system uses at a starting point 52 indicators extracted from the indicator system for large and medium-sized cities (Agencia de Ecología Urbana de Barcelona & Red de Redes de Desarrollo Local Sostenible, 2009), and the environmental sustainability indicators plan of Seville (Rueda, 2008). From these studies 20 indicators are proposed, which are adapted to the city of Cuenca and organized into four axes: 1) compactness, 2) diversity of uses, 3) urban green, and 4) socio-spatial integration (Table 1) (Hermida et al., 2015a, p. 36). The criteria for the selection and development of these indicators are based primarily on relevance, cost of production and information value. In this sense the existence of updated cadastral data to reduce the cost in obtaining information becomes fundamental.
A synthetic Index of Sustainability
After the building of these 20 urban sustainability indicators, the Sustainable Urban Densification Index is proposed by obtaining four sub-indexes (Table 2). These in turn are built from 9 of the 20 indicators.
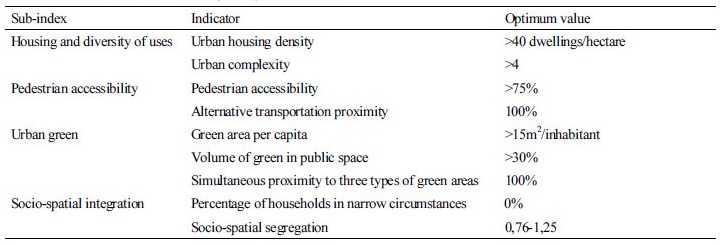
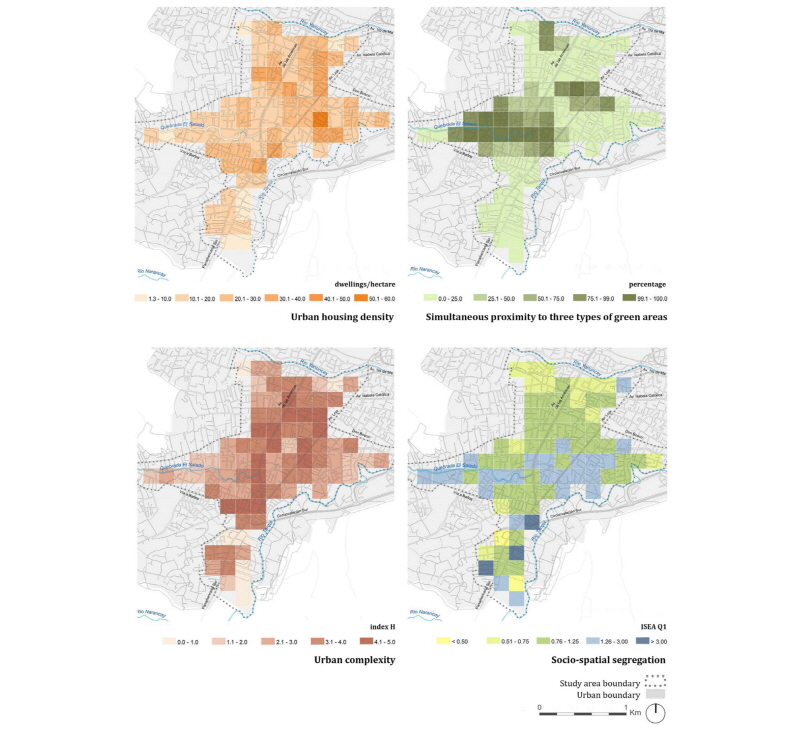
The Sustainable Urban Densification Index represents the relative valuation of sustainability in terms of density and composition through the four sub-indexes, allowing a global reading and facilitating comparisons. Additionally, the results are normalized to values from zero to one, with zero being the lowest and 1 the highest value of sustainability (Hermida et al., 2015a, p. 123). The index and the values of these indicators are represented through the regular grid of 200×200 mm (Figure 2).
Automation
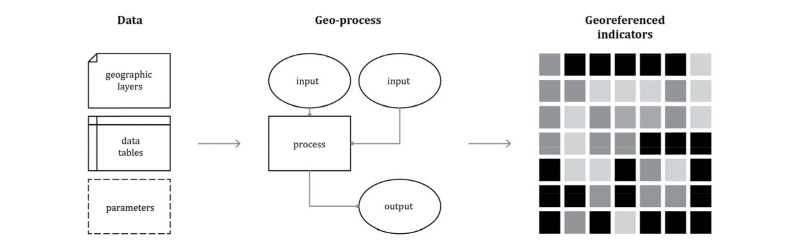
The calculation of the indicators and the index is automated within GIS, using process flows that take data entry, stored inside geographic layers and Tables, perform spatial aggregation operations, overlay, execute statistical calculation and produce results which are referenced to each grid cell (Figure 3). A tool for calculating each indicator and a tool for calculating the Sustainable Urban Densification Index using ArcGIS 10.3 has been implemented. These tools are clustered in a “Toolbox” and can be executed through a friendly graphical user interface or through a command line that allows greater flexibility.
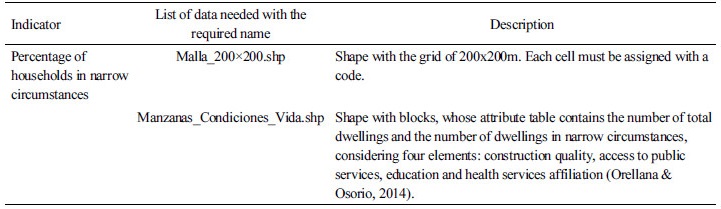
To use the tools, a data structure is required so the names and locations of the input files should be standardized according to a table in the Toolbox. Table 3 shows an example of the input data required for the calculation of an indicator.
Table 3. Required information for calculating the indicator “Percentage of households in narrow circumstances” |
|
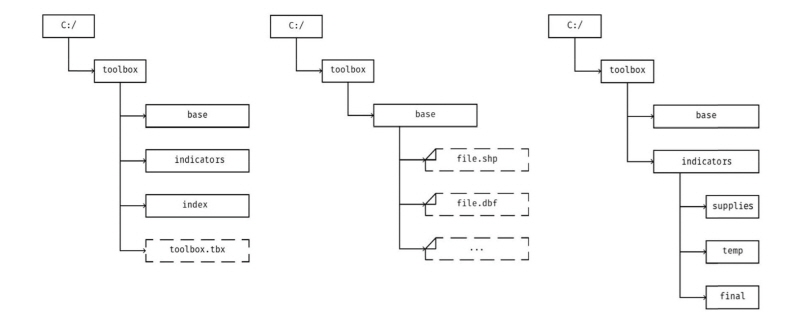
The files generated by each tool are automatically placed in a folder output structure depending on the indicator or index, which includes: a) the original files of each indicator; b) the intermediate files generated by geo-processes; and c) the final file that corresponds to the spatial representation of the values obtained for each indicator (Figure 4).
To calculate the index, results of 9 indicators are required; therefore it is necessary to run the tools to calculate each indicator first. In order to facilitate the use of the Toolbox, each automation process is accompanied by a management protocol -a detailed explanation of each indicator and suggested representation ranges-.
Conclusions
This automation process by using geographic information systems, aims to facilitate the evaluation of urban sustainability in terms of densification in different cities, using the same methodology, which allows comparison between different cities or different areas within the same city. The most important requirement of the proposed approach is the availability of the necessary input data, so the indicators intend -as far as possible- to use secondary sources available in local government, to avoid obtaining data in field. Therefore the result is partly dependent on the quality of information available, which is highly variable for Latin American cases.
The proposed Toolbox has been developed in such a way that allows the parameterization of the calculations and representation ranges, enabling the adaptation of the optimum values for different assessment approaches. This feature makes it a useful tool for a well informed and evidence based debate about different ways of assessing the parameters that affect sustainability, especially in terms of densification.
The Toolbox, a set of demonstration data, a tutorial and research documents are publicly available to all individuals and institutions. The next step in this line of work consists of the implementation of this tool in open source software as an effort to democratize access and use of information and public debate on the decision-making around our urban spaces.
