

Introduction
Material and Methodology
Target Region
LCZ Mapping of Rabat
Landscaping Patterns
Microclimate Simulations
Validation of ENVI-met
ENVI-met Model Configuration
Results and Discussion
Microclimate Parameters Distribution and Variation Analysis
Mean Radiant Temperature Distribution and Variation Analysis
Outdoor Thermal Comfort Perception
Conclusion
Introduction
According to the 2014 revision of the World Urbanization Prospects by the United Nations, more than 54% of the terrestrial population lives in an urban area, and up to 75% is projected to reside in cities of different sizes by 2050 [1]. Urban fabric affects the climate elements, namely solar radiation, air temperature, humidity, and wind. It acts as a climate modifier. The impact of increasing urbanization on environmental quality is a result of its functions (the energy usage, transportation, and generation of waste products) and its physical form (i.e., the construction materials, the land cover, and the geometry of buildings).
The impact of urban morphology on outdoor thermal comfort has been widely reported. However, only some studies have inquired into environmentally-conscious urban design to contribute to developing recommendations and guidelines valid for decision-making by urban planners and designers.
Modeling urban microclimate is becoming increasingly essential for the design of the city and the neighborhoods [2]. The development of simulation tools and their articulation with the databases describing with more accuracy the parameters of the urban microclimate allow better knowledge and understanding of the effects of the urban morphology on the urban microclimate [3]. Coupling the geographical mapping approach LCZ scheme [4, 5, 6] and the microclimate CFD-based model ENVI-met, several relevant studies results have been established [5, 6, 8, 9]. Two main approaches can be distinguished from the literature review, the first one aims to assess the impact of the geometric and surface cover parameters on urban microclimate and outdoor thermal comfort [6, 7, 8, 10, 11], and the second one attempts to generate dynamic and actual boundary conditions for the microclimatic model [12, 13].
Several proposals have emerged concerning the eco-districts characteristics, social diversity, the substitution of fossil fuels for renewable energy, and vegetation. The present case study aims to assess a mixed urban tissue as the suitable choice for future eco-neighborhoods in the sub-humid climate of Rabat. It tries to bridge between theoretical and empirical scientific results and practical design strategies by analyzing the impact of the current urban planning characteristics and district typologies on the improvement of outdoor thermal comfort and the mitigation of the Urban Heat Island in Moroccan cities. Since urban development plans are based solely on administrative data concerning regional distributions, urban zoning in Morocco is based on the primary use of districts or the nature of the dominant activities.
Material and Methodology
Target Region
Rabat is the capital city of Morocco (34.013 N, 6.49 W, 46 m.a.s.l). It is located in the Atlantic Coastal zone from Tangier to Safi with a Temperate Climate and an average temperature between 12°C and 23°C, a minimum temperature of 0 to 5°C and a maximum of 30 to 38°C, the average annual rainfall from 500 to 600 mm and winds generally from north and west, moisture-bearing and salt content proximity to the sea. Rabat is a city with vast homogeneous territories and steady development derived directly from the Urban Planning Plans. Rabat is composed of 5 districts with different urban tissue. The medina is a traditional tissue. It is highly dense, including homes, shops, services, and even small public spaces.
LCZ Mapping of Rabat
The LCZ Generator is an online tool that allows mapping a city of interest using LCZ classification from a valid training area file and some metadata as input. It also provides an automated accuracy assessment of produced cartographies [15]. The LCZ cartography of Rabat is generated and controlled with a computerized control process (see Figure 1). The weighted accuracy ratio of the LCZ map of Rabat achieved is 0.88, the overall accuracy of the built vs. natural LCZ classes is 0.92, and the overall accuracy is 0.55, which is an acceptable accuracy level [16].

Landscaping Patterns
We focus on six residential sites. Four areas from compact high-rise LCZ1, compact mid-rise LCZ2, compact low-rise LCZ3, open mid-rise LCZ5, open low-rise LCZ6, and a particular case of a mixed district, the eco-neighborhood is organized on dispersed blocs of buildings around open public spaces, this porous form with the heterogeneity of building height (5 or 7 or 9 floors) and areas of individual villas (2 floors and small private garden). This pattern is considered LCZ4/LCZ6. The case from LCZ3 is a particular case. The historical tissue is characterized by different thicknesses and materials of building walls (1 m of raw earth brick), no apparent vegetation, high compactness, and very narrow streets. Studying this particular historical morphology is interesting because it is still a part of all Moroccan cities. Table 1 shows the features of each area and calculated morphological indicators per precinct.
Table 1.
Some characteristics and indicators of the targets sites


Microclimate Simulations
ENVI-met is a three-dimensional CFD model that simulates different interactions in urban environments [17]. Buildings, surfaces, and vegetation in the target area are represented in the 3D main model on a grid with a typical resolution of 0.5–10 m. ENVI-met core calculates wind speed and direction, air and soil temperature, air and soil humidity, turbulence, radiative fluxes, gas, and particle dispersion using a 3D meteorological holistic model [18]. It also provides the calculation of Tmrt and some thermal comfort indices, notably Predicted Mean Vote (PMV) [17]. Tmrt is the area-weighted temperature in an imaginary enclosure of the radiant heat transfer of all the objects surrounding the human body. See equation 1:
It is a useful concept as it strongly influences thermos-physiological comfort indexes. ENVI-met gives a good approximation of this physical quantity at street level, and the surrounding environment is divided into the building surfaces, the ground surface, and the sky. Longwave radiation fluxes are 50% from the upper hemisphere and 50% from the ground. The Tmrt is expressed for each grid point (x) [17] as:
σ Stefan–Boltzmann constant (5.67×10⁻⁸ W/m2 K4 )
ε emissivity of the human body (0.97)
α absorption coefficient of short wave radiation
Dt direct irradiance
Rt reflected and diffusely reflected solar radiation
Lt long-wave radiation component, is expressed as a function of SVF.
The comfort index PMV is calculated using the formulation:
Where: 0.028 and 0.303 empirical-based fitting coefficients.
M/ADu produced mechanical energy related to 1 m2 of skin, depending on the physical activity.
H/ADu internally produced energy not used for mechanical work
Ed vapor diffusion directly through the skin
Esw cooling effect of sweat evaporating
Ere breathing energy loss due to humidifying the air
L breathing sensible heat exchange
R radiative energy balance of the human body (clothes)
C turbulent convection heat is exchanged directly with the ambient air.
The PMV is calculated as a male reference person and 35 years old, with a height of 1.75 m and a weight of 75 kg. For this case, the average walking is about 1.4 m/s. Thus, the energy exchange factor is about 93 W/m2, and the mechanical factor is null, based on ENVI-met online manual [18]. In the summer, generally, clothes are light and composed of trousers and short sleeves of a t-shirt. Thus, 0.65 is taken for the clo-value based on the calculation method [19, 20].
Validation of ENVI-met
The model initially developed for temperate climate zones has been successfully validated in several climates [21, 22, 23, 24]. Previous research has assessed the accuracy of the ENVI-met model in the climate of Morocco using the results of the experimental campaign of Johansson in 2006 [25, 26]. The observed temperatures were compared with modeled temperatures registered in modern residential neighborhoods on summer and winter days [26], and the results were satisfactory. Three street canyons are selected from LCZ1, LCZ2, and LCZ6 to validate the model experimentally in the climate of Rabat. The measurements were carried out continuously for 24h using weather station PCE-FWS-20 installed respectively on July 5th, 8th, and 11th, 2020, in the tree sites. Air temperature is recorded in the positions shown in Figure 2, the center of each zone.

The station was installed at 1.4 m high. It is the same high used for the simulation results analysis. Tables 2 and 3 tabulate different parameters for the model configuration.
The coefficient of determination (R square) characterize the correlation between simulated and measured values, while Root Mean Square Error (RMSE) is a standard way to measure the error of a model in predicting quantitative data. It is defined as follows:
Table 2.
Materials properties of simulated zones
| Materials Properties | Wall | Roof | Road |
| Heat transmission (W/m2.K) | 1.7 | 2.2 | - |
| Albedo (-) | 0.3 | 0.15 | 0.1 |
| Emissivity (-) | 0.85 | 0.85 | 0.94 |
| Thickness (m) | 0.2 | 0.2 | - |
Table 3.
Input parameters for simulations configuration
The level of uncertainty for the ENVI-met 4.4.2 model, represented by the RMSE in %, is 0.53 (2 % of the air temperature average value in LCZ1), 0.85 (3 % for LCZ2) and 0.54 (2% for LCZ6). These results indicate that the model best matches the experimental data as indicated by the RMSE values and confirmed by the significantly higher R² values (see Figure 3). Consequently, the accuracy of the predictive model of the urban microclimate in Rabat is sufficient, and it will, therefore, be used to determine the microclimate and bioclimatic parameters in the six local climatic zones during the hottest period of the year.

ENVI-met Model Configuration
The metrological data recorded by the metrological weather station RABAT SALE INTL between 1990 and 2014 is used to calculate the design conditions. According to the temperature records, July is the month with extremely high temperatures. July 11th is chosen as a simulation day. It represents the extreme temperature records during the last year.
ENVI-met is run for 24h on July 11th, 2020, a typical summer day with low temperatures of 22°C and high temperatures of 27°C, high humidity, no precipitation, and no cloud cover. The meteorological input data and the properties of the material of walls, roofs, and roads required for ENVI-met configuration are the same used for the model validation except for LCZ3. The studied area selected from LCZ3 is a historical district (Medina), and the materials differ from modern tissue materials [25, 26]. Heat transmission is 0.65 W/m2.K for walls and 0.55 W/m2.K for roofs. Road albedo is 0.1, wall thickness is 1 m, and emissivity is 0.96 [27]. See 2D and 3D input areas of every studied pattern in (Figure 4).

The table below summarizes the mean characteristics and distribution of trees and low plants in the studied zones (Table 4). Leaf Area Density LAD is the portion of the leaf surface (m2) within a volume of air (m3). Like in most models, ENVI-met considers one-sided as active surface area [17].
Table 4.
The main characteristics and number of vegetation present in the simulated precincts
Results and Discussion
Microclimate Parameters Distribution and Variation Analysis
Figure 5 shows the hourly spatial average values of 2 m air temperature, relative humidity, wind speed, mean radiant temperature, surface temperature, and direct shortwave radiation. They are calculated using each grid cell except built ones. All scenarios exhibit comparable variability for different parameters during the day except the Medina tissue. It is due to the difference in inertia between the materials used in the two types of urban tissues (modern and traditional). The compact high-rise scenario is the warmest by daytime. Compact midrise is warmer than open midrise, followed by open low-rise, and finally, open high-rise, recording the same air temperature values with compact low-rise until 16h. the maximum is reached at 16h for all scenarios with 28.2°C for Z3, Z4, Z5, and Z6 and 29.6°C for Z2, and 30.8°C for Z1.
Z3 compact low-rise pattern recorded the highest relative humidity because of the high compactness of the urban tissue and very narrow streets. A noticed lowest wind speed value proves that there is a low level of natural ventilation in Z3. The wind speed for Z3 is about 0.8 m/s, which is lower than Z6 by about 0.3 m/s.
The impact of the shape of the urban fabric on wind speed in urban spaces is very complicated, knowing that it involves several factors at once: the orientation of the streets in relation to the wind direction, the roughness of the urban area determined by the height of the buildings, their dispersion and the number of high-rise buildings. Compact high-rise pattern records the highest value of wind speed, followed by compact midrise, open midrise, mixed zone, and open low-rise. Despite the height of the buildings of the mixed pattern Z4 (open high-rise and open low-rise), the dispersion of the buildings (SVF is 0.66) and the presence of a large number of tall trees arranged away from the buildings (28 trees of 20 m) made this fabric a moderate wind speed compared to the two midrise scenarios. It is also noted that especially as the wind speed is high, especially as the relative humidity is low, this is due to the effect of natural ventilation. The presence of vegetation and natural soil also impacts the water content in the air due to evapotranspiration. It is clearly shown that the open scenarios record a surface temperature and a quantity of direct shortwave radiation higher than compact ones. However, for the compact high-rise and mixed case, the impact of shading reverses inequality.
Regarding the radiation balance, we note that the amount of shortwave radiation received by MZ is significantly lower than that received by the two open tissues and the compact high-rise tissue. For the surface temperature, we see that for the mixed zone, the temperature is low until 14h. after it begins to increase but always remains lower than that recorded by the open areas. This is due to a shading effect favored by some buildings’ heights and their heterogeneity.
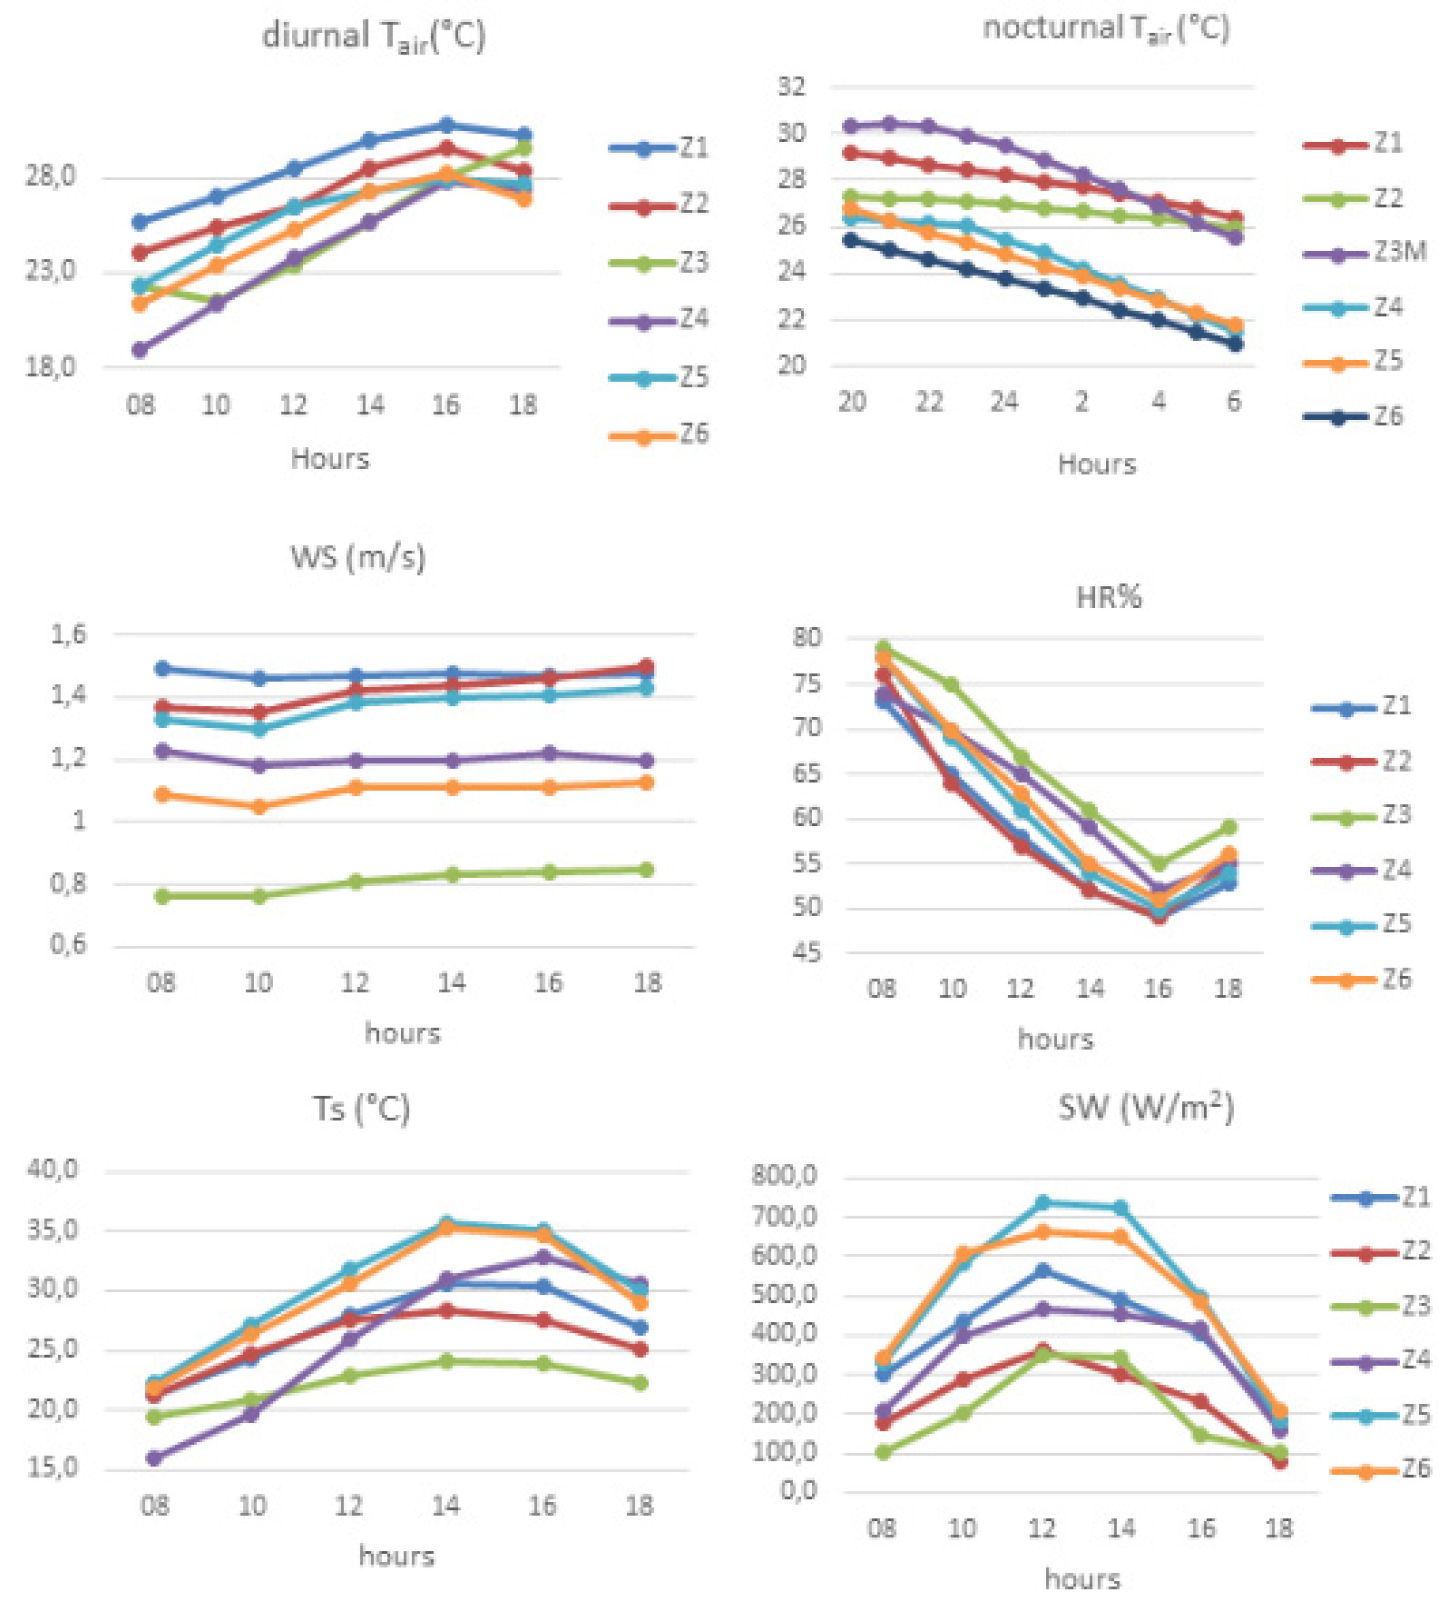
Analyzing the temperature contrast between different LCZs of Rabat during the night allows the quantification of UHI. The highest value recorded is 3.6°C for built areas between Z1 and Z6 (open low-rise zone). It is the same value as Vancouver [4]; for Nagano in Japan, this value is 2.7°C. For Uppsala in Sweden, the maximum contrast is recorded between LCZ6 and LCZ2 as there is no Compact high-rise tissue. It is 3.4°C [28]. Adopting mixed tissue can improve the microclimate in Rabat by reducing the UHI intensity by about 4°C compared with compact zones. By night the open midrise zone and the open low-rise zone record slightly lower air temperatures by night but by day, Z4 is clearly the best configuration.
Mean Radiant Temperature Distribution and Variation Analysis
The time series of mean radiant temperature in simulated zones of Rabat on a typical summer day (see Figure 6) shows that the Tmrt is low and ranges between 10°C and 20°C in the nighttime. After 6h, it increases for all studied sites, in conformity with the curve of the global shortwave radiation curve. The curve of Tmrt in the open high-rise/open low-rise case confirms the previous deduction about shading impact. Open low-rise Z6 (villa zone) provides a lower Tmrt than the others during all the stressful heat periods, and the maximum Tmrt (67.77°C) is lower than in all the other cases but not than Z4. Z3 is the best scenario until 11h, but after it reaches the highest Tmrt (77.08°C). Despite Z6 being more open and having no high-rise buildings, no trapping phenomenon, and good natural ventilation, abundant vegetation also provides the lowest air temperature. This opening and no buildings shading effect cause an increase in the surface temperature due to the shortwave radiation received.
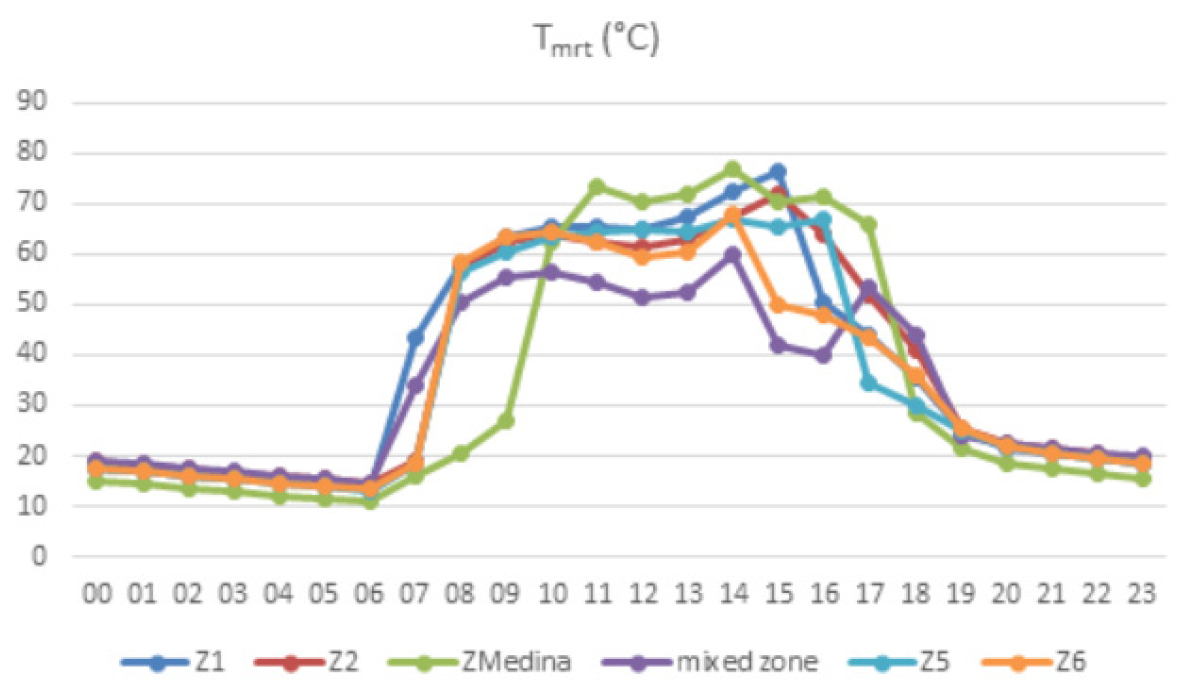
For a deeper understanding, we correlate some urban morphological indicators characterizing each zone type and the Tmrt average values of 24h, the Tmrt average of daytime, the nighttime, and the maximum value of the day. Some studies tried the point-by-point correlation, but several limits are shown [29, 30]. Figure 7 shows that Z4 presents an equilibrium between built surface, pervious and impervious areas, in contrast to the other patterns. The sky view factor (SVF) is 0.66, Prospect H/W is 1.25, an albedo of 0.23, and roughness is 24 m. The highest value of Tmrt max and average daytime (76.55°C and 56.28°C) are registered in the compact high-rise case Z1, and the lowest values (60.12°C and 47.22°C) correspond to Z4 the mixed zone.

Outdoor Thermal Comfort Perception
Figure 8 shows the external thermal comfort indicator in Rabat city during the daytime and nighttime in the summer. The MZ tissue provides comfortable thermal conditions between 13h and 18h, the most critical period for outdoor activities of pedestrians. The medina and the open low-rise tissue allow a tolerable level of warmness over the daytime. The entire built tissue offers a comfortable to slightly cold climate during the nighttime.

Conclusion
Comparing the different microclimatic parameters resulting from different urban morphology choices (Z1-Z6) and the thermal comfort index PMV allows several findings. We focused on assessing a mixed tissue of two LCZs, namely open high-rise and open low-rise, as defined by the LCZ classification, by comparing it with the main types of urban morphology existing in Rabat, including that of the traditional historical fabric Z3 (Medina tissue). The comparison focused on the air temperature distribution at 2 m height from the earth, relative humidity level, wind speed, surface temperature, the direct flux of short-wavelength radiation, average radiant temperature, and external comfort index PMV. Simulations focused on July 11th, 2020, as a typical day of a stressful thermal period of the year and the time between 08h and 18h period of heavy traffic and use of urban spaces. ENVI-met 4.4.2 is validated experimentally in three points of Rabat from different LCZs (LCZ1, LCZ2, and LCZ6) successfully on 5th, 8th, and 11th July 2020. Results show that the accuracy of the 3D predictive model is sufficient in the climate of Rabat with an RMSE of 0.53 (2 % of the air temperature average value in LCZ1), 0.85 (3 % for LCZ2) and 0.54 (2% for LCZ6) confirmed by the significantly higher R² values. Results show that advection and natural ventilation strongly affect the distribution of within-design air temperatures and that solar radiation and local shading patterns are decisive for spatial contrast in cooling. Adopting mixed tissue can improve the microclimate in Rabat by reducing the UHI intensity by about 4°C compared with compact zones. By night the open midrise zone and the open low-rise zone record slightly lower air temperatures by night but by day, Z4 is the best. By day, MZ shows some advantages. This design scenario combines natural ventilation due to the porosity of the urban tissue, the high ratio of pervious and vegetated surfaces, and the shading cooling effect due to the high rise of some buildings. It can provide about 7 hours of passive thermal comfort, more than all others. Two studies concerning the assessment of the impact of urban morphology on outdoor thermal comfort have been conducted. The first was in the warm, humid climate of Dar Essalam, and results showed that the areas with low-rise buildings led to more stressful urban spaces than the high-rise ones. The compact urban morphologies reduced solar exposure duration [31]. The second was a comparative analysis of three eco-districts. It proved that the open urban form presents the best thermal comfort level. It is attributed to the opening to the incident wind and limiting the harmful by promoting heat dissipation [32].
The choice to mix LCZ4/LCZ6 represents several advantages. It produces the best external thermal comfort, social diversity, and inclusiveness. Reduces the budgetary and environmental bill of transport by bringing services and shops closer to residential areas.
