

Introduction
Preliminary Research
Indoor Thermal Comfort Factors
Subjective and objective thermal comfort
Experiment
Experimental environment
Experimental method
Data acquisition
Result and Discussions
Indoor temperature and humidity change
Difference in temperature and humidity
Body temperature and humidity-Objective Thermal Comfort Correlation
Body temperature and humidity-subjective Thermal Comfort Correlation
Comparative Analysis of Subjective/Objective Thermal Comfort
Conclusions
Introduction
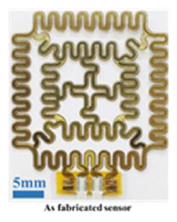
As the quality of life increases, people are placing importance on indoor thermal comfort. Office workers are able to improve their work efficiency due to the pleasant indoor environment, the demands for each employee’s comfort are diversified [1]. Although various researches on the comfort of occupants are continuing, the criteria for indoor thermal environment of Korean offices and the thermal comfort of the users are unclear as the international research based standards ISO-7730 and ASHRAE are used as indicators [2]. In according to ISO-7730, the expected heat sensation response index value between -0.5 and 0.5 out of the range of -3 to 3 is defined as a comfortable indoor environment for humans [3]. In addition, the ISO-7730 indicator was created by measuring common indoor thermal comfort, but in reality, the comfort level felt by each occupant is different, so that pleasant and unpleasant people coexist within the same space. In order to understand the different thermal comfort levels for each occupant, a sensor that measures the temperature and humidity of occupants is required. There has been a lot of research to collect biometric data according to changes in indoor temperature and humidity of such occupants. In order to measure the physical heat factor, most of the room temperature and humidity were measured using a general commercial thermo-hygrometer or a commercial temperature-humidity sensor, and subjective responses were evaluated through a survey of occupants [4]. In addition, by measuring the temperature of the occupants’ facial skin using a thermal imaging camera that was not used in previous studies, the PMV index value was used as a supplementary indicator [5]. In many studies, indoor temperature and humidity is measured through a general commercial temperature and humidity sensor, but the indoor temperature and humidity is not the same as the data on the living body temperature and humidity. Therefore, in order to measure the temperature and humidity of an occupant, a more accurate biometric data different from the indoor temperature and humidity can be derived by attaching it to the occupant’s skin using a flexible temperature and humidity sensor integrated with a wireless communication system. The wireless flexible sensor includes a multi-channel temperature sensor and humidity sensor, a flexible battery, and a wireless communication system, making it suitable for measuring skin temperature and humidity of occupants in an office environment, and easy for data transmission [6]. This study aims to compare the subjective thermal comfort through the measurement and survey of skin temperature and humidity of occupants wearing a wireless flexible sensor in the office where the set temperature is controlled through the PMV measuring device. In addition, the purpose of this study is to analyze the reason for the differences between objective and subjective indicators and to identify the relationship between individual biological temperature and subjective comfort level.
Preliminary Research
Indoor Thermal Comfort Factors
Based on ASHRAE 55-2017, the factors of thermal comfort are metabolism, clothing, air temperature, average radiant temperature, airflow velocity, and relative humidity [7]. The amount of metabolism in men needs about 350 kcal/day more than women. PMV values predicted using temperature, temperature preference, and thermal comfort were always analyzed to be higher in women than men [8]. The amount of clothing 1 clo refers to the warmth of clothing that can maintain an average skin temperature of 33°C and feels comfortable for the general public in a fixed indoor position with a humidity of 50 at 21.2°C and wind of 10 cm/s or less. Average radiant temperature refers to the average surface temperature of each part of the wall in the room. Airflow velocity is the speed of movement of indoor air. Relative humidity is the ratio of the amount water vapor present in the atmosphere to the amount of saturated water vapor [9].
Subjective and objective thermal comfort
Objective thermal comfort is an objective value obtained by calculating from the variables for six factors based on the 7-point thermal sensation scale of ASHRAE. On the other hand, subjective thermal comfort is the subjective value through a survey of occupants without calculation by formula. The scale of thermal comfort is from -3 to 3 based on ASHRAE’s 7-point thermal sensation scale, and values in the state of -0.5 to 0.5 are defined as the comfort range [3]. It indicates that the heat generated inside and outside of the occupant’s body are parallel to each other, and the expected rate of dissatisfaction for the indoor environment is relatively low [5]. When the level of comfort is measured with a PMV measuring device, subjective opinions through a survey of occupants may differ. Kim, J-H (2013) reported that measuring the comfortable environment based on the objective PMV index differs from the comfort level directly felt by the occupants, and it is not appropriate [10]. The results showed no significant relationship between subjective thermal comfort and PMV index. This is because the objective thermal comfort value through the PMV measuring device is numerically calculated through 6 factors of thermal comfort, but the subjective thermal comfort level is a survey conducted by combining 6 factors and the comfort level directly felt by occupants.
Experiment
Experimental environment
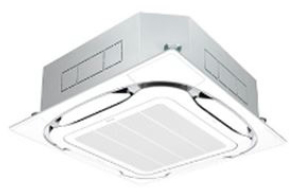
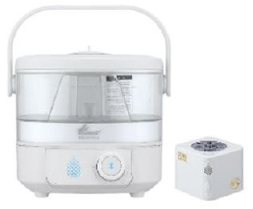
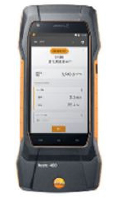
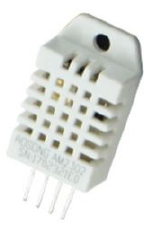
The experiment was conducted in a laboratory equipped with a system air conditioner. Blinds were installed to avoid direct sunlight and two commercial temperature sensors DHT22 were connected to Raspberry Pie to obtain indoor temperature and humidity data. The temperature and humidity of a living body was measured by attaching a wireless flexible sensor that is not affected by the humidity of the human body, such as sweat, to the back of the hand. For objective thermal comfort measurement, an experiment was conducted using a Testo 400 and a sensor set that measures dry bulb temperature, average radiant temperature, airflow velocity, and relative humidity. In addition, a system air conditioner for temperature control, a humidity-controlled humidifier and an air circulator were also used to distribute evenly humidity in the laboratory. The resources and uses of the equipment are shown in Table 1.
Table 1.
experimental equipment resources
Experimental method
The purpose of this study is to derive the correlation between temperature and humidity and to compare objective and subjective thermal comfort through changes in indoor temperature and humidity and living body temperature and humidity by adjusting the office set temperature with the area of 32 m2 (3.8 m × 7.8 m). The subjects participating in the experiment were three male and three female college students with healthy body in their 20s. The physical condition of the test subject is as shown in Table 2, the same clothing was provided, and the same work was performed during the experiment in order to make the condition of all subjects the same. The experiment was conducted for about 5 hours each for 6 days, and as shown in Figure 1, the set temperature of the office air conditioner was adjusted to 18, 24, and 30°C. The measurement pattern was carried out over a total of five times with a pattern of 10-minute temperature adaptation, 30-minute data collection, 10-minute temperature change, and then 10-minute rest. The setting temperature of experimental environment adjusted by using the system air conditioner in the office was shown in Figure 2. Two commercial temperature and humidity sensors were installed to measure the indoor temperature and humidity of the office indoors. The wireless flexible sensor for recording the temperature and humidity of a living body was measured by attaching it to the back of the hand in the same manner for all subjects. One sensor attached to the wall for indoor temperature and humidity measurement was attached 30cm above the seated subject’s head and the other was installed in front of the subject’s keyboard. The value of clo was set to 0.7 by unifying it with a thin long-sleeved top and jeans. The amount of energy metabolism is set to met = 1.2 for light task in a sitting position using a computer. Objective thermal comfort values were measured using Testo 400 device, and subjective thermal comfort values were surveyed by subjects using pop-up programs on computer screens every five minutes. The scale and the content of the questionnaire are shown in Table 3.
Table 2.
Physical condition of the subject
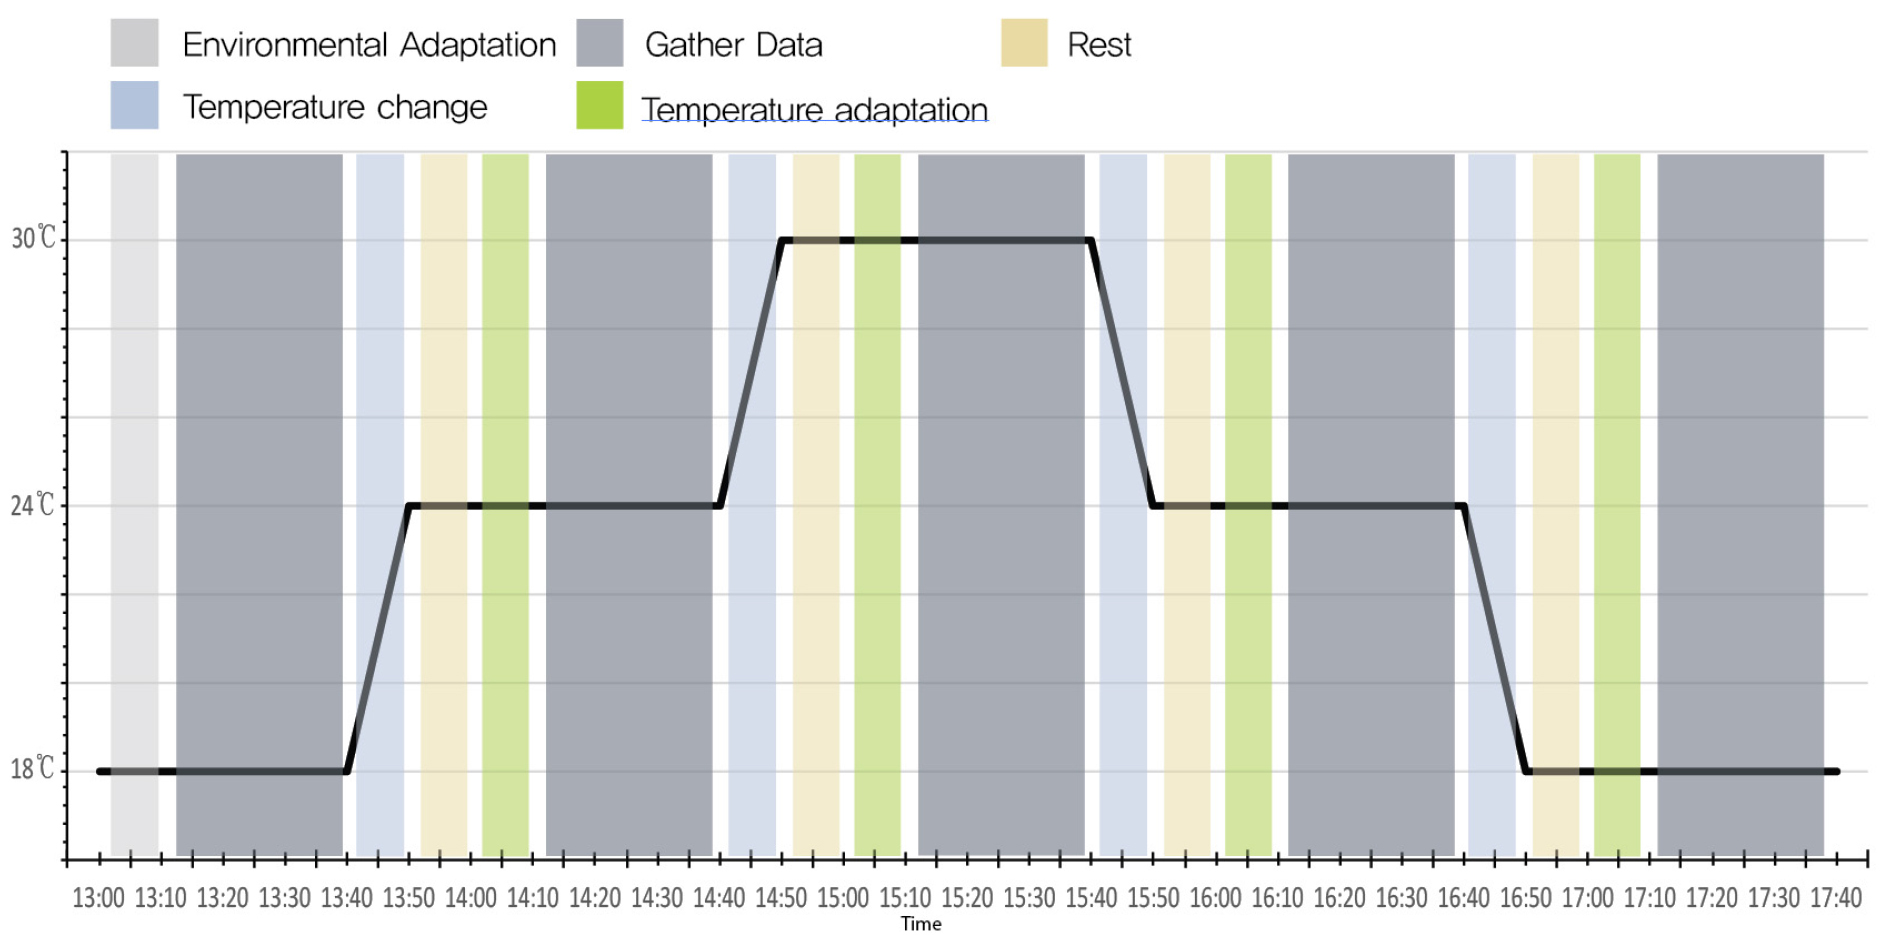
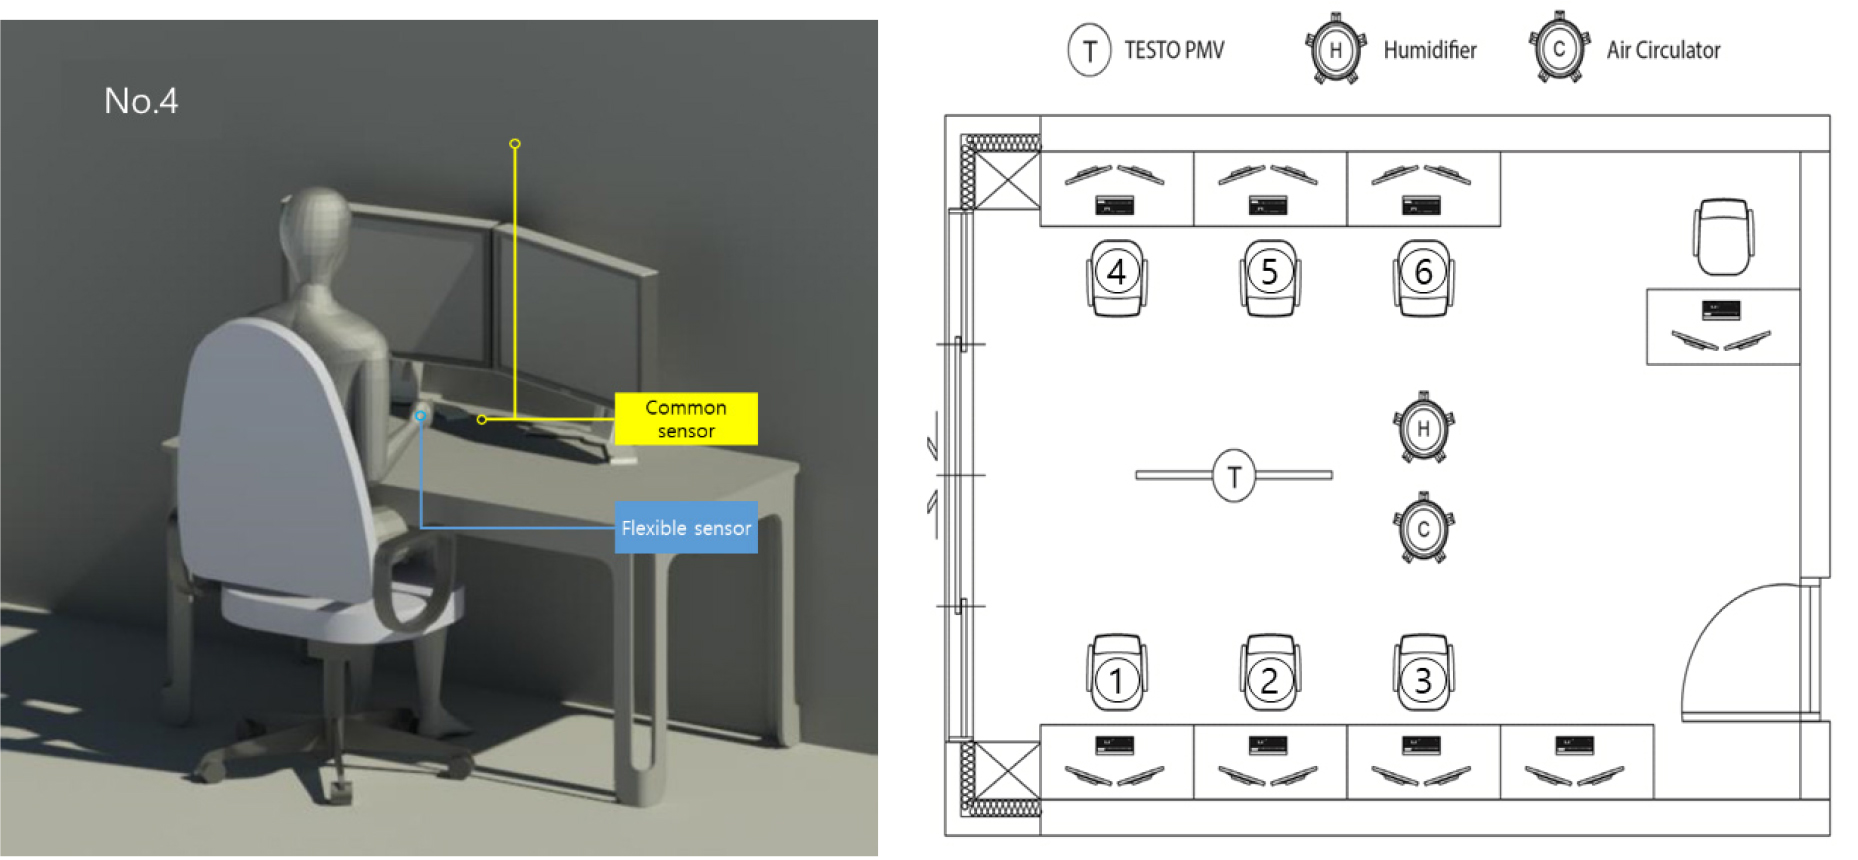
Table 3.
Scale and survey content
| Scale | 3 | 2 | 1 | 0 | -1 | -2 | -3 |
| Contents | Hot | Warm | Slightly warm | Neutral Comfort | Slightly cool | Cool | Cold |
Data acquisition
The indoor temperature was changed by adjusting the set temperature of the system air conditioner within the experiments. Indoor temperature and humidity were measured using a commercial temperature and humidity sensor, and skin temperature and humidity was measured using a wireless flexible sensor. The objective thermal comfort value was measured using Testo 400 while the subjective thermal comfort value of the subjects was measured through a questionnaire survey. In order to check the objective thermal comfort value of Testo 400, the objective thermal comfort value was conculated by referring to the computer formula of ASHRAE. In objective thermal comfort measurement, there are four variables including temperature (TA), humidity (RH), airflow (Va), and radiant heat (tg), and the value of activity (Met) and clothing (clo) are fixed at 1.2 and 0.7. In the below equation, M-W is for additional activity, so it is usually assumed to be zero. Since the objective thermal comfort level is based on the value derived through the calculation formula, a value of -0.5 ~ 0.5 is used as the comfort range. On the other hand, subjective thermal comfort through the survey was defined as zero because it is impossible to produce a value of –0.5 to 0.5.
Result and Discussions
Indoor temperature and humidity change
The experiment lasted for four hours and 40 minutes from 13:00 to 17:40. The room temperature was measured by changing the temperature of the system air conditioner to 18, 24 and 30°C. Although the actual set temperature of the system air conditioner and the measured temperature have an error of about 2 ~ 4°C, the experiment was conducted based on the set temperature in this study. The temperature collected from sensors on the walls and desks of the six subject showed a distribution similar to the control temperature but showed a slower response when the temperature decreased than when the temperature increased.
Difference in temperature and humidity
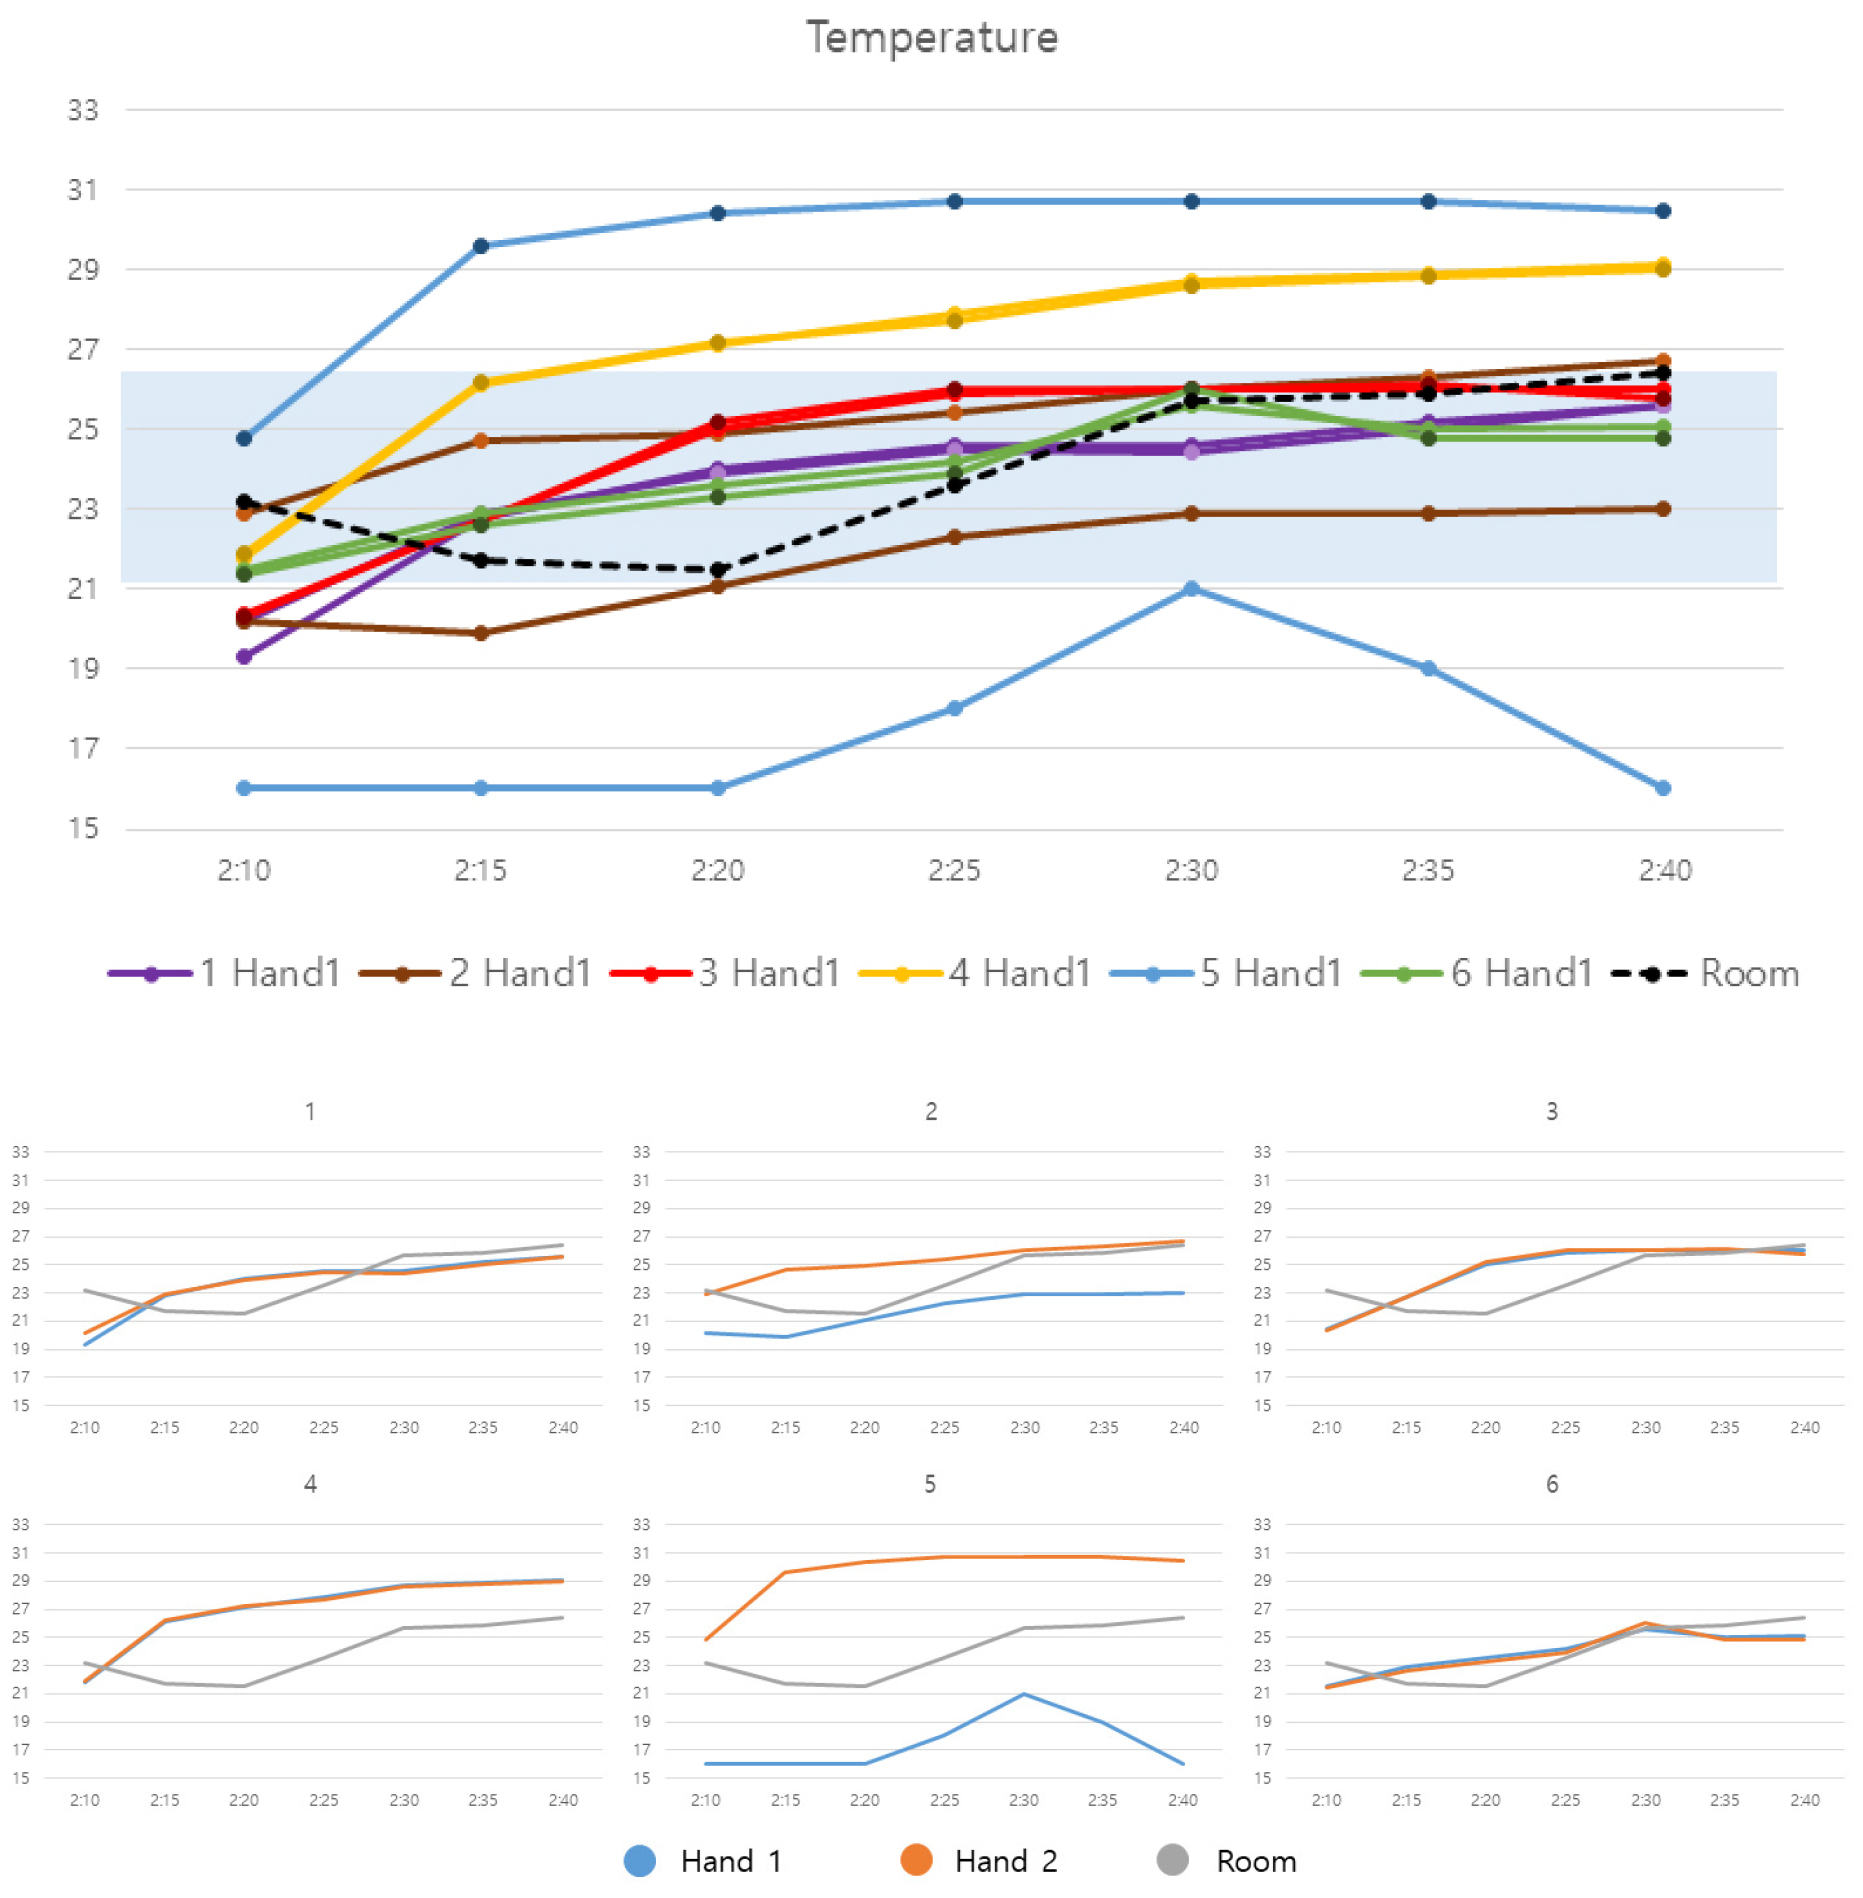
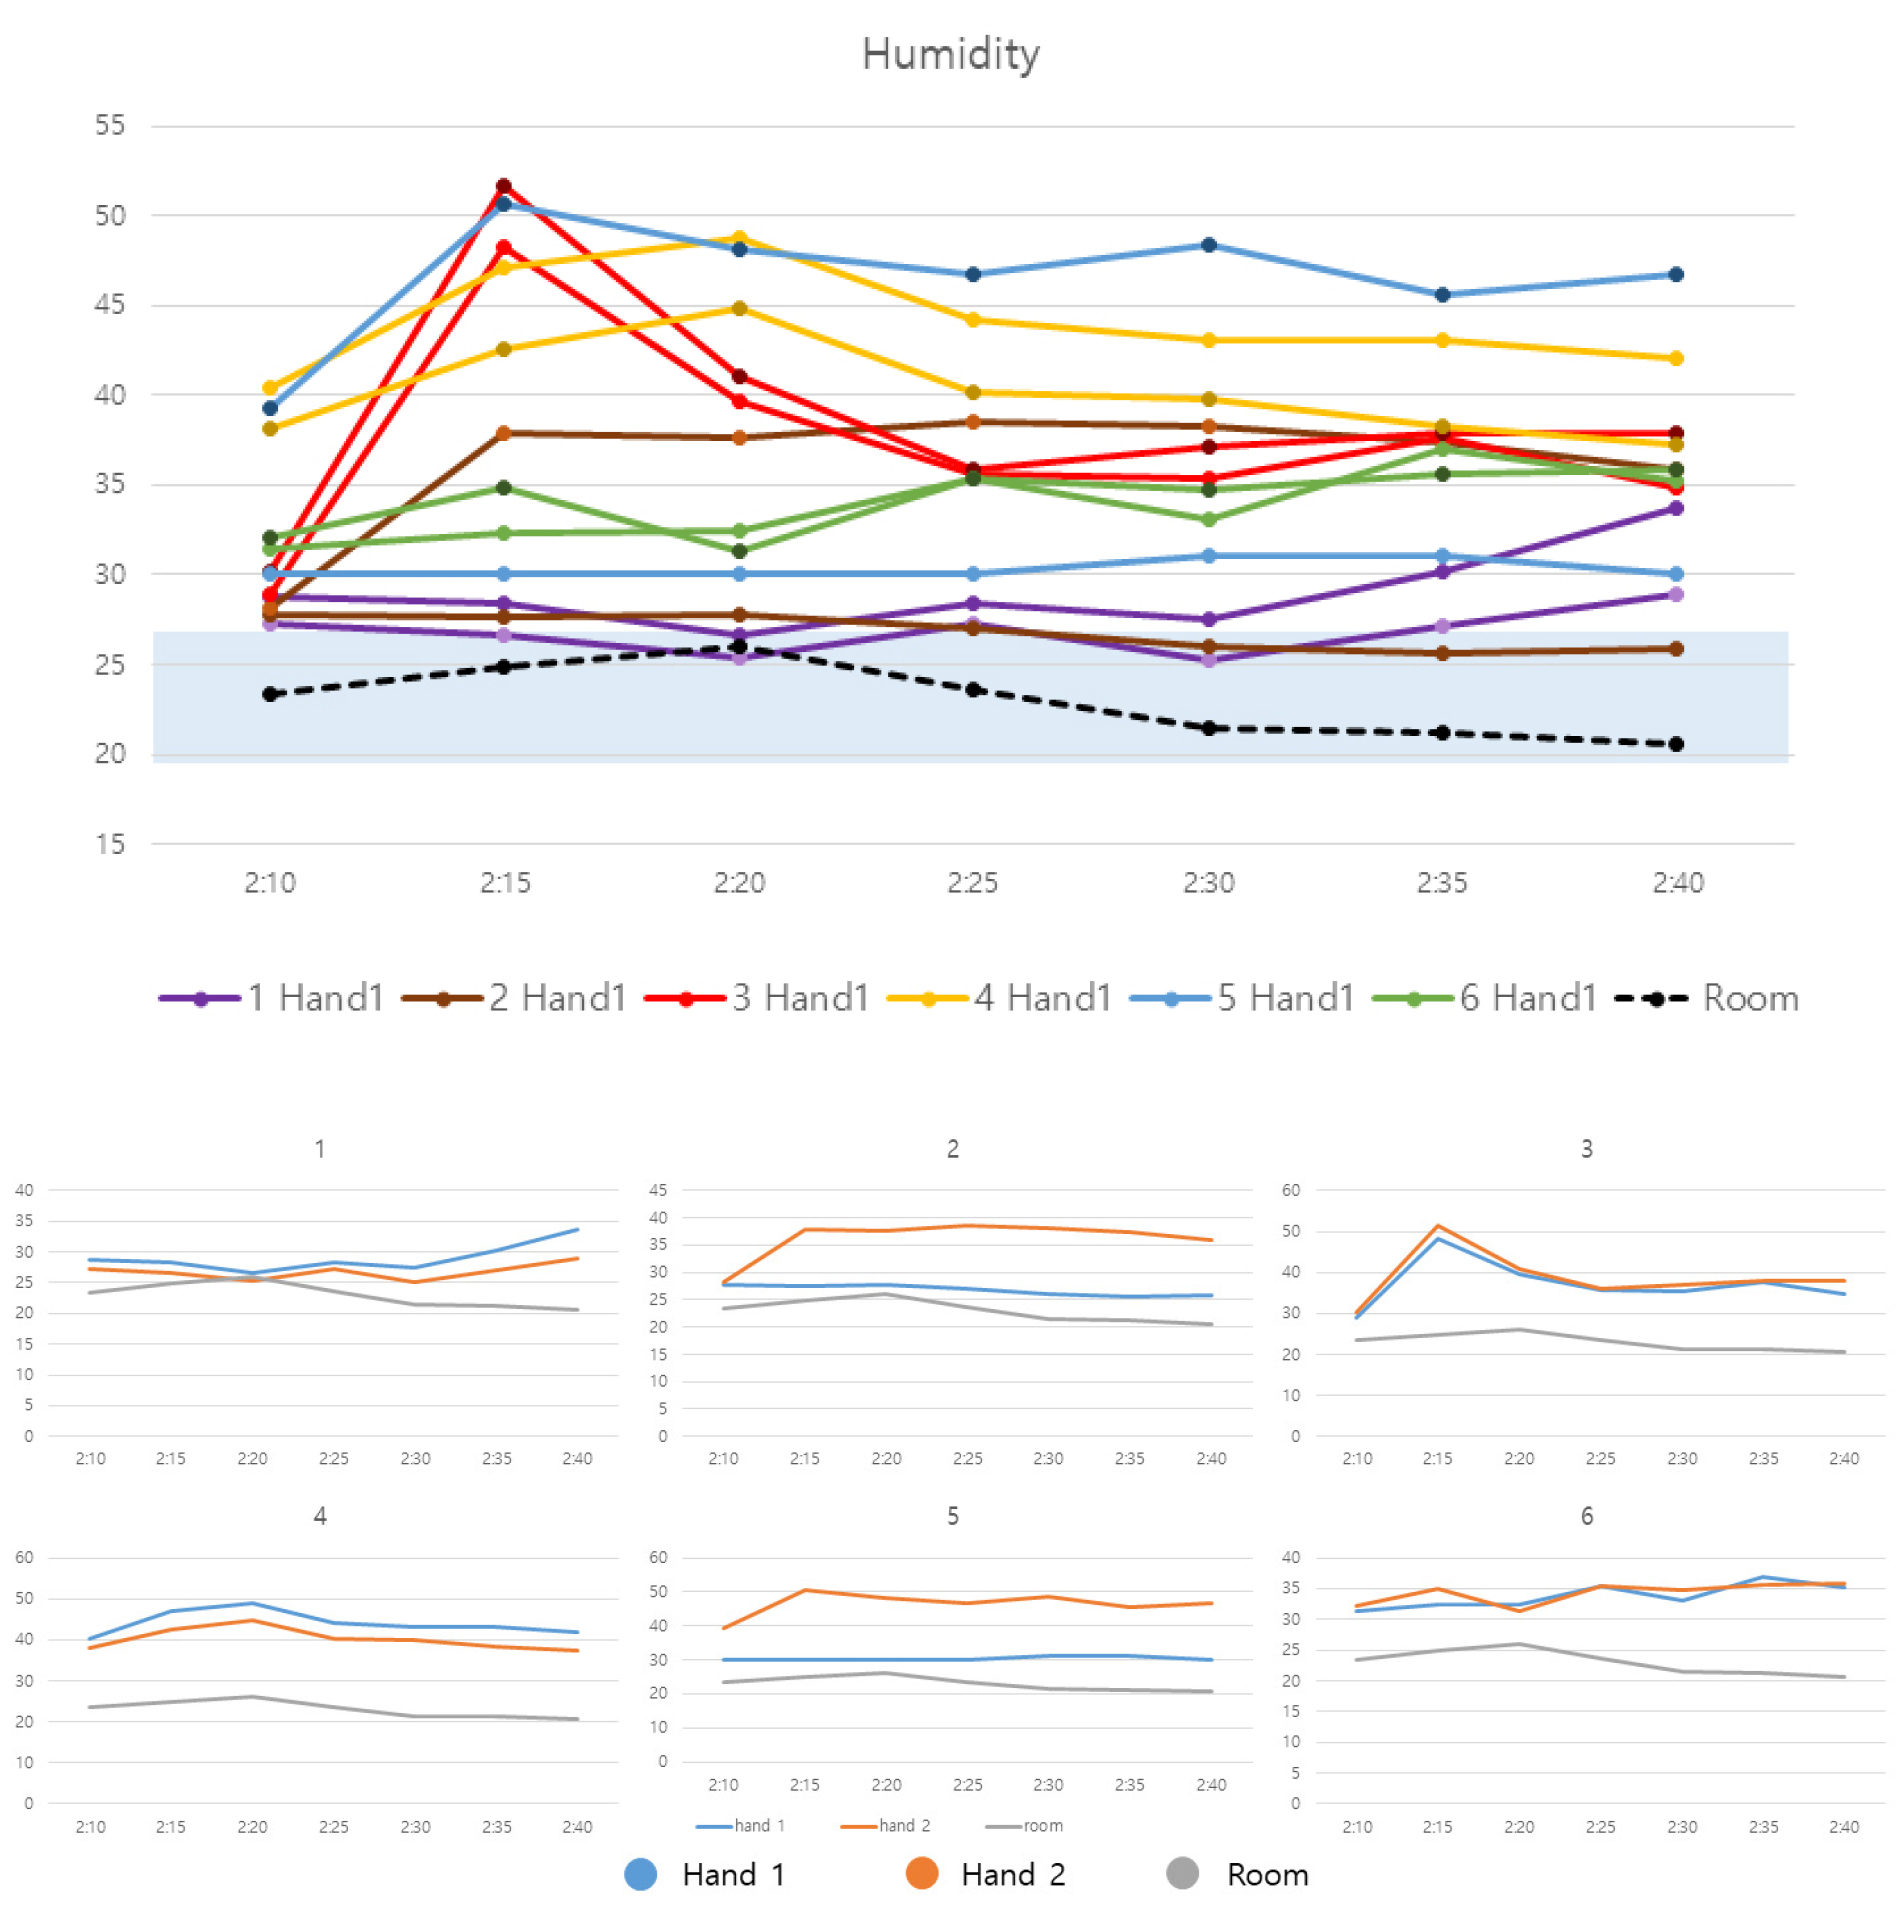
The experiment was conducted under the same conditions in the same place except for the seat location. In the case of indoor temperature and humidity, it can be seen that the temperature and humidity of the living body are significantly different for each individual, although the temperature and humidity of the room are similar in each of the positions of the six subjects. In addition, the body temperature of most subjects is not significantly different from room temperature, but the data of subject 2 and female subject 5 differ from the temperature and humidity of other subjects. The maximum difference from room temperature is 10.4℃ as shown in Figure 3. As shown in Figure 4, you can see that there is a maximum difference of 27% from humidity.
Body temperature and humidity-Objective Thermal Comfort Correlation
The objective thermal comfort was derived with the highest value of 1.1 at 28°C when the biometric temperature of the subject was the highest. In the objective thermal comfort value, indoor humidity was only affected by temperature because it was not possible to measure the biometric humidity of the subject. In addition, the blue strip presented shows as a value range between –0.5 and 0.5 in objective thermal comfort, and most subject answered that it was comfortable, indicating that there is a relationship between skin temperature and objective thermal comfort.
Body temperature and humidity-subjective Thermal Comfort Correlation
The subjective thermal comfort level of female subject No. 6 was the highest at 14:25, when the body temperature and humidity increased the most, and when the temperature was the lowest, the thermal comfort level was the lowest at -1. From the above results, it can be seen that the accuracy is more accurate when the temperature is low. Most subjects experienced a decrease in skin humidity when skin temperature increases, whereas an increase in skin humidity when skin temperature decreases. However, subjects 2 and 5 find that the humidity is very high.
Comparative Analysis of Subjective/Objective Thermal Comfort
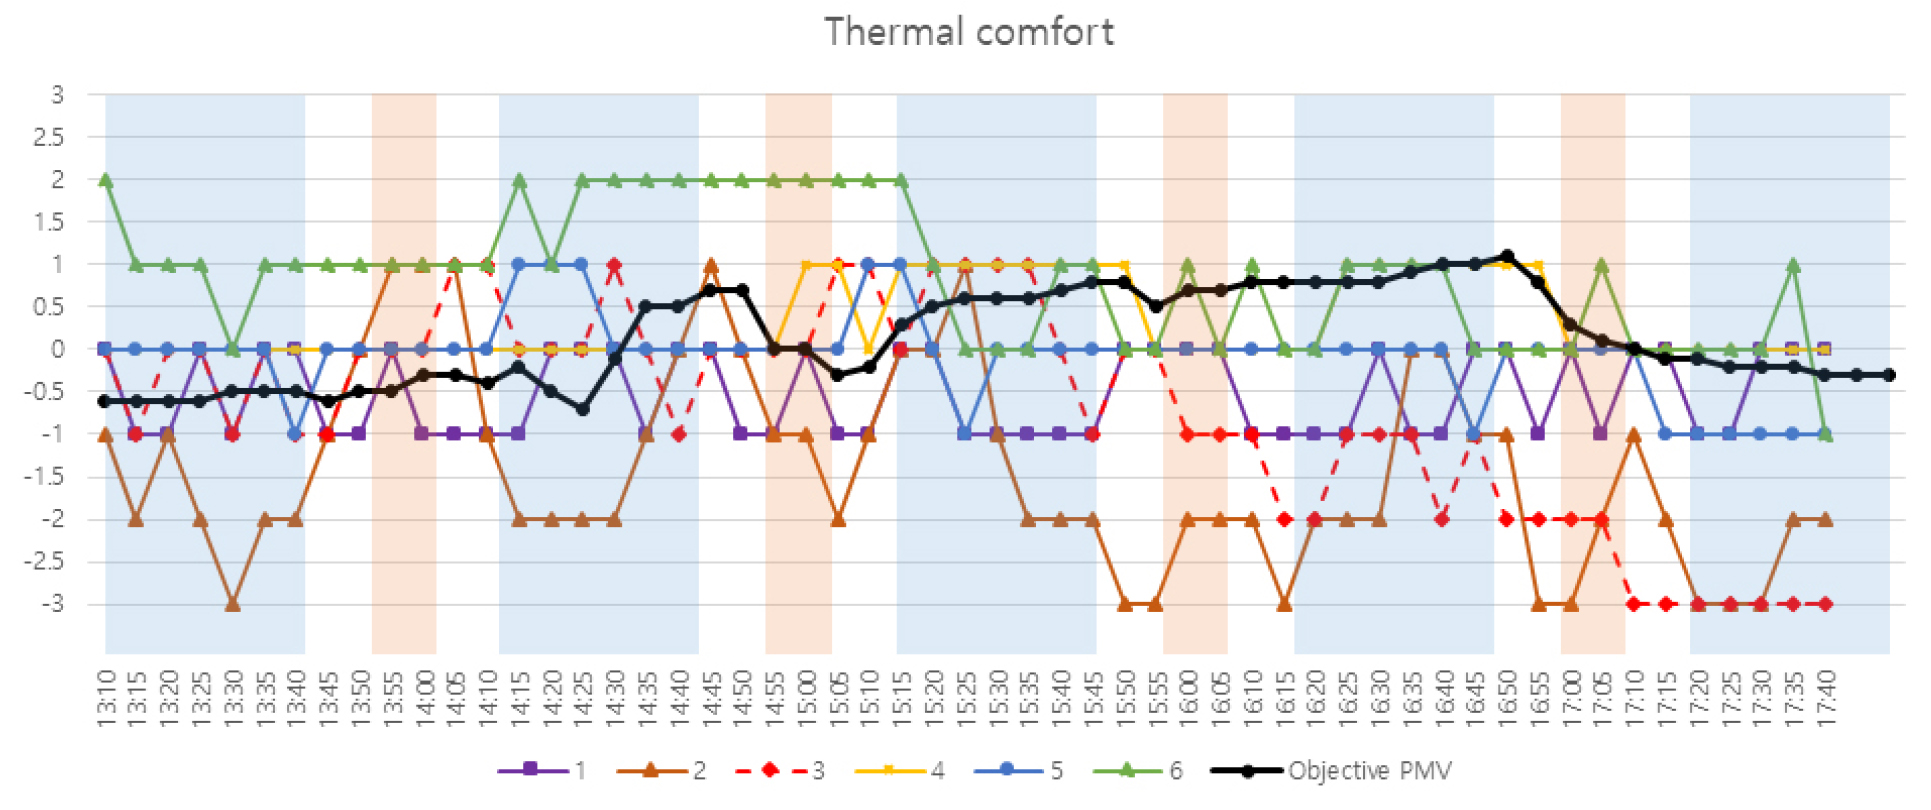
The following graph (Figure 5) shows the subjective thermal comfort and objective thermal comfort values of six subjects in five minutes per hour. The change in the objective thermal comfort level was almost similar to that of the room temperature change pattern, showing a value of –0.7 to 1.1. It also can be seen that the comfort level approaches 1 when the room temperature increases. However, as for the subjective thermal comfort value of the subject, there were many results that the male subject No.2 was cold (-2,-3) and the female subject No.6 was warm (2). As male subjects feel more cold and female subjects feel more heat, it can be seen that subjective comfort levels are different for each gender and individual. In addition, the objective thermal comfort value showed a slower change when the temperature was changed from 30℃ to 18℃ than when the temperature was changed from 18℃ to 30℃.
Conclusions
The results of the experiment comparing objective thermal comfort and subjective thermal comfort through change of set temperature in the office can be concluded as follows:
1. Through change of setting temperature and humidity of space, there is a similarity in the measuring pattern of indoor temperature and humidity, but in the change of the temperature and humidity of the living body, the change in humidity showed a lot of difference for each person.
2. When plotting the objective thermal comfort value measured by PMV measuring device and subjective thermal comfort value through questionnaire survey by subjects, most of the objective thermal comfort values are shown to be comfortable, but the survey showed discomfort according to different body temperature and humidity among subjects.
3. The speed of change in comfort was different when changing the set temperature from 18°C to 30°C and 30°C from 30°C to 18°C. In most cases, it changed slowly as the set temperature changing from 30°C to 18°C.
4. When the set temperature is 18℃, 24℃, and 30℃, the body temperature is similar but the humidity varies greatly from person to person, and the value is also measured differently depending on the measuring location.
5. Since there are different measurement results between the temperature and humidity of the occupant, it can be seen that the temperature and humidity measurement of each occupant is necessary for measuring the temperature and humidity of each occupant, not the temperature and humidity of the space unit.
This study contributes to an additional study for the correlation between the occupants and indoor thermal comfort and improvement of the indoor environment, and further experiments by dividing the number of people and grouping by age group will provide more accurate results. If the battery problem of the wireless flexible sensor is solved, long-term data collection experiments will be possible for measuring the temperature and humidity of the living body in the office and analyzing the occupant pattern. In fact, subjective thermal comfort is highly influenced by the biometric information of occupants and shows a difference from objective thermal comfort, so I think that additional research is possible by wearing only a flexible sensor without a questionnaire.
