

Introduction
IQT Definition
Steps Considered for the TQI
IQT Formulation
Delphi Questionary Application
Scoring criteria development
Traffic Simulation
Sensitivity Analysis
Conclusions and Recomendations
Introduction
The environmental conditions of urban spaces for vehicles are directly affected by the operation at their intersections, the number of vehicles traveling on the road network and its dispersion throughout the day. With the growth of cities and the consequent increase in the amount of circulating vehicles, public agencies responsible for the planning of cities have required impact studies road of new projects (Brazil, 2001). These studies are aimed, among other things, assess the current quality of road intersections and estimate the future quality in a pre-established horizon.
There are several methodologies that can be used in studies of intersections, such as the Webster Method (Webster & Cobbe, 1966) and Percentile Method (Trafficware LLC, 2014). The most widespread is the Highway Capacity Manual - HCM (Transportation Research Board, 2010). The HCM has the criterion for evaluating the identification of delay per vehicle intersection or approach, measured in seconds per vehicle. Another very common methodology is Intersection Capacity Utilization - ICU (Husch & Albeck, 2003), which compares the volume of active traffic at the intersection with a traffic capacity.
However, the available methodologies are not yet able to predict the quality of traffic through a broader approach that considers a set of more comprehensive variables related to the quality and fuel efficiency, like delay per vehicle and capacity of the intersection, as mentioned, and number of stops, vehicle emissions, among others. In this sense, this paper proposes a Traffic Quality Index - TQI, whose determination was based through transport specialists opinion and quality indicator variables that could be measured by applying traffic simulation.
The formulation of TQI was based on procedure adopted by studies using the Delphi Methodology (Dalkey & Helmer, 1963) to obtain the opinion of experts to identify variables related to quality indexes (Menezes 2011, Junior 2008, Souza 2008, Lopes & Libânio 2005, Ferreira & Sanches 2001, Hamekoski 1998). The final selection of the parameters was the result from consensus opinions obtained in feedback round.
The establishment of a Traffic Quality Index is of great importance for road impact assessments and can support decisions on physical and operational changes on urban roads. In this context this study is innovative because it provides a more comprehensive approach to assessing the quality of traffic that presented by the most known methodologies available.
IQT Definition
Steps Considered for the TQI
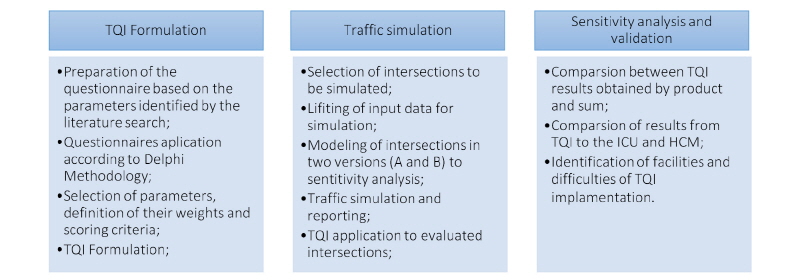
The TQI setting method is divided into sequential steps, being necessary, firstly, the formulation of the index, followed by traffic simulation, sensitivity analysis and validation. Figure 1 shows the list with steps and activities of the study. It is important to note that in the simulation stage were modeled intersections in two versions to enable sensitivity analysis. The version “A” shows the simulation of the real traffic volumes collected, whereas version “B” shows the simulation of half traffic volumes.
IQT Formulation
Following Delphi methodology (Dalkey & Helmer, 1963), two questionnaires were applied to experts who works with traffic planning or operation, one in each stage of the research. In the first stage, the Questionnaire 1 had variables related to quality indicators and participant should choose which would be included in the general equation and establish a weight of 0 to 100. Nine variables that indicates the quality of movement or environment and that can be obtained by traffic simulation were evaluated. They are: delay per vehicle (s); stop delay per vehicle (s); stops per vehicle (stops/veh); average speed (km/h); fuel efficiency (km/l); vehicles with denied entry to the road network (veh); maximum queue lengths (m); average queue length (m) and 95th percentile queue length (m).
Once these variables are measured on different scales and units, it was also necessary to establish, in the first stage, scoring criteria able to parameterize the values for variables in a predetermined range.
In the next step, the second questionnaire was applied showing the statistics based on the previous questionnaire answers. This way the participants could re-evaluate their answers based on the previous opinion of the group and, thus, allow the convergence of the results.
After completing the steps of selection of variables, assigning weights and scoring criteria, was made a sensitivity analysis of the index using the forms of sum and product operators, as the following equations (Equation 1 and Equation 2). These formulations represent two forms of aggregation of subindices commonly used to obtain a final index (Abbasi & Abbasi, 2012).


where  = Traffic Quality Index - sum formulation;
  = Traffic Quality Index - product formulation;
  = weight assigned to each variable;
  = score of the intersection for each selected variable, according scoring criteria developed;
  = each variable included in the calculation;
  = total number of variables included in the calculation.
Delphi Questionary Application
Questionnaire 1 was sent to a group of about 40 experts obtaining 23 valid responses, of which 18 have continued to research by completing the questionnaire 2. There is no consensus in the literature on the number of participants used in Delphi studies (Sandford & Hsu, 2007), however most of them uses between 15 and 20 responders (Ludwig, 1997).
The profile of respondents is made up of independent professionals, consultants , civil servants and academics who work with urban and transportation planning and traffic control in the brazilian states of Espírito Santo, Rio de Janeiro, Ceará , São Paulo, Rio Grande do Sul and Brasilia. Table 1 shows the results obtained regarding the inclusion of variables. The results show that the variable 9 (95th percentile queue length) was not a relevant factor for calculating the TQI, according to the opinion of the respondents.
Table 1. Results obtained in the Questionnaire 2 – Variables inclusion |
|
PS: Highlighted the highest values |
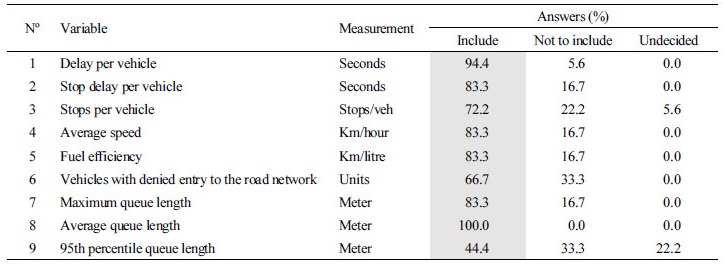
The final responses were evaluating for inclusion rate, which was calculated for insertion into the TQI formulation to include divergent views of the respondents. Its value is equivalent to the percentage of inclusions to the total of valid responses (Lopes & Libânio, 2005), considering only the results “include” and “not to include”. Regarding the weights of the variables, it took the median of the results in order to avoid the influence of extreme points. It arbitrated that the sum of all weights should result in one (1), thereby yielding the final weight used at the general TQI equation. Table 2 shows the results obtained.
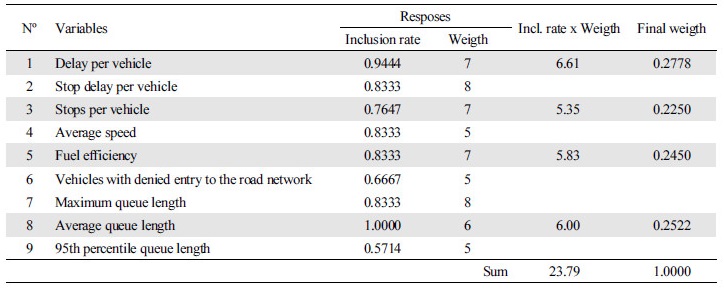
Variables with inclusion rate lesser than 70% were excluded (variables 6 and 9). Variables 2 and 7 were exclude to avoid redundancy since they have lower inclusion rates than the variables 1 and 8, respectively. Variable 4 was exclude because the delay is dependent on vehicle average speed, among other factors.
Scoring criteria development
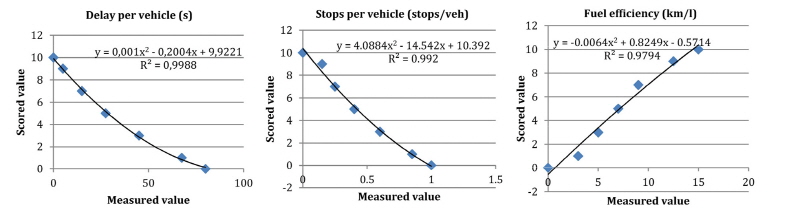
The selected variables were scored according to the classification given by the traffic simulator (Husch & Albeck, 2003), except “queue size” that was given by expert opinion because the software does not classify this variable. Thus, graphics were produced by correlation between the results ranges presented by the software to “delay per vehicle”, “stops per vehicle” and “fuel efficiency” and standardized scale ranging from 0 to 10. These are graphs presented in Figure 2. It was used polynomial correlation because its greater adherence to the collected data.
|
Figure 2. Score criteria to “delay per vehicle”, “stops per vehicle” and “fuel efficiency” variables. Source: Aguiar, 2016. |
The development of scoring criteria for the variable “queue” dismissed the outliers. A correlation was make between the valid responses from the questionnaires and the standardized scale, as shown in Figure 3. Note that the sensitivity of queue size decreases as increase its size.

Thus, the equations that defines the traffic quality variables for TQI are represent by the following linear regression equations.


where  = Scored delay per vehicle (s);
  =Measured delay per vehicle (s);
  Scored stops per vehicle (stops/veh);
  Measured stops per vehicle (stops/veh);
  Scored fuel efficiency (km/l);
  Measured fuel efficiency (km/l);
  Scored queue length (m);
  Measured queue length (m).
Traffic Simulation
Equations 3 to 6 were applied in the quality evaluation of four intersections that has different flows, geometries and operational logistics, considering the peak vehicle volumes and its reduce it by half, in order to analyze the sensitivity of the formulation to the same geometric and operational characteristics. These intersections were modeled and simulated using Synchro Studio 9 (Husch & Albeck, 2003) to enable the achievement of results of TQI variables and to compare it to the ratios obtained for HCM and ICU.
Currently, there are several softwares used for traffic simulation, such as Vissim, Rodel and Sidra (Shaaban & Kim, 2015), highlighting to SimTraffic, Corsin and Aimsun (Jones, Sullivan, Anderson, Malave & Naveen, 2004). Simtraffic from Synchro Studio 9 package was used in this research (Husch & Albeck, 2003), since that is the most used in the city under study and the database of the intersections was accessible. The information is initially created through mesoscopic analysis in order to be simulated through the microsimulation and animation traffic.
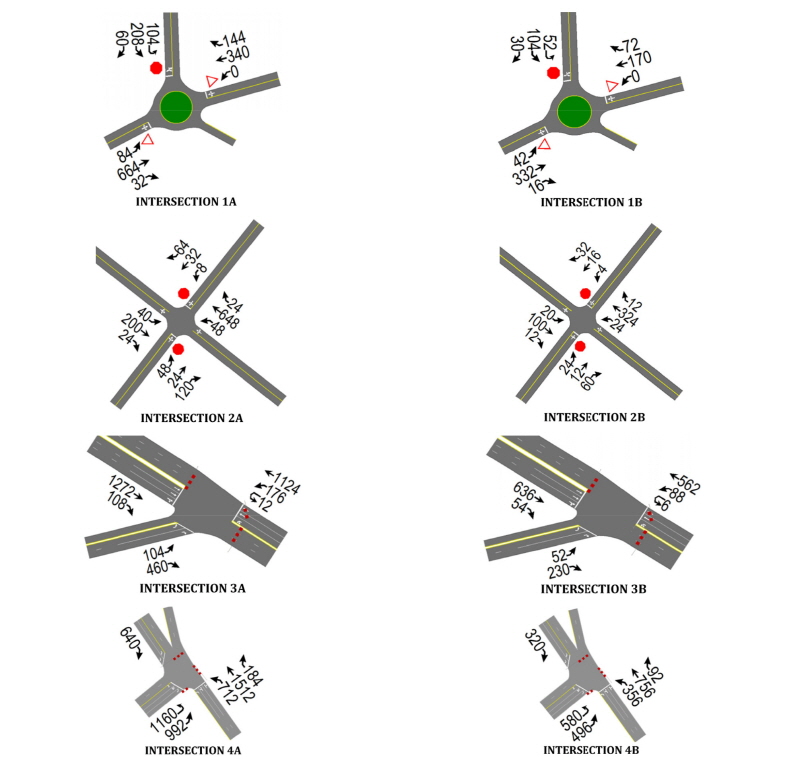
The intersections selected for the simulation was a roundabout (intersection 1), a unsignalized (controlled by signal “stop” sign - intersection 2 ) and two pretimed (one with 3 and another with 4 branches - intersections 3 and 4). To sensitivity analysis, for each intersection was simulated an “A” version, with peak hour volumes, and a “B” version, with the volumes of the first version reduced by half. Figure 4 shows the geometric representation of the intersections.
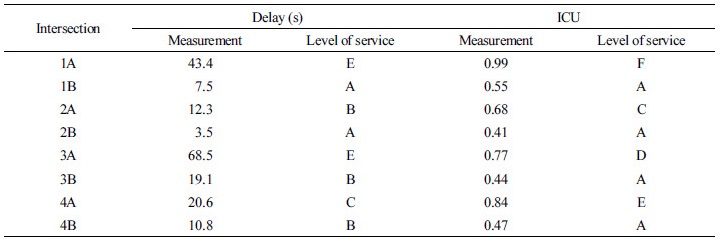
The traffic simulation was performed with the software standard configurations and the total simulation time was 10 minutes. The results for delay and ICU are shown in Table 3 with their respective levels of service. The qualitative scale used to quantify “delay” level of service is the one presented by the (Transportation Research Board, Highway Capacity Manual, 2010), while to quantify the “ICU” level of service is the one presented by (Husch & Albeck, 2003).
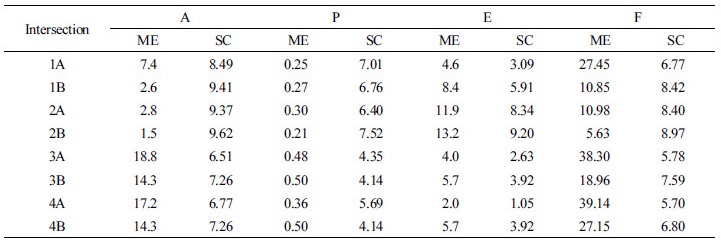
The results measured for input variables from TQI are shown in Table 4 with the respective scored values resulting from the application of the Equations 3-6.
Then the TQI formulations were obtained through application of the final weights of the variables shown in Table 2 to Equations 1 and 2, resulting in Equations 7-8 listed below.


where  Traffic Quality Index - sum formulation;
  = Traffic Quality Index - product formulation;
  =Scored delay per vehicle (s);
  Scored stops per vehicle (stops/veh);
  Scored fuel efficiency (km/l);
  Scored queue length (m).
Sensitivity Analysis
The scored values were applied to Equations 7 and 8 to obtain the values of TQIS and TQIP, respectively, from intersections. These results are shown below in Table 5 by intersection groups (A = traffic volume obtained by counting, B = traffic volume obtained by counting halved).
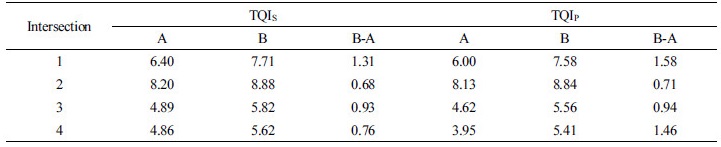
Observed up through the columns “B-A” that TQI presents best results with volume traffic reduction, even with sum or product formulation. Furthermore, it notes that the values of the TQIP column “B-A” are larger than the corresponding IQTS, indicating that the first index is more sensitive to changes attributed.
Table 6 presents a comparison values obtained for TQI with HCM and ICU, both indexes commonly used in traffic analysis. It is observed that TQI large variations not necessarily imply ICU and HCM large variations.
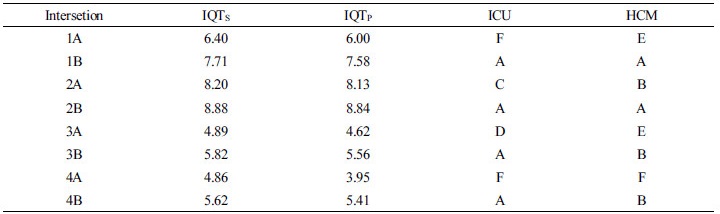
The values obtained by TQI did not follow those obtained by the ICU and the HCM. The simulation results show ICU values with classification F with TQIS ranging between 4.86 and 6.40 and TQIP ranging from 3.95 to 6:00, that represents a very high amplitude. This fact occurs as two intersections with the same capacity utilization may have different values for TQI input variables (delay per vehicle, stops per vehicle, fuel efficiency and queue length).
Another example is the existence of intersection with E classification to HCM showing its TQIS ranging between 4.89 and 6.40 and its TQIP between 4.62 and 6.00. The explanation for this is due to the fact that the TQI considers a wider range of variables in its composition to describe the quality of traffic. In addition, “delay per vehicle” values from TQI are obtained by simulation, while the HCM is calculated by its own methodology (Transportation Research Board, 2010).
Conclusions and Recomendations
The proposed index consists of indicators commonly observed in transport planning routine through computer simulation. This allows its use as a tool for assessing quality of traffic and can be applied as a criterion in the process of projects and transportation planning.
The design of the TQI based on the opinion of the expert group covered in this research indicates that the quality of the traffic of an urban intersection can be better analyzed if include in the formulation stops per vehicle, fuel efficiency and queue length, than just the delay per vehicle variable. Thus, although the ICU and HCM are used to analyze the quality of traffic, TQI covers better this concept because includes the other parameters, all of them directly related to the traffic quality.
About its formulation, the TQI application to the simulated intersections of this study showed greater susceptibility of the product equation to the traffic volume change effects, and it is recommended this as an assessment tool format.
It is important to state that the index should not be static, because as the computational simulation tools allow obtaining new variables with reliable results, the formulation of TQI should be reevaluated.
