Introduction
Material and Methods
Materials
Mix Composition
Cast and Curing
Testing:
Results and Discussions
Workability
Compressive Strength
Water Absorption
Modelling
GEP definition
Models and suggested parameters
Results of modeling
Conclusions
Introduction
Concrete is the most commonly used and widely accepted construction material worldwide [1, 2, 3]. Rapid development in the construction industry has caused a high demand for concrete. In recent years, the use of lightweight aggregate concrete (LWAC) has attracted the attention of engineers and has been successfully utilized for a variety of structural applications, including long-span bridges [4], floating structures [5], tall buildings [6], and in modern construction to reduce the self-weight of structures to decrease the dimensions of the structural sections, reducing the steel and rebar consumption, reducing the construction cost, reducing the construction time, and reducing the risks caused by the heavy weight of the structure [7, 8]. It can be easily produced by utilizing natural lightweight aggregates. Several investigations have been conducted regarding the mechanical characteristics and durability of LWAC with diverse types of waste materials or different lightweight aggregates, such as light-expanded clay aggregate (LECA) [9], recycled polyolefin waste [10], waste plastic [11], PVC granules [12], oil palm kernel shell [13], waste glass (aggregates, granules, and tubes)[14, 15, 16], pumice [17], and expanded perlite and clay aggregates [18].
Generally, due to the fact that lightweight concrete is made of porous materials, it has higher water absorption than normal weight concrete (NWC), and sometimes it has been observed that the water absorption continued for several weeks after the concrete was made and during curing. The durability of concrete plays a vital role in controlling its serviceability. The pore system of concrete has a considerable impact on its transport properties, which in turn determine its resistance to harsh surroundings [19, 20, 21, 22]. The transport phenomena in cementitious systems are primarily regulated by three mechanisms: permeability, diffusion, and absorption. Absorption refers to the capability of taking in water by capillary suction. The extent to which these three mechanisms operate is significantly determined by the size and interconnectivity of pores within the system. Water absorption has been a crucial factor in evaluating the endurance of cementitious systems [17, 18, 19, 20, 21, 22, 23]. Water sometimes carries harmful ions for concrete and is the source of many processes that reduce the quality of concrete. The primary objective of this research is to examine water absorption as it has become increasingly important for specifiers and forensic studies in assessing concrete durability. It is also crucial to precisely characterize these properties for use in service life models. For floating structures, it is necessary to consider both types of aggregates to reduce the weight of the structures and ensure the economical use of LWAC. The long-term endurance of such structures exposed to harsh environments like marine settings is heavily influenced by the water absorption of the concrete.
According to Nyame [24], mortars that utilized sand of lower weight and had a water-to-cement ratio (w/c) of 0.47 exhibited approximately twice the permeability when compared to mortars created using natural sand. Therefore, the reduction of concrete’s permeability and water absorption has received a lot of attention from many engineers, and numerous research studies have been conducted in this area. For instance, Nosouhian et al [25] reported a reduction in the permeability of concrete by employing bacterial mediation on both the exterior and interior surfaces. The biologically treated specimens demonstrated an increased resistance to water penetration, with approximately 7% greater resistance compared to untreated specimens. Also, Sadrmomtazi et al. investigated the effect of fly ash and silica fume on the permeability of concrete [26]. In another study, Tangchirapat et al. revealed that using 10-30% of fine palm oil fuel ash (POFA) as a cement replacement in concrete decreased its drying shrinkage and water absorption [27].
Recently, scientists have employed various computational techniques to minimize the need for building materials and experimental expenses. They have conducted a numerical study on the different characteristics of concrete, utilizing a range of software applications. Optimization approaches depend on Artificial Intelligence, like Neural Networks [28, 29, 30, 31, 32, 33, 34, 35], Feed Forward Neural Networks [36, 37, 38], and Multi-layer Perceptron Neural Networks [39, 40, 41, 42], have been earning considerable concentration in the study. Furthermore, certain researchers have employed regression techniques including Support Vector Regression [43, 44, 45, 46], Principal Component Regression [47, 48, 49, 50], and Weibull [51, 52, 53, 54] in order to establish a mathematical equation linking the dependent variable with the independent variables. Asteris and Mokos employed Artificial Neural Networks to forecast the compressive strength of concrete that their models could anticipate with the accuracy of the R-square value exceeding 0.9 [55]. They used non-destructive testing outcomes, such as ultrasonic pulse velocity and Schmidt rebound hammer, as the basis for their inputs. Khademi et al. conducted a research on anticipating the 28-day compressive strength of recycled concrete aggregate (RCA) utilizing Artificial Neural Networks, Adaptive Neuro-Fuzzy Inference Systems, and Multiple Linear Regression approaches [56]. The findings revealed that the artificial neural networks approach yielded superior models compared to the ANFIS approach, while the MLR method proved ineffective with an R2 equal to 0.6. This indicates that linear regressions were inadequate for forecasting study results thanks to the presence of non-linear correlations between inputs and outputs, which the MLR method failed to capture. In another research focusing on prognosticating the SFR-lightweight concrete compressive strength, the findings’ of Altun et al. showed that the neural network approach exhibited better consistency with laboratory outcomes variables than the multiple linear regression method [57].
However, optimization approaches have a limitation in that they are not able to generate an application formula through laboratory results. Because of this, scientists in the intelligence research area have started using Non-gradient methods. the approach of Meta-heuristic Algorithms like Evolutionary Computation [58, 59, 60, 61, 62, 63, 64, 65], Ant Colony Optimization Algorithms [66, 67, 68], and Artificial Bees Colony Algorithms [69, 70, 71, 72, 73], have gained popularity among IR researchers. The selection of technique depends on the data sort and the specific issue being addressed. Gene expression programming, which is a subset of evolutionary computing, has been widely utilized due to its ability to generate highly accurate formulas [74]. GEP has been utilized in various studies to predict the behavior of different materials. For instance, Gandomi et al. [75] used GEP to formulate the viscoelastic behavior of modified asphalt binder, while Algaifi et al. [76] employed it to predict the compressive strength of bacterial concrete. Similarly, Alabduljabbar et al. [77] utilized GEP to model the compressive strength of high-performance concrete (HPC) and achieved robust and reliable results. In addition, GEP has been applied to predict elasticity modulus, shear strength, tensile strength, Compressive strength, Flexural strength, and other properties in different concretes [76, 78, 79, 80, 81, 82, 83, 84, 85, 86, 87, 88, 89, 90, 91, 92, 93, 94, 95, 96, 97, 98, 99]. Broadly, GEP is a program that can be devoted to solving real-world problems in fields such as engineering, finance, medicine, and biology.
Despite all the existing methods in this field, engineers have felt a need for a straightforward and uncomplicated approach to reduce the permeability and water absorption of lightweight aggregate concrete (LWAC). To compensate for this weakness, the use of cold bitumen powder is suggested due to its suitable and economical properties [100]. The important use of bitumen is due to the presence of two important properties of this substance; Being impervious to water and sticky. In this research, laboratory tests to determine the water absorption, compressive strength, and workability properties of 5 types of lightweight concrete mixtures made with 15% LECA containing 0, 5, 10, 15, and 20% of cold bitumen powder were investigated. Additionally, for the scientific confirmation of the results, use was made of the genetic expression programming (GEP) model to predict the 28-day compressive strength of this concrete. The slump test results demonstrated a progressive decline in workability as the percentage of cold bitumen powder (CBP) increased. Also, the compressive strength of the concrete samples showed a marginal improvement when incorporating up to 10% CBP, followed by a substantial decline at higher CBP percentages (15% and 20%). Moreover, the water absorption tests revealed that the addition of CBP led to a reduction in water absorption, with the concrete incorporating 20% CBP exhibiting the lowest water absorption values. Prediction results of the 28-day compressive strength found by GEP models (based on the dataset reported in this research) had satisfactory compliance with experimental results; most of the R2 values of the models for the prediction of the compressive strength were above 0.9.
Material and Methods
Materials
The research incorporates several materials that will be described below, including natural aggregates, cement, silica fume, cold bitumen powder, and LECA.
Aggregates
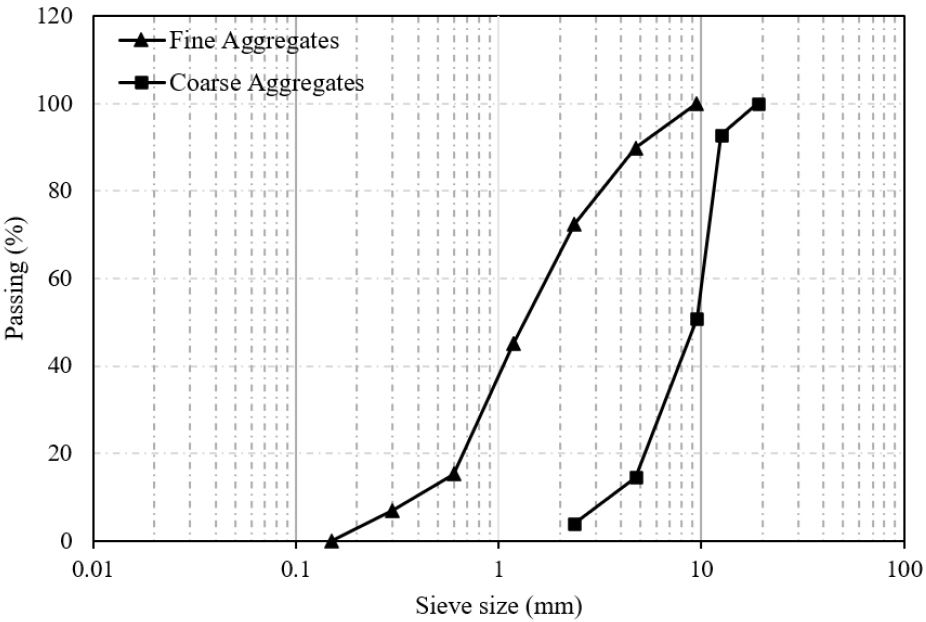
For this study, crushed natural river sand and gravel were acquired locally from mines around Mashhad City. The largest size of coarse aggregates (CA) was 12.5 mm, and the maximum size of fine aggregates (FA) was 4.75 mm. The water absorption of the natural coarse and fine aggregates was 1.1% and 28.5%, respectively. Figure 1 illustrates particle size distribution curves of fine and coarse aggregates.
Cement, Silica Fume and Water
Portland cement was utilized in the experiments carried out for this study and was produced by the Zaveh cement company in accordance with the ASTM-C150 standard [101]. The physical properties of the cement are shown in Table 1. Additionally, tap water was employed in the preparation of the concrete mixes, as water plays a crucial role in the chemical reaction with cement. Furthermore, for this investigation, silica fume (SF) obtained from the factories of Iran Ferroalloy Industries (Azna) was utilized as a pozzolanic material in all of the mixing designs for the purpose of producing lightweight concrete samples. Based on laser granulation measurements, it was determined that nearly 98% of the particle size of SF produced by this company is below 45 microns. Also, the density and specific weight of SF is 400-600 kg/m3 and 2200 kg/m3, respectively. Table 2 illustrates the chemical composition of the cement and SF.
Table 1.
Physical properties of the cement
| Material | Setting Time | Compressive Strength (kg/cm2) | |||
| Initial (min) | Final (min) | 3 days | 7 days | 28 days | |
| Portland Cement | 200 | 240 | 195 | 310 | 495 |
Table 2.
Chemical composition of the cement and silica fume
| Material | Chemical composition (%) | ||||||||
| SiO2 | Al2O3 | Fe2O3 | CaO | MgO | SO3 | K2O | Na2O | C3S | |
| Portland Cement | 21 | 4.6 | 3.9 | 63.5 | 2.9 | 2 | 0.45 | 0.5 | 1.15 |
| Silica Fume | 89.22 | 1.2 | 2.12 | 1.87 | 1.61 | - | 1.06 | 0.56 | - |
Cold Bitumen Powder (CBP)
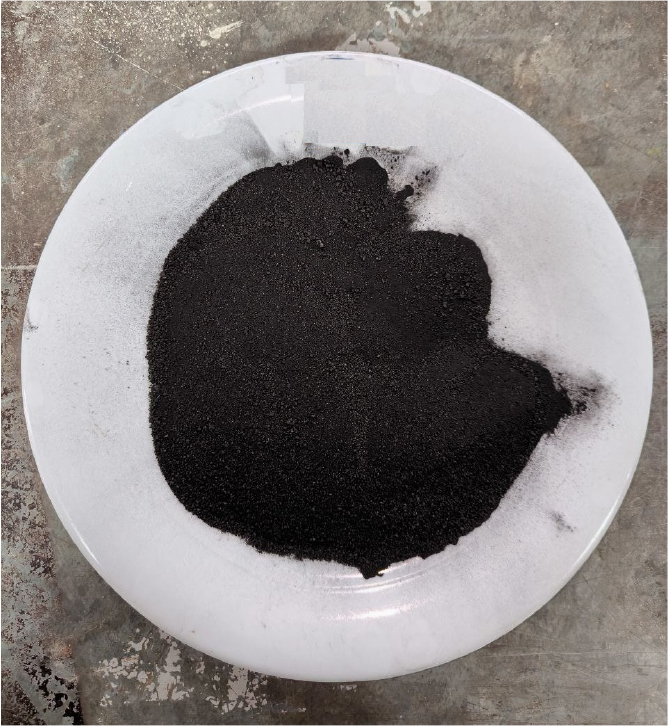
In this study, cold bitumen in powder form has been used to facilitate the experimentation process. Additionally, the maximum particle diameter of CBP was 2 mm. Figure 2 depicts the CBP used in this study.
Lightweight Aggregates
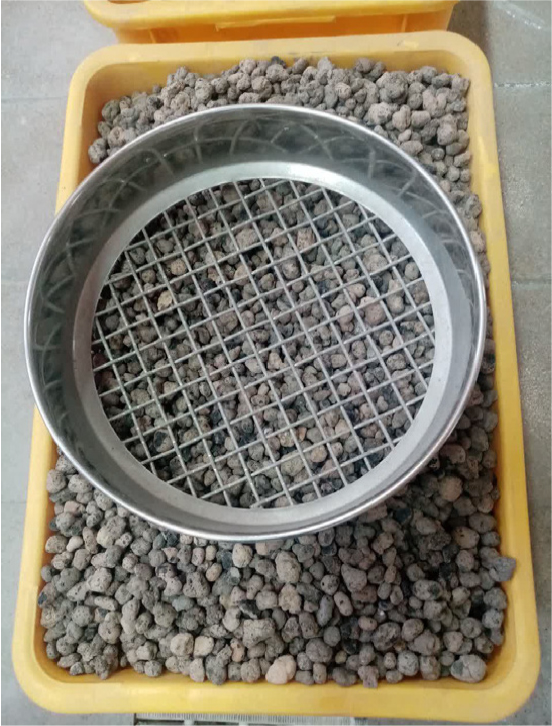
The lightweight aggregates used in this article were coarse structural lightweight aggregate obtained from a factory, which produces light-expanded clay aggregate (called LECA) with a bulk density of 670 Kg/m3, particle density of 1140 Kg/m3, and water absorption percentage of 14%. Figure 3 shows LECA aggregates employed in this research.
Mix Composition
Similar to other materials used in engineering, concrete requires a deliberate design about its properties such as durability, strength, and workability. Before concrete mixing, it is necessary to determine the appropriate mix materials and their desirable proportions. This is achieved through a procedure known as mix design. The experimental initiative aims to explore and examine the impact of different ratios (0%, 5%, 10%, 15%, and 20%) of CBP on the compressive, workability, and water absorption of lightweight aggregate concrete. The experimental program was carried out on five mixtures, as shown in Table 3. It should be pointed out that the proportion of LECA lightweight aggregates remains constant in all of the mixtures. Furthermore, silica fume was employed at a proportion of 0.1 times the weight of the cement.
Table 3.
Mix proportions of the concrete mixes
Cast and Curing
In order to prepare the concrete mixes, the coarse and fine aggregates were initially combined within a rotating drum mixer. The cement and SF were subsequently added and mixed for roughly 2 minutes, followed by the addition of water and CBP and further mixing until reaching a homogeneous mixture.
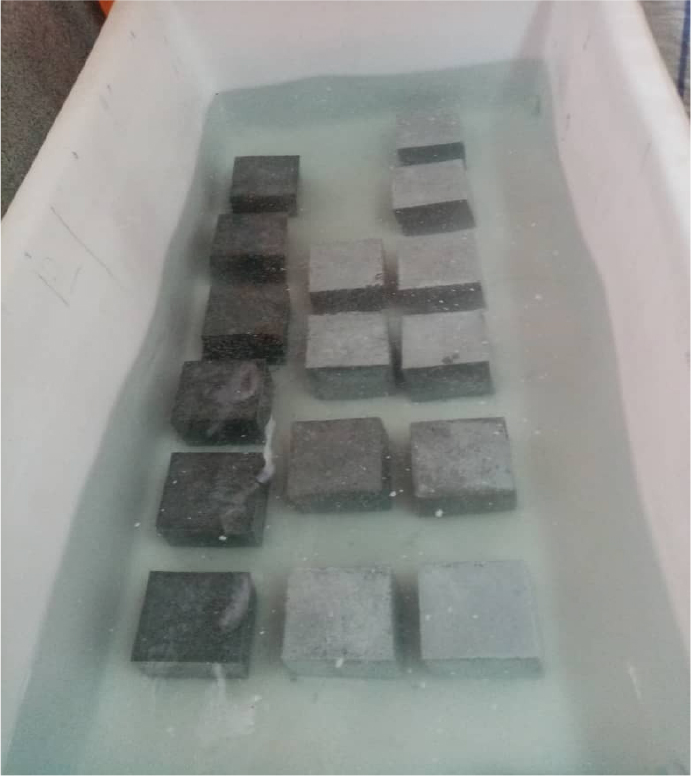
Moreover, adequate curing is crucial for concrete to achieve its potential performance. Cube concrete specimens (150*150*150 mm) were cast in plastic molds and placed in a humidity chamber for 24 hours with a relative humidity of 90% and a temperature of 22 degrees Celsius. After 24 hours, the samples were demolded and stored for 7 and 28 days in water, as shown in Figure 4.
Testing:
Slump:
The concrete slump test is a widely used technique to gauge the flow and ease of use of newly mixed concrete before its hardening, by determining its consistency and workability. The workability of the fresh concrete was assessed using the slump test, conducted by BS EN 12350-2 (2009) [102].
Compressive Strength:
The compressive strength test is the most commonly conducted examination to assess the strength of hardened concrete. In this study, the test was conducted to measure the concrete specimens’ ability to withstand failure when subjected to compressive force after 7 and 28 days of curing. The test procedures were performed in accordance with the BS EN 12390-3 standard requirements [103]. The compressive strength of each concrete mixture was determined by taking the average of the compressive strength values obtained from three specimens.
Water Absorption:
Cube specimens that were aged for 7 and 28 days were subjected to a water absorption test by ASTM C 642 standard [104]. For each mixture, three cubic samples were created, and the final water absorption was determined by averaging the water absorption values obtained from each sample. To determine the dry weight, the specimens were placed in an oven at a temperature of 100-110 degrees Celsius for 24 hours and then weighed. Subsequently, the samples were placed back in the oven for another 24 hours and weighed again. The process was repeated until the difference between two consecutive measurements was less than 0.5% of the dry weight, and the final recorded measurement was considered the dry weight of the specimen. To determine the weight of the saturated sample, the samples are placed back in a water pool with a temperature of approximately 21 degrees Celsius. After 48 hours, the specimens are taken out from the pool and weighed. Finally, the last weight recorded was considered as the weight of the specimen when saturated, and the percentage of water absorption was calculated accordingly. To determine the water absorption after half an hour and an hour, the samples were taken out from the water pool after the duration had passed and the recorded weight was considered the weight of the sample when saturated, and the percentage of water absorption was calculated based on this measurement. The water absorption rate of concrete specimens was determined using Equation 1 which Ws and Wd are the wight of satuared and dry samples, respectively.
Results and Discussions
Workability
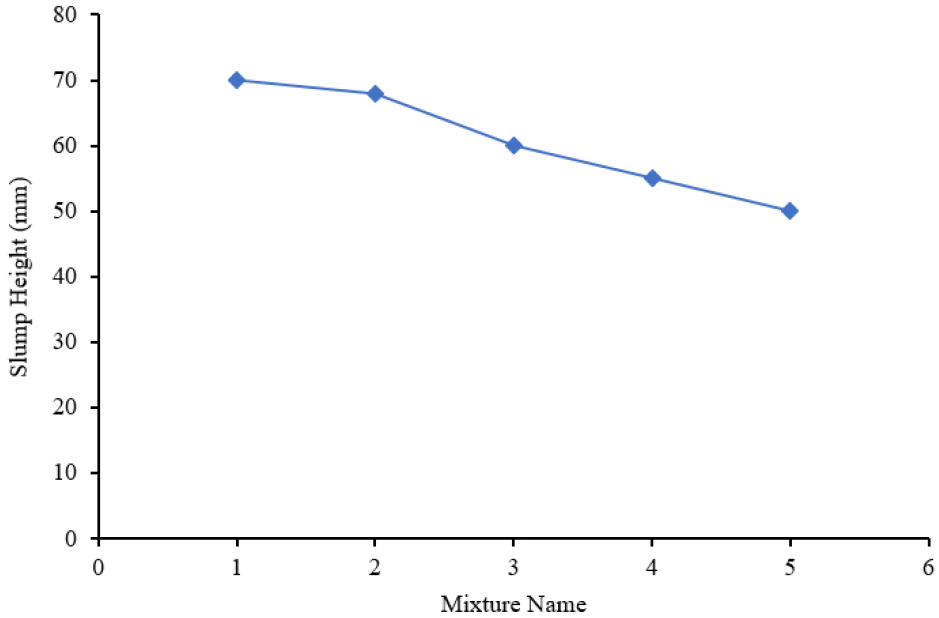
Figure 5 illustrates the results of the slump test of fresh concrete with different amounts of cold bitumen powder. The results reveal an incessant decreasing trend of the slump height from the control mixture to CBP20 indicating the mix is less workable from the control mixture to CBP20. The slump value of the control samples was 70 mm and declined from 68 – 50 mm for concrete mixtures containing 5% up to 20% CBP. As stated by Neville and Brook [105], workability can be classified based on the range of slump values: 0-25 mm is categorized as very low workability, 25-50 mm as low workability, 50-100 mm as medium workability, and 100-175 mm as high workability. CBP15 and CBP20 mixture’s slump values are 55mm and 50mm, respectively.
Compressive Strength
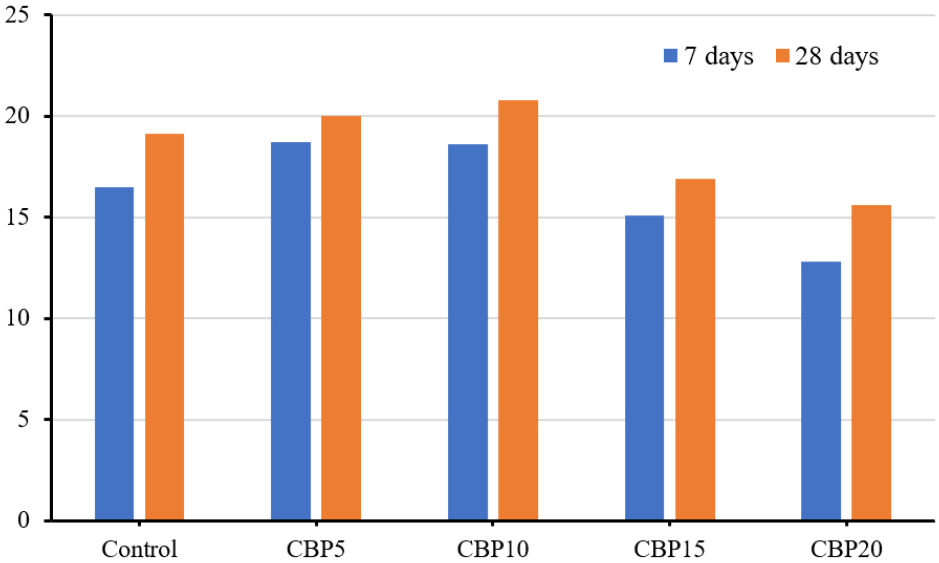
Concrete compressive strength values at 7 and 28 days are indicated in Figure 6. It can be seen that the concrete strength rises with an increase in curing age, but decreases with an escalation in the CBP percentage. The increase in strength with curing age depicts continuous hydration of concrete which agrees with previous findings [106, 107]. The compressive strength test results of the control cubic samples and those containing cold bitumen at 7 and 28-day intervals indicate that the addition of bitumen powder up to 10% leads to a slight rise in the compressive strength of concrete. However, by increasing the amount of bitumen powder to 15 and 20% of the total volume of concrete, the compressive strength has declined by 18.5 and 22.5%, respectively, so that the sample containing 20% of bitumen powder exhibits the lowest compressive strength. Moreover, after 56 days, the sample of lightweight aggregate concrete (LWAC) containing 10% bitumen powder demonstrated the highest compressive strength of 20.8 MPa. Nonetheless, this growth in compressive strength is not statistically significant when compared to the sample without bitumen powder. The decline in the strength of concrete with an increase in the content of CBP can be attributed to the lower specific gravity and less adhesion compared with the control mixture without the presence of CBP.
Water Absorption
This study utilizes long-term and short-term water absorption tests to compare the water absorption values of light structural concrete samples made with LECA aggregates and cold bitumen powder with the prescribed standards. The findings of the water absorption test for different concrete mixtures are presented in Table 4.
Table 4.
Water absorption percent of different mixtures
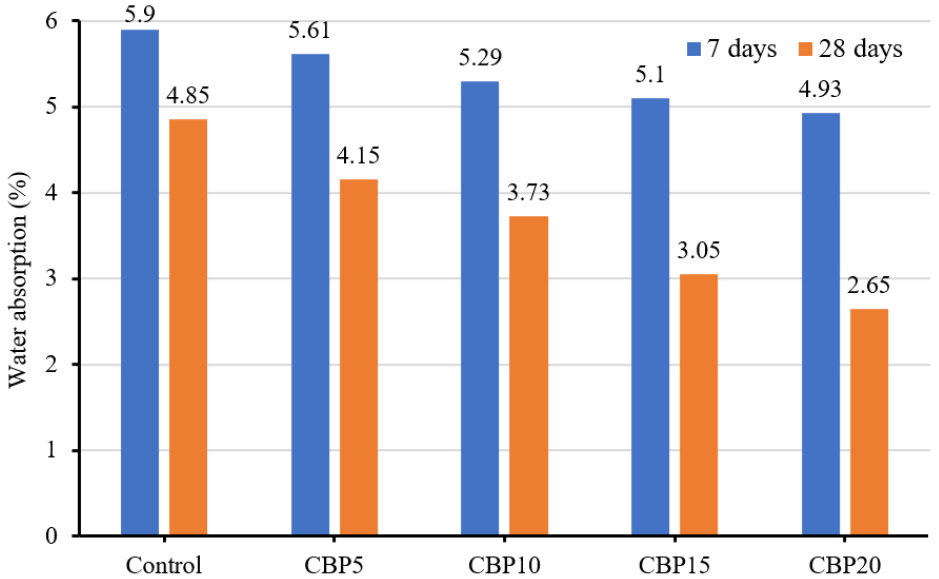
Based on the empirical data obtained, it was observed that an increase in the quantity of bitumen powder reduces the water absorption of lightweight concrete. Notably, among the tested samples, the lightweight concrete composition incorporating a volumetric ratio of 20% bitumen powder exhibited the most significant decrease in water absorption, attaining the lowest values compared to the remaining samples.
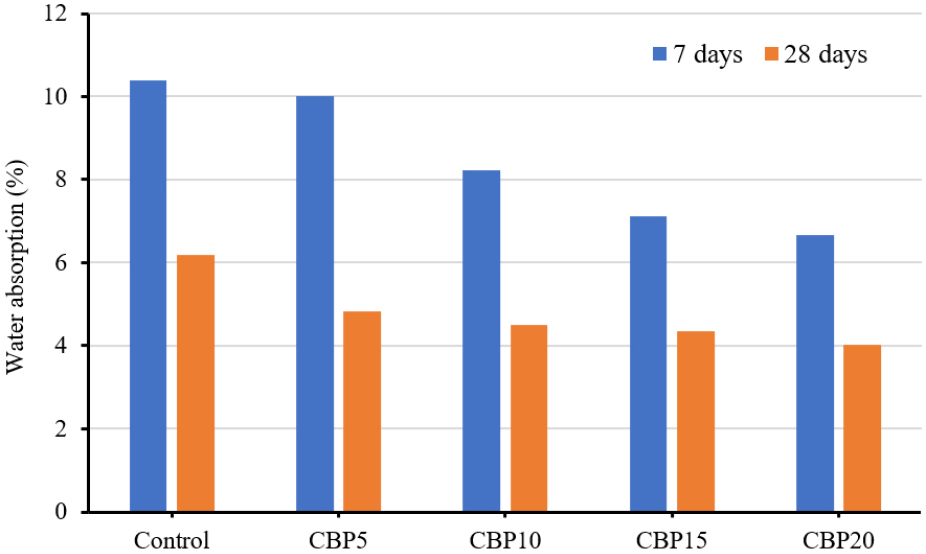
According to Figure 7, the results of the 24-hour water absorption test illustrated that increasing the amount of bitumen powder used to 5, 10, 15, and 20% will decrease water absorption by 22, 27, 29, and 35%, respectively. Moreover, it can be seen that a significant difference in the 24-hour water absorption rate has been recorded in the 7-day and 28-day samples.
Across all samples tested, the 24-hour water absorption of lightweight concrete exhibited a notable rise in comparison to the half-hour and one-hour water absorption rates. This observation highlights the strong propensity of lightweight concrete, composed of LECA aggregate, to absorb water.
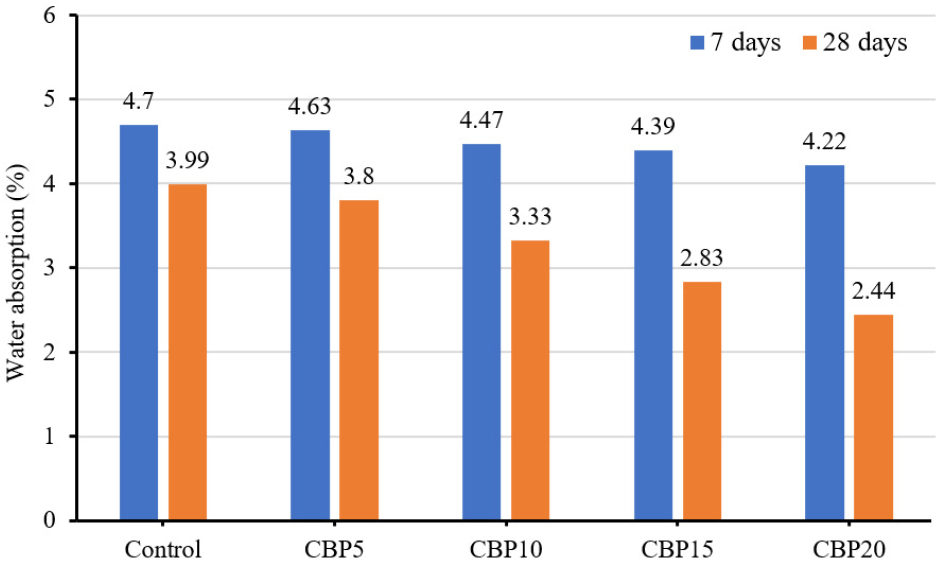
Raising the volumetric proportion of bitumen powder to 10%, 15%, and 20% in concrete leads to a decline in water permeability and absorption. However, it also results in a reduction in the compressive strength of the concrete. Therefore, when aiming to enhance the water absorption resistance of the concrete by increasing the amount of bitumen powder, it is crucial to implement appropriate measures to enhance the compressive strength of the concrete concurrently. Moreover, increasing the amount of bitumen powder up to 20% for 7-day and 28-day samples, respectively, causes a decrease of 10 and 39% in half-hour water absorption and 16.5 and 45% in one-hour water absorption. Figure 8 and Figure 9 illustrate the half- hour and one-hour water absorption values, for various mixtures.
Modelling
GEP definition
In 1991, Ferreira developed the Gene Expression Programming (GEP) algorithm and introduced it formally in 2001. GEP combines two evolutionary viewpoints, Genetic Algorithms (GA) and Genetic Programming (GP), to overcome their limitations. The genotype of the chromosome is coded as fixed-size linear strings. In contrast, the phenotype of the chromosome is represented by a tree structure called Expression Trees (ETs), which solves the chromosomes’ dual position limitation in GA and GP. GEP uses numerous operators of genetics to ensure the offspring’s chromosomes’ fitness, making it quicker than Genetic Programming. Ferreira declared that the Gene Expression Programming approach has passed the first and second natural evolutionary procedures thresholds.
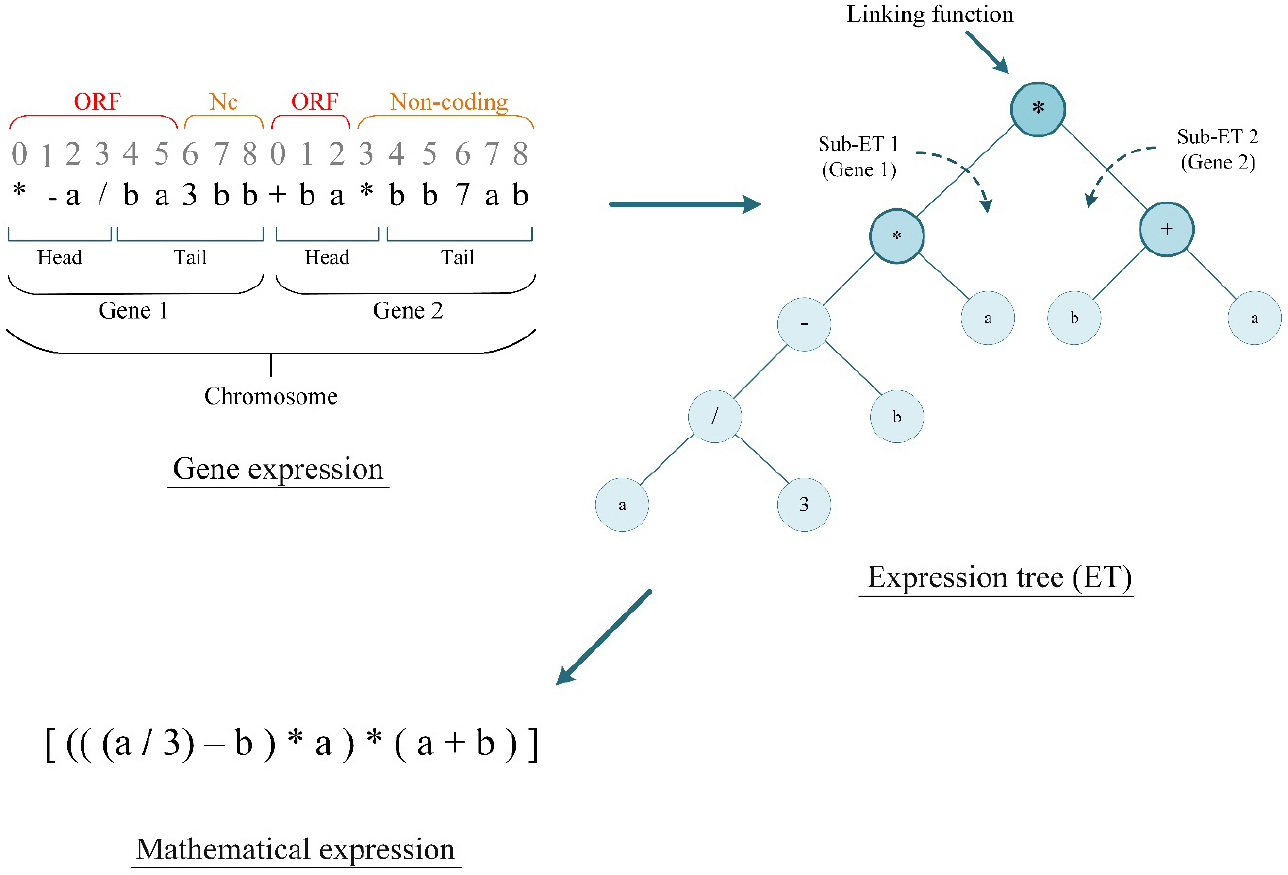
In GEP, each chromosome structure includes one or more genes consisting of a head and a tail. The head contains functions and terminals, while the tail contains only terminals. The user selects the functions, and a rational connection between input and outcome parameters is suggested. Terminals include input variables and constants. Ferreira invented the Karva language to express a chromosome, with each gene in the chromosome configuration called an ETs subset. GEP overcomes the limitations of GP by ensuring that each gene terminates in a correct ET. For instance, the linear GEP chromosome with two genes can be defined as below:
The phrase mentioned above belongs to the Karva language and is employed in Gene Expression Programming to represent genes as a compound of functions and terminals that contain input variables and numerical constants. This expression can be visualized as a tree structure, where each expression tree (ET) represents an uncomplicated mathematical relationship. Ferreira devised quadruple regulations to alter linear strings into tree structures in the Karva language. In GEP, each gene within the chromosome is an expression trees subset, also known as Sub-ETs, which are combined to form the chromosome. Multiplication serves as a linking function to connect ETs, as illustrated in the Figure 10. Generally, GEP overcomes the limitations of genetic programming by ensuring that each gene concludes with a correct ET.
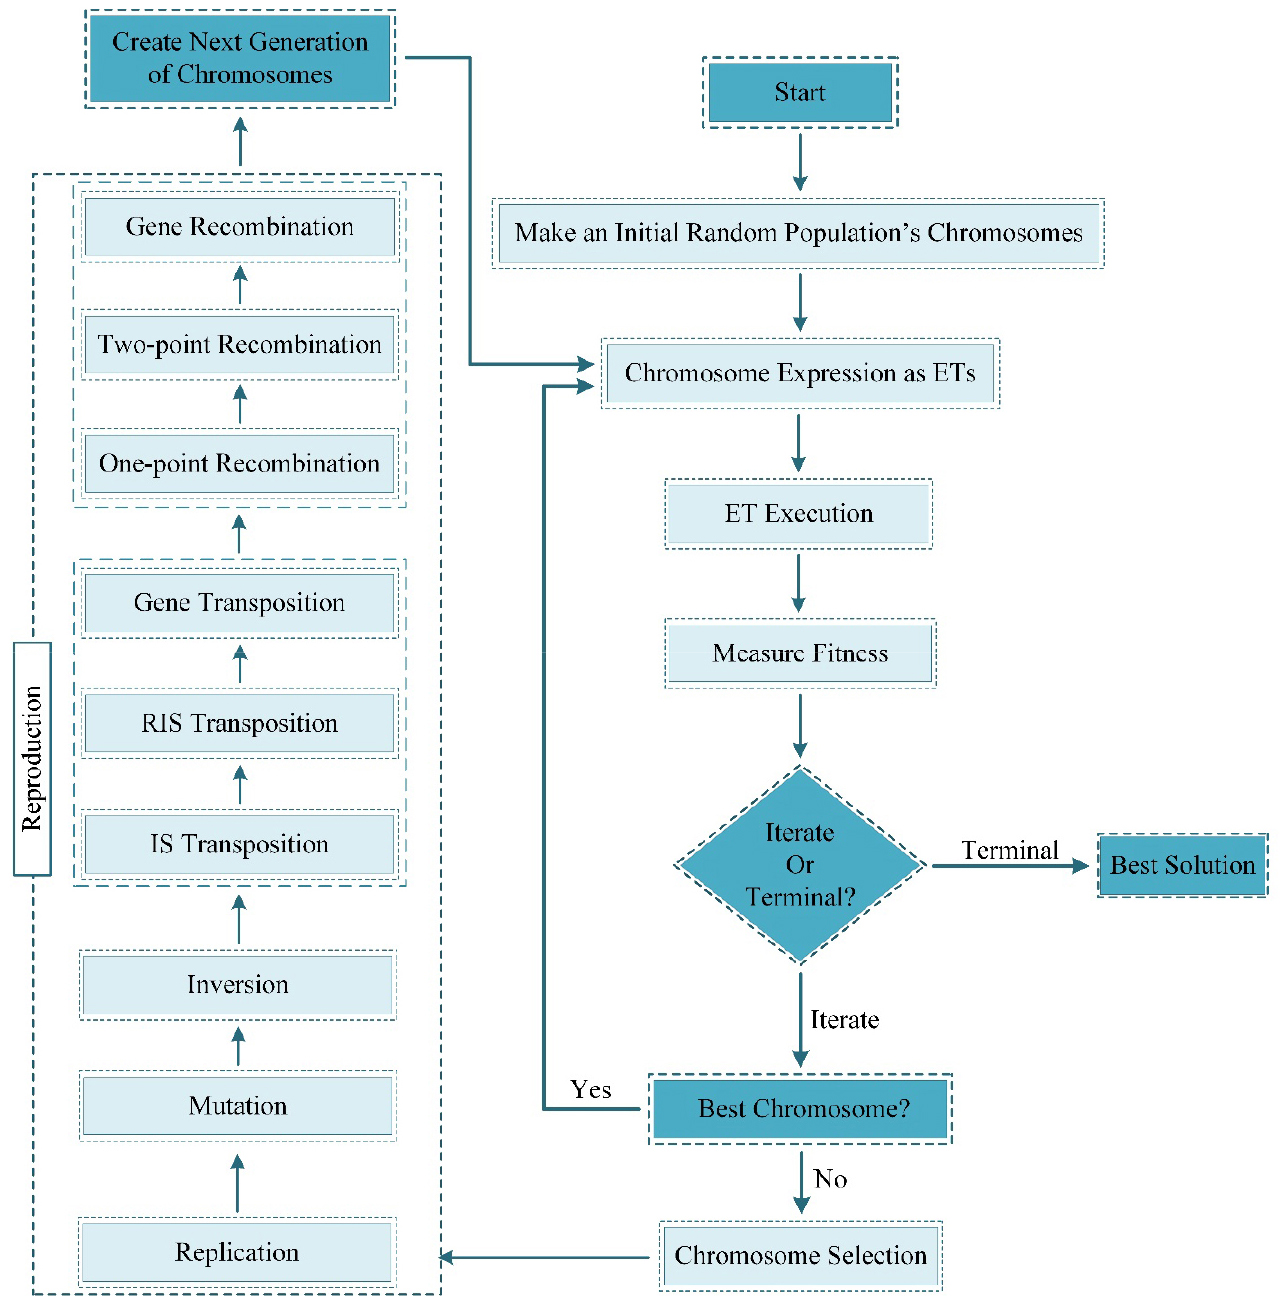
Figure 10 demonstrates that ETs do not include all variables because they are constructed using functions rather than terminals. Genes are composed of two types of components, namely active and inactive. The active components are known as Open Reading Frames (ORF), while the inactive ones are called non-coding. The presence of both active and inactive components in genes is a common occurrence in biology. Understanding the roles of these components is crucial in comprehending gene expression and regulation. In the Gene Expression Programming procedure, ETs are employed in the choice phase, and their fitness guides the generation of new chromosomes. During the reproduction phase, the genetic operator modifies chromosomes instead of their associated ETs. Figure 11 provides a general overview of the execution of the GEP algorithm.
Models and suggested parameters
The research involved analyzing 15 laboratory samples from 5 different mixing designs. Data modeling was conducted using Gen Xpro Tools-Ver 5.0 software. The objective was to predict the compressive strength of lightweight concrete by considering various parameters, and the accuracy of the predictions was verified using laboratory data. Recognizing the limited laboratory data available in this research, the authors plan to supplement the findings with additional data from existing literature to create a more robust and accurate model using the GEP method. To enhance the existing dataset, researchers have integrated data from laboratory experiments on LECA concrete conducted by Singh et al. [109], Ramya and Keerthipriyan [110], Mamatha and Mothilal [111], Othman et al. [112], Yew et al. [113], Chetan [114], and Karthik et al. [115]. These researchers have investigated the effect of different percentages of LECA on the compressive strength of concrete. To account for variations in sample dimensions across different studies, compressive strength values were standardized using shape factor [116, 117]. The model dataset was augmented to approximately 50 data items.
The input parameters used in establishing meaningful relationships between the compressive strength of the concrete mix included the percentage of Cold Bitumen Powder (CBP) added to the mix, the replacement ratio of natural aggregate with light- expanded clay aggregate (LECA), and the seven-day compressive strength of the concrete samples (). It should be noted that predicting the compressive strength behavior of concrete is a complex task due to the presence of numerous variables. Table 5 provides the specified values for the input and output variables used in this prediction model.
Table 5.
The variables quantities utilized in developed models
In order to perform the modeling of the GEP-based and other types of numerical methods, it is necessary to divide the dataset into two distinct subsets: one for training and the other for testing. The training set is employed to construct the structure of the model, whereas the testing set, which was not involved in the evolution procedure of the model, is utilized to evaluate the model’s efficacy. This approach aimed to ensure a reliable and systematic division of the data. In this study, 38 data values (80.85%) were used for training and 9 data values (19.14%) were used for testing. The grammar in this text seems to be accurate.
This study utilizes five models based on the Genetic Expression Programming (GEP) approach. The essential factors for constructing these models are presented in Table 6. Four statistical parameters, namely Root Mean Squared Error (RMSE), Mean Absolute Error (MAE), R-square (R2), Root Relative Square Error (RRSE), and Relative Absolute Error (RAE), are employed to evaluate the performance of the models. The error functions utilized in this research are provided in equations (3)-(7) below.
Table 6.
Parameter settings for the models
In relation to the aforementioned statistical calculations, “hi” represents the number of laboratory specimens, “pi” represents the forecasted outcomes value of specimens, and “n” represents the whole value of data. Moreover, a machine learning model with R2 values greater than 0.8 and lower statistical error values such as RMSE, MAE, RRSE, and RAE is considered reliable and efficient.
Results of modeling
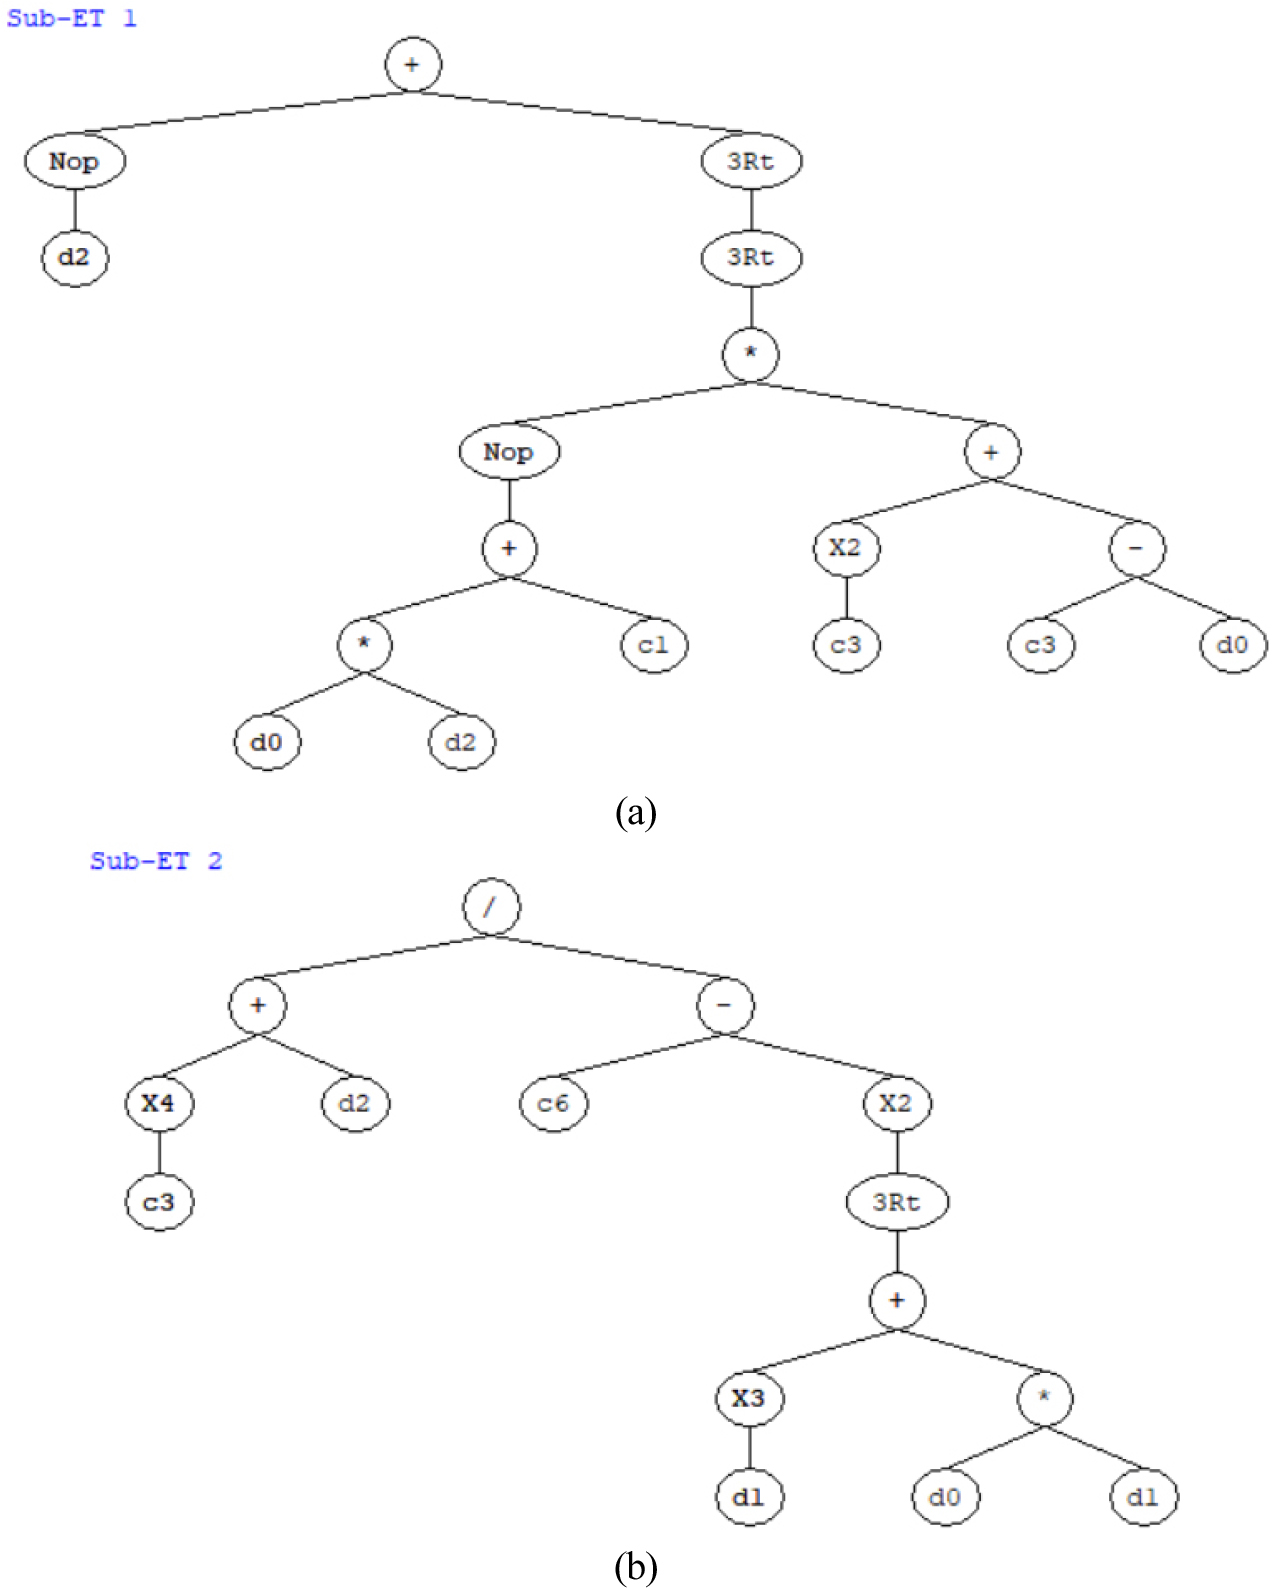
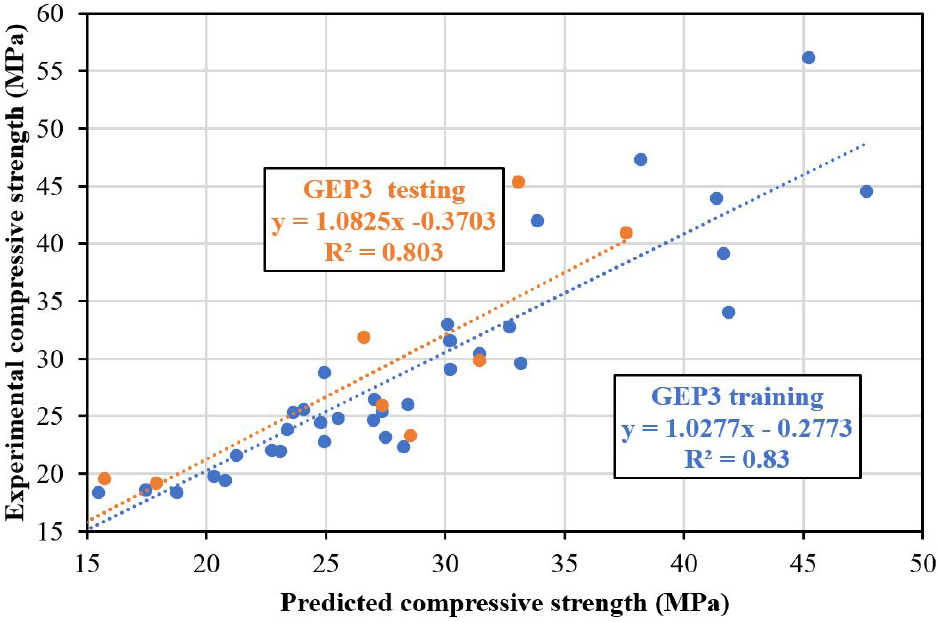
Table 7 presents the outcomes of the statistical parameters used to evaluate the constructed models. After evaluating the criteria, it was found that model GEP3 had the least amount of error and made the most accurate predictions compared to other models. The statistical parameters of model GEP3, including RMSE, MAE, R2, RRSE, and RAE, were calculated for both the training and test sets. For the training set, the values were 3.8769, 2.7733, 0.8299, 0.4165, and 0.3772 respectively, while for the testing set, they were 5.1922, 3.9118, 0.7744, 0.5256, and 0.4729 respectively. These findings show that model GEP3 is a reliable and effective predictor. Figure 12 demonstrates the ET of model GEP3.
Table 7.
Statistical criteria of the designed models
According to the ET of the GEP3 model presented in Figure 12, the extracted formula is determined as follows:
It should be noted that all the parameters defined in ET for the GEP3 model, which include d0 and d1, and d2 refer to replacement percentage of LECA, the percentage of Cold Bitumen Powder (CBP) and seven days compressive strength (), respectively. For the GEP3 model approach, the constant quantities in the formula are equal to; in Sub-ET1 C1 = -0.5423, C3 = -7.6097, and C3 = 2.1627, in Sub-ET2 C6 = 4.2808.
In accordance with the GEP3 formula, Figure 13 illustrates a robust correlation between the anticipated outcomes and the laboratory results for the GEP3 model, which covers both the training and testing sets. This indicates that the model’s prognoses are highly accurate and reliable.
Conclusions
This research tries to solve the problem of permeability and water absorption of concretes containing lightweight aggregate, LECA, by using cold bitumen powder (CBP). To accomplish this, varying amounts of bitumen were added to the lightweight concrete mix, ranging from 0% to 20%. The effect of the bitumen addition was then evaluated by examining factors such as workability, water absorption, and compressive strength at 7 and 28 days. The 28-day compressive strength predictability of this type of concrete was checked using the laboratory results and different GEP models based on three input parameters containing the percentage of LECA, Cold Bitumen Powder, and the 7-day compressive strength. The findings of this research can be summarized as follows:
ㆍThe slump test results showed a consistent decrease in slump height as the amount of cold bitumen powder (CBP) increased, indicating reduced workability of the concrete. The slump values ranged from 68 mm to 50 mm for concrete mixtures containing 5% to 20% CBP, with CBP20 exhibiting the lowest slump value that declined by 28.5% compared to the control mixture.
ㆍThe compressive strength of the concrete specimens rose with the passage of time during curing but declined as the proportion of cold bitumen powder (CBP) increased. The inclusion of up to 10% CBP resulted in a slight improvement in compressive strength, whereas elevating the CBP content to 15% and 20% caused a decrease of 19% and 25% respectively, with the sample containing 20% CBP demonstrating the lowest compressive strength.
ㆍThe study uncovered a significant correlation between the amount of bitumen powder and the capacity for water absorption. An increase in the proportion of bitumen powder resulted in a decrease in water absorption, particularly in the sample containing a volumetric ratio of 20% bitumen powder, which exhibited the most substantial reduction compared to other mixtures. Notably, this sample demonstrated a significant 35% decrease in water absorption when the bitumen powder content was increased to 20% in comparison to the control sample.
ㆍBased on statistical analysis, the output outcomes of the GEP models were highly consistent with the laboratory results, with R2 values exceeding 0.8. The GEP3 model was found to be the most effective among all models, as evidenced by its high R2 quantities of 0.83 and 0.7744 for the training and testing datasets, respectively.


