

Introduction
Material and Methodology
Definition of the object of study
Combination of algorithms for simulation
Simulation assumptions
Statistical analysis
Result and Discussions
Conclusions
Introduction
A proper HVAC system sizing is important to satisfactorily meet the needs of air conditioning in any building. An improperly sized HVAC system can result in energy waste. Therefore, sustainable and energy-efficient approaches to sizing HVAC systems in buildings play an important role.
The HVAC system sizing presents, as a fundamental step, an energy balance on the building envelope surfaces to estimate indoor zones thermal load. In general, the thermal rates request to carry out the energy balance on these surfaces can be summarized in some steps such as the conduction of heat through the envelope, air convection, short wave radiation emitted by the sun and other sources, and long wave radiation emitted by others surfaces [1, 2].
The thermal rates calculation that characterizes the building energy balance can be complex since several agents emit and reflect heat to it. Thus, mathematical models in thermoenergetic simulation software - Energyplus (E+), for example - are used to calculate the thermal load in buildings and, consequently, to dimension HVAC systems. Such models offer a detailed analysis of the thermal-energetic phenomena that occur in the building envelope [3].
Thermal-energetic phenomena related to conduction and convection are extremely important in the energy balance and were analyzed in this research. Energyplus presents an algorithms setting categorized by empirical mechanisms of heat exchange, both conduction, and conduction, to characterize the energy balance [1, 2]. Some researchers have already analyzed heat transfer in building envelopes using E+ based on algorithms related to heat transfer models by conduction and convection.
The methodology of [4] used Energyplus to perform simulations based on conduction and convection algorithms present in the software library. The model was based on an experimental dwelling located in Florianópolis (SC), Brazil. The simulation output data - air temperature in the building and heat gain and loss through the envelope - were compared with measurements carried out in the dwelling. The heat gains by conduction obtained in the simulation with the Conduction Finite Difference algorithm were about 4 times greater than the result obtained by measurement. Simulations based on the CTF conduction algorithm returned a heat gain value of 90% over the measurement. There were also temperature differences when comparing values obtained in the simulation based on the algorithms of the convection coefficients with values obtained in the measurement.
In contrast to what was indicated by [4], the studies [5], and [6] used the Conduction Finite Difference algorithm to predict the thermal behavior of buildings using models in Energyplus and concluded that models based on this heat conduction algorithm presented values close to the measured data.
The research developed by [7] performed simulations in Energyplus based on the Computational Fluid Dynamics (CFD) method in several buildings in a residential neighborhood. As a result, the research indicated that the external convective coefficient calculated by the Adaptive and Simple Combined Convection algorithms was the closest to the CFD method among the five numerical methods available in E+. The work carried out by [8] elaborated a series of tests to verify algorithms that describe the conduction of heat in E+. The authors verified that the CondFD algorithm presented stability problems, also errors in the description of the thermal conductivity when it assumes variable values, and inconsistencies when updating transient terms.
The proper algorithm choice for the characterization of conduction and convection phenomena in energy balance in buildings is a fundamental step in the estimation of thermal load for designing HVAC systems. Poorly sized systems can result in a 20% reduction in energy efficiency and a drop of up to 50% in equipment lifetime [9]. Thus, studies that enable energy efficiency measures for artificial air conditioning in buildings and incorporate fundamental requirements regarding the correct sizing of these systems are important.
The variability of heat transfer algorithms available in the Energyplus library requires a comparative study to analyze the behavior of each group of algorithms in sizing HVAC systems in buildings. This study, therefore, evaluates the impact of using different conduction and convection algorithms available in the Energyplus v.9.3 software in a residence located in Rio de Janeiro, Brazil.
Material and Methodology
The main steps of this research consist of: (i) definition of the case of study; (ii) algorithms arrangement for simulation; (iii) simulation assumptions and statistical analysis. This section should describe the study design, materials, measurement methods and procedures, and statistical methods.
Definition of the object of study
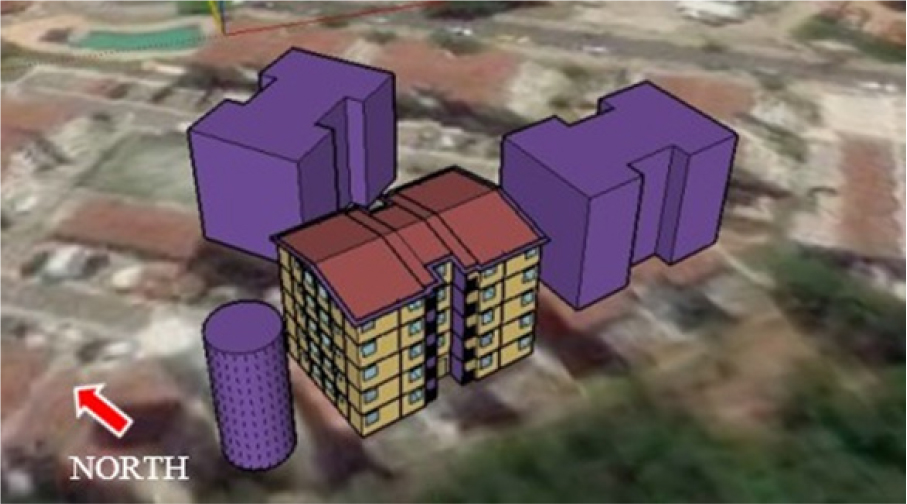
The object of this study consists of a social apartment block with 2-bedroom units (43.95 m²) that constitute a housing complex located in Rio de Janeiro-RJ, Brazil. The model follows the same characteristics as the real building concerning the envelope, construction materials, routine use, openings, solar orientation, and volume. The program ©Sketch Up Make 2017 was used to model the apartments. Each room in the apartment is a thermal zone. In the end, the estimated thermal load of each apartment is the sum of the estimated thermal load of each room.
The ©Energy Plus software version 9.3.0, was used in association with ©Open Studio plugin, to estimate the thermal load of the apartments. In Figure 1 can be notice the modeled and geolocated building. The purple objects surrounding the building represent neighboring buildings. These elements serve to approximate the simulation results to the actual conditions of the wind regime and solar radiation incidence. According to [7], the shape of the neighborhood has a complex influence on the local microclimate. The microclimate should not be disregarded, as errors can be observed in the building’s energy performance calculation.
The exterior walls of the building are solid concrete (10 cm) coated with textured paint. The colors of the texture are green, white, and brown with absorption values equivalent to 0.9, 0.3, and 0.9 respectively. The internal walls are similar to those external ones but coated with white paint. The floor of each apartment is a concrete slab (10 cm) with ceramic coating. The building roof consists of fiber-cement tile (6 mm), non-ventilated air chamber with thermal resistance equivalent to 0.2100 m² K/W. The value of the convective coefficient used to calculate the thermal resistance is according to the methodology presented in chapter 19 of [10]. The external and internal doors are made of wood (3 cm) and the windows are made of transparent glass (4 mm).
Table 1 presents the thermal and physical properties of the building envelope materials. The model calibration follows a statistical methodology, based on electricity consumption, as described by [10], according to [9].
Table 1.
Properties Materials
Combination of algorithms for simulation
The algorithms investigated in this research have peculiarities in their logic for estimating convective and conductive coefficients according to climate variables, material properties, and surface roughness and inclination [11]. The algorithms are presented in 2. The combination of these algorithms was performed into three groups. For each combination group, it was randomized the outer surface convection and conduction algorithms. This strategy was adopted to perform the analysis of variances. Thirty possible combinations were obtained.
Table 2.
Energy Plus Algorithms
Simulation assumptions
The considerations on the building characteristics were based on the Brazilian standard ABNT NBR 15220 [12]. The particularities related to routine use, equipment operational routine, occupancy, and thermodynamic parameters were based on the simulation methodology presented by the Brazilian Technical Quality Regulation for the Energy Efficiency Level of Residential Buildings (RTQ-R) published in 2012.
Each apartment was modeled considering each room a thermal zone, as the internal walls influence the thermal balance. Thermal zoning, classification of environments, analysis of boundary conditions, and building shading elements were performed using the software ©Sketch Up Make 2017. The behavior of the thermal load was simulated in the software ©Energy Plus version 9.3.0, associated with the plugin ©Open Studio.
It was considered only the first and fifth floors, four residential units each, due to reduced variability of results of other floors. The simulation input parameter used was a weather file of Santos Dumont-RJ airport, in Brazil, the closest location to the case study, as well as its design day. Besides, monthly soil temperature adjustments were performed through the SLAB tool.
Statistical analysis
Statistical analysis was based on parametric and non-parametric tests. The confidence percentage of the tests is 95%. They raised two hypotheses for the tests, null, where the means or medians of the groups are equivalent if the p-value is greater than 0.05, and alternative, if the p-value is less than 0.05. These hypotheses apply to ANOVA and Kruskal Wallis, respectively [13]. The data were processed using Rstudio software. Performing the non-parametric Kruskal Wallis test was necessary because the data did not meet some basic assumptions for performing the ANOVA test [14]. Qualification of the tests occurred through Post Hoc tests. It was adapted to the Duncan Bonferroni method test due to its more conservative nature [15]. The degree of significance was also evaluated [SG], composed of special characters, where [*] has a low degree of difference, [**] medium degree of difference, [***] high degree of difference, and [****] very high degree of difference. The other special characters represent that there is no considerable degree of difference.
Result and Discussions
Table 3 presents the average and median values of the total thermal load in the building.
Table 3.
Simulation results in kW
The data for environments 101 and 104 present abnormalities, since the p-value is less than 0.05, assuming the alternative hypothesis. The data for the other rooms presented normality, since the p values are greater than 0.05, assuming the null hypothesis. The value of [w] was also evaluated, considered a statistical value that measures the normality of the data. The closer to 1, the greater the chances that the data is normal.
Levene’s test indicated that the data present homogeneity, since the p values were greater than 0.05, the null hypothesis was assumed. For the test, the mean of the values was considered, since ANOVA considers the mean value differences. The presence of outliers was also analyzed and the presence of two outliers per group of algorithms was observed for apartments 101, 104, and 501. For the evaluation of extreme outliers, a limit of 1.5 times the interquartile range.
As mentioned earlier, the data lack basic assumptions to have reliability in the ANOVA test. However, the non-parametric Kruskal Wallis test was considered. The results of ANOVA and the Kruskal-Wallis test are shown in Table 4. All apartments show data with a p-value less than 0.05 [5.00E-02] for both parametric and non-parametric tests. Based on this condition, the alternative hypothesis is assumed, there is at least one significant difference between the means and medians of the groups. From the difference found between the groups present in Table 4, the degree of significance (SG) was evaluated to locate which groups diverged the most from each other.
Table 4.
Analysis test statistics
In Table 5(a), 5(b), 5(c) was present the groups with different intensities for (SG). The PostHock test was performed twice, the Tukey -HSD test due to the use of the parametric test and the Duncan - Bonferroni test for the non-parametric test.
The data presented in Table 5(a), details the degree of significance (SG) of the SIMPLE-Adaptive convection group. All apartment data showed significant differences, however apartments 101, 102, 103, 501, and 502 have a higher intensity of (SG) when using Tukey’s test. The same result is observed when using the more conservative Duncan test, except for residence 102, where there is a higher degree of (SG).
The data for the [TARP-adaptive design] group in Table 5(b) show no significant differences using the Duncan test. In contrast, the data show significant differences using Tukey’s test. The differences are found in households 101, 104, 503, and 504. The [TARP- SIMPLE] group also showed significant differences using the Tukey test. Households 102, 103, 501, and 502 show a higher degree of (SG). However, these same residences showed a lower degree of (SG) when applying Duncan’s test.
Table 5.
Result tests POST-HOCK [a,b,c]
Conclusions
Through the numerical model, a significant variability was observed in the adoption of different algorithms for thermal load sizing of social house cooling. The cooling load estimation is significantly influenced by the use of different combinations of algorithms, both through parametric and non-parametric tests. However, the alternative hypothesis was assumed for the two tests, that there is at least one significant difference between the means and medians of the groups surveyed in this research. These differences are more significant when comparing the [SIMPLE-Adaptive convection] and [SIMPLE-TARP] groups. It is not possible to point out which combination algorithm is ideal since they have peculiarities that require specific work to evaluate the building to examine the particularities addressed by these logics. It can be concluded that the algorithm combination is relative and specific to each case study. Finally, it is suggested as future studies an analysis of variances considering groups formed by external surface convection algorithms and groups formed by conduction algorithms. The qualitative analysis of the building is also recommended concerning the logical characteristics presented by the software, as they present peculiarities, in the thermal balance, orientations, and characteristics of the building’s surfaces.
