

Introduction
Comparative Assessment of Selected Sustainability Strategies Applied to Urban Neighbourhoods in Brazil, Germany and Sweden
Governance
Urban Form
Energy Consumption and Energy Supply
Overall Case Study Analysis and Main Challenges to be Addressed
Conclusions
Introduction
Cities can be recognized as a fundamental system to promote sustainable development, balancing social, environmental and economic aspects, and developing features of adaptation or resilience. Batty (2008, p.5) defines cities as systems composed by “sets of elements or components tied together through sets of interactions… around land use activities”. In the last years, sustainability criteria and system’s approach have become more relevant in urban development, once the efficiency and the level of services could be enhanced while lowering environmental and social impacts, and related costs.
Aside the benefits, cities have faced several challenges to integrate sustainability strategies in urban development projects, internationally and also in Brazil. Firstly, urban planning and management according to sustainability criteria require a clear understanding of urban systems, their subsystems and interactions (Daniell et al., 2005), which are numerous and involve different sectors and organizations. In addition, planning and management methods are often based on top-down approaches. Bottom-up decision-making models could assist planners to better define parameters and assess the primary urban needs and elements, but they are still scarce and poorly developed and used. “Cities have been treated as systems for fifty years but only in the last two decades has the focus changed from aggregate equilibrium systems to more evolving systems whose structure merges from the bottom up” (Batty, 2008, p.1). In the urban system, the territory is a key transversal element to integrate different sectors and it should be properly planned and managed to organize the multiple systems as well as to promote social and territorial cohesion (Energy Cities; Ademe, 2008).
Recently several researches have shifted the focus on urban sustainability from the city-scale towards the development of neighbourhoods (Engel-Yan et al., 2005). Although, historically private developers have act as the main neighborhood scale designers, frequently feeling little motivated to implement more integrated and sustainable solutions (Wheeler, 2004). Besides, urban systems are not considered, in general, as “combined facilities”, but designed and managed independently by specialists from individual sectors, as building design, water distribution, wastewater treatment, waste collection, power supply and transport, for instance (Engel-Yan et al., 2005). Thus, system’s approach in urban development still appears as a challenge for the involved stakeholder’s in many cities around the world. However, for Engel-Yan et al. (2005), a proper understanding about the conditions and potentials of neighbourhood development is important to produce more efficient and high-quality local infrastructure, land use and buildings.
This paper aims to discuss strategies for urban sustainability at the neighbourhood scale, by applying a comparative framework to selected urban neighbourhoods located in Germany, Sweden and Brazil. The comparison of different urban situations allows not only to develop a relative performance analysis, but also to identify the most promising strategies for certain contexts, which are analysed in the conclusion remarks.
Comparative Assessment of Selected Sustainability Strategies Applied to Urban Neighbourhoods in Brazil, Germany and Sweden
The present analysis is based on a framework defined to support a comparative assessment of selected sustainability strategies in the neighbourhood scale. The framework resulted from the analysis, comparison and integration of certain multicriteria and well established parameters and indicators which could be observed in the study of four selected urban neighbourhoods: Cidade Pedra Branca (Palhoca, Santa Catarina / Brazil); Kronsberg (Hannover/ Germany), Vauban (Freiburg/ Germany); and Hammarby Sjöstad (Stockholm/ Sweden). The case studies refer to urban areas which have been considered, worldwide, as important practical references in the integration of urban development and sustainability issues. The framework is organized according to institutional (i.e., governance), technical (i.e., urban morphology, urban mobility, and energy), and economic aspects (i.e., overall capital costs and operational costs). Parameters and indicators were selected considering their extent (if they are important and/or measured in more than one neighbourhood) and/or their high potential/ improved performance in solving social, environmental or economic challenges. Literature review was combined to information collected in technical site visits and interviews, as well as in consultation made with stakeholders involved in the urban development in these areas. The following items present the main results from the assessment, based on the framework application.
Governance
The main governance aspect relates to the implications of land ownership and project coordination to the pattern and schedule of the urban development.
In Kronsberg, most of the land is owned by the Municipality of Hannover, who took over the implementation of the neighborhood and has managed, directly, the most of the real estate properties, by applying leasing instruments (93% of buildings are owned by the city, according to Rumming, 2004a). The full coordination by the public body allowed to achieve higher levels of building and energy performance, due to the greater control in the specification, construction, approval, and performance monitoring of enterprises. On the other hand, to perform this strong coordination, it was necessary to greatly increase the time devoted to the neighbourhood planning (Table 1). Additionally, Kronsberg was able to achieve the largest share of units for social housing, among the cases studied, due to the public ownership of the most of the housing units.
|
Figure 1. Planning and construction phases of urban development. 1Rumming (2004a); 2Frey (2011); 3Fraker (2013); Stockholm Stad et al. (2011); 4Pedra Branca (2014). |
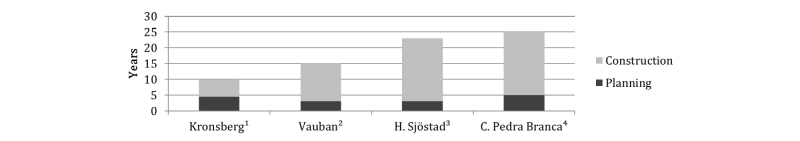
In the case of Vauban, the City of Freiburg was the main land owner and sold 70% of the plots to “ownership groups”, who were responsible for building the houses for their own use (Frey, 2011). This solution, as in the case of Kronsberg, increased the time devoted to the planning of the neighborhood and especially the construction period (Figure 1). Many actors, with different needs, participated, which implied in less standardization. Still, the construction quality and the performance of buildings could also be improved.
Hammarby Sjöstad general masterplan was designed by the Stockholm municipality, but it has been detailed and implemented within a significant participation of the private sector. The time spent in planning has been reduced and the standards and performance control have been less demanding than the previous cases (Figure 1). Besides, social housing units could not be identified in this neighbourhood. Cidade Pedra Branca presents similar scale and housing characteristics when compared to Hammarby Sjöstad, as the period of planning and construction (Figure 1). In Hammarby Sjöstad, however, Stockholm City articulated the project of the multiple urban systems (water, energy, solid waste, and transportation, among others), assisting the planning and implementation of combined urban services, as a strategy to improve the “metabolism” of the neighborhood as a whole, turning it more cyclical and efficient. On the other hand, Cidade Pedra Branca has been planned and developed entirely by the private sector, and interactions to the public services have not been treated in an integrated development plan.
Urban Form
In the present work, urban density and land use are assessed and discussed as part of the urban morphology.
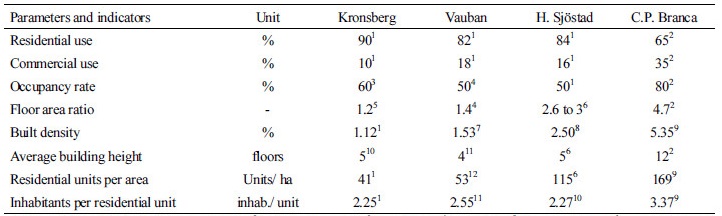
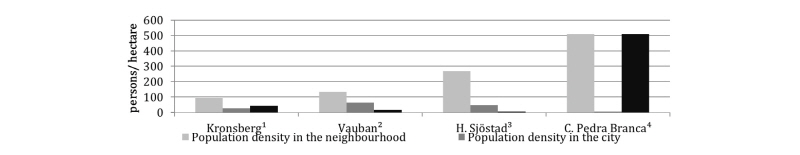
Looking at the population density in Figure 2, it is possible to verify a huge difference among the areas, from 93 inhabitants/ha in Kronsberg (Fraker, 2013) to 508 inhabitants/ ha in Cidade Pedra Branca (Pedra Branca, 2014). All neighbourhoods are denser than their related city average values. On the other hand, in an international comparison and in a progressive scale, Kronsberg presents similar values to the central area density found in Sao Paulo; Vauban density is similar to the central area density of Mexico City or New York; Hammarby Sjöstad, in turn, corresponds to the densest district in Sao Paulo; and Cidade Pedra Branca, to the densest areas in Mexico City or to the central area of Mumbai (LSE Cities, 2011).
With regard to the land use distribution presented in Table 1, Vauban is the most “residential “area, with a rate of just 0.12 employee per inhabitant. Hammarby Sjöstad and Kronsberg are in an intermediate position (0.21 and 0.46, respectively) and Cidade Pedra Branca has the proposal to create one job per inhabitant. The observed higher population densities are product of higher built density, the higher number of persons per unit and the higher quantity of residential units per plot area, in Cidade Pedra Branca, but also in Hammarby Sjöstad. The built density considers the total built area divided by the total area of the plots which can be occupied with construction; it also corresponds to the general floor area ratio implemented in the area as a whole. As showed in Table 1, in the case of Kronsberg, and Hammarby Sjöstad, the floor area ratio refers to the average predicted value; in Vauban and Cidade Pedra Branca, the built density is higher than the floor area ratio, thus indicating that additional built area was included.
Accessibility and Mobility
Accessibility and mobility refer, respectively and in the present work, to the location of the neighborhoods in their cities and regions, and to the conditions of urban connectivity and transport, involving, mostly, land use, urban design and transport systems.
Firstly, Table 2 compares different factors which affect transport mode split in the case studies. The table shows that Vauban is the closest neighbourhood to the city centre. This could justify, together with the infrastructure available for walking and cycling, the highest share of non motorized transport trips. On the other hand, people who need to use motorized transport find the public transport tariff very attractive in Vauban, compared to other European cases. In addition, it is very difficult to own a car there, because parking places are scarce and very expensive. Kronsberg, in turn, could be classified as a suburb of Hannover due to the larger distance to downtown. However, it presents certain land use and economic conditions which motivate the local economy, once trips made on foot are almost 30% of all trips. Nevertheless, the share of cars in the area is very expressive due to the lower restrictions for using this mode as well as the higher public transport tariff.
Hammarby Sjöstad is located in an intermediate distance from Stockholm city centre (6km), as indicated in Table 2. It is the area with the highest share of public transport, even considering the greater local tariff, in comparison to Vauban. Motorization rate is higher but citizen leave their cars in favour of public transport. The public transport network was extended to Hammarby Sjöstad when the first inhabitants came in and it is very accessible and attractive for short and long distances. Cidade Pedra Branca is located in the metropolitan area of Florianopolis and it will correspond to a small Brazilian town of about 30,000 inhabitants when completely built. The neighborhood is planned to offer a number of jobs equal to the number of residents, favouring non-motorized transport for local access. However, the regional road system is already congested and there is no mass transit alternative, even planned.
Energy Consumption and Energy Supply
Energy efficiency in buildings, energy consumption in urban transport and the share of renewable energy in power and heat production were assessed.
With regard to the energy efficiency in buildings, performance goals were established during the planning stage, in Kronsberg, Vauban, and Hammarby Sjöstad. Kronsberg and Vauban decreased around 55% (Rumming, 2004a) and 64% (Fraker, 2013), respectively, their energy use in comparison to the average consumption of traditional buildings (Lapillonne et al., 2012; Levine et al., 2007; Harvey, 2013 apud Lucon et al, 2013). In Hammarby Sjöstad, buildings have higher energy performance than Swedish traditional buildings, consuming almost 30% less energy (Fannon, 2009 apud Fraker, 2013). However, the apartments in Hammarby Sjöstad consume virtually twice the energy used in apartments in Vauban, for instance. In Kronsberg, as the urban development was driven almost entirely by the city, institutional approval and audit of enterprises were defined and allowed to control the results according to the initially defined goals, reinforced by active building owners action. In Cidade Pedra Branca, no special building standards upgrade could be identified in the construction report (Pedra Branca, 2010) and no local energy consumption metering program was already implemented.
The reduction in the energy load contributes to increase the share of renewable energy. Therefore, 93% of Vauban energy consumption is attended by renewable, 22%, in Kronsberg and 17%, in Hammarby Sjöstad. Vauban and Kronsberg adopted photovoltaic systems, wind, solar water heating and biomass cogeneration systems. Hammarby Sjöstad adopted integrated technologies and systems, particularly sanitation and energy. In Cidade Pedra Branca, solar heating systems were planned to be installed in the top of buildings, to heat tap water, and be complemented by gas fired heating systems, but the installed capacity could not be identified.
Energy consumption in transport per passenger per year could not be direct identified in the literature review. It was calculated based on the method presented by Marins and Romero (2013), considering: a) energy consumption per vehicle technology and fuel, in MJ/passenger km: 0.48 for bus (Metro/SP, 1998); 0.79 for light rail transport – LRT (Newman and Kenworthy, 1999); 3.21 for gasoline car (Metro/SP, 1998); 4.49 for ethanol car (assumed, according to the fuel efficiency of ethanol cars in relation to and gasoline cars); and 1.80 for diesel cars (Nylund, 2013); b) mobility index: 3.50 trips/person in Kronsberg, Vauban and Hammarby Sjöstad (based on Transport for London, 2009, United States Transport Department, 2011 and Technical University of Denmark, 2014), and 1.67 trips/person in Cidade Pedra Branca (based on the average for cities with 500 to 1,000 thousand inhabitants in Brazil, according to ANTP, 2009); c) average vehicle occupation, in persons/ vehicle: 38 for bus (EMTU/SP, 2008); 123 for LRT (NTU, 2004); and 1.5 for cars (ANTP, 2009); d) operation period (assumed): 20 hours/day and 300 days/year; e) average distance per trip (assumed): 1km, for walking; 3km, for cycling; the distance from each neighbourhood to the city centre, for public transport and cars; f) fuels (assumed): 50% of diesel and 50% of gasoline cars in Kronsberg, Vauban, and Hammarby Sjöstad; 50% of ethanol and 50% of gasoline cars in Cidade Pedra Branca; 100% diesel in buses and 100% electricity in LRT, for all cases.
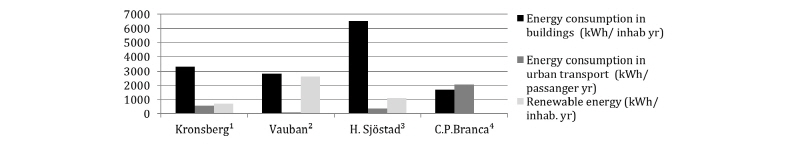
Looking at the average energy consumption in transport per passenger per year presented in Figure 3, it is possible to notice that the further and more car dependent is the area, more energy the area needs to provide transport services. In this respect, Cidade Pedra Branca would consume 3.6 times more energy in transport than Kronsberg, 5.5 times the energy used in Hammarby Sjöstad and 20 times more energy than Vauban. Vauban presents the highest performance regarding energy use in transport, especially due to the car restriction combined to the huge incentives to non motorized and public transport. Hammarby Sjöstad emerges in a second position; in this case, well connected and accessible public transport was the main factor to decrease energy consumption. Kronsberg, in turn, is a suburban area and has a high share of cars, leading the area to achieve an intermediate performance regarding energy consumption in urban transport.
Cost Indicators
The marginal costs related to the strategies adopted in the neighborhoods, compared to the traditional urban development areas, were analysed. Regarding the improvement in building scale, Kronsberg, Vauban and Hammarby Sjöstad demanded to increase up to 10% the project cost when compared to similar traditional buildings; in Cidade Pedra Branca, these costs were 28% higher. In the urban scale was quite difficult to obtain overall figures that could represent an increment or discount in the cost of the infrastructure systems as a whole. This value could be obtained only for Vauban -4% and Cidade Pedra Branca -24%. The marginal costs are illustrated in Figure 9.
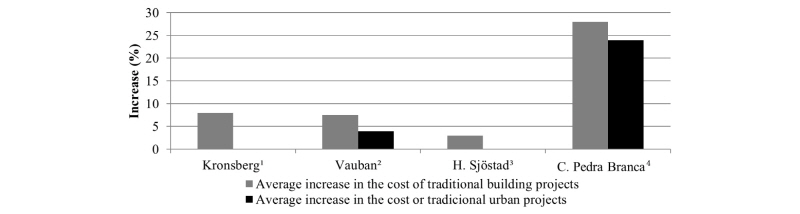
Furthermore, analysing the absolute values of infrastructure costs and the total costs per built area (Figure 10), it turns out that Cidade Pedra Branca has done proportionally lower investment, although the percentage of investment in relation to the Brazilian reference is quite high (28%). This demonstrates that the Brazilian pattern of urban development, according to the aspects considered in this study, is still low; and the building and infrastructure standards adopted in Cidade Pedra Branca, although higher than in other areas in Palhoca, Great Florianopolis and even in Brazil, could be further improved when compared to the international case studies.
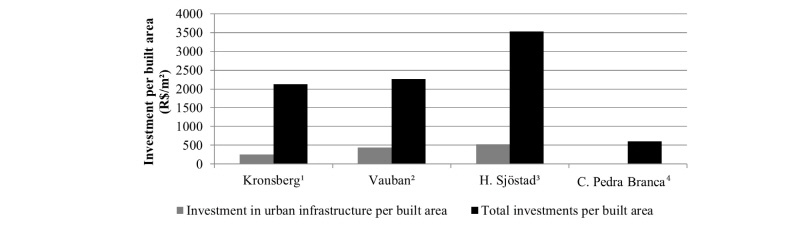
Besides, Hammarby Sjöstad has required the highest total investments; it is the largest area and its development depends on the coordination of many stakeholders, which increases the challenge to minimize costs. Kronsberg had the lowest costs, possibly due to the coordination by the government of the planning process, construction phase and building occupation. Vauban, finally, is placed in an intermediate position; it is smaller than Hammarby Sjöstad, but the urban development was coordinated by groups of owners, which also contributed to turn the management more complex than in Kronsberg.
|
Figure 5. Total investment costs with regard to the total built area. Source: 1Rumming (2004a), 2Moura (2010); Energy cities; Ademe (2008); 3Rode et al (2012); 4Pedra Branca (2014) |
Overall Case Study Analysis and Main Challenges to be Addressed
The comparative assessment of selected sustainability strategies applied to case studies allowed identifying the prominent aspects of each area, as well as the points in which there are still opportunities for improvement and challenges to overcome. The graph shown in Figure 4, displays the set of challenges for the studied areas. The smaller the area, higher is the performance, and fewer are the challenges the neighborhood has to face, to achieve urban sustainability conditions as considered in the present study. For each neighborhood and group of strategies, a weight was assigned, according to the following criteria: Standard strategies: 10 points; Strategies with higher performance, intermediate level: 6 points; Strategies with higher performance, superior level: 2 points.
As indicated in the chart, Vauban presented the best overall performance, although accessibility aspects have been facilitated not only by the urban masterplan strategies, but also by the neighbourhood location much closer to the city of Freiburg. There is, however, the challenge of developing higher performance environmental sanitation systems (water, sewage and waste), by improving local treatment and use. Kronsberg arises in a second position with high performance in terms of governance, environmental sanitation, as well as energy efficiency and supply strategies. However, this area faces the challenge of reducing car use, possibly incorporating mixed land use solutions, restricting individual transport (reduce or charge parking spaces), and encouraging public transport (systems optimization, attractive pricing).

In Hammarby Sjöstad, there is still a need to promote better levels of energy efficiency in buildings and in the use of renewable sources, which also would demand improvements in urban morphology. Governance aspects, especially social communication and community involvement into the decision-making processes, are also relevant, even to promote greater levels of commitment to improve consumption indicators. Finally, Cidade Pedra Branca outperformed the Brazilian standard pattern, with regard to governance, urban morphology and environmental sanitation strategies. However, there are still important challenges to be addressed in this neighborhood with regard to the accessibility and mobility, as well as energy efficiency in buildings and the use of renewable energy sources.
Conclusions
Analyzing the case studies, an interdependent relationship among several strategies could be identified, in physical, operational and institutional terms. The higher standards achieved in several cases depend on planning, implementation and operation of systems that, although its own functions, need to be compatible to other systems, to be able to use their resources or by-products.
Firstly, from a physical point of view, urban policies and projects (land use, construction, energy efficiency, environmental sanitation, mobility and accessibility, for instance) must be compatible. The distribution and assortment of urban areas, as well as matching demand and supply sides, represent challenges to be faced. It is also necessary to reserve space in both buildings and neighborhood scale, as appropriate, to implement local facilities, such as energy plants, water treatment and /or sewage plants, waste processing stations, among others. From an operational standpoint, the question of how to manage and provide the required urban services on a shared and integrated platform arises. How could water, waste, energy and transportation, i.e. be integrated, if the operation of a system depends on inputs produced by another system? This condition creates the demand for more efficient and integrated monitoring and planning systems. It is also necessary to provide back-up systems for services that cannot be interrupted. In shared facilities, it is necessary to ensure that the operation or maintenance of a facility will not cause injury to the others systems, as well as to define responsibilities and implement a supervision system, supported by proper contracts. Finally, from an institutional point of view, it is important to establish an integrated planning and management system that considers the subsystems involved - land use, transport, sanitation, energy, i.e. - not as isolated entities, but as interdependent elements of the same urban system. This approach allows increasing efficiencies and minimizing possible conflicts. The entity coordinator, i.e. the holder of land tenure to be developed, would be able to introduce the relevant requirements to achieve performance goals and systems integration. At the same time, this body should coordinate the various entities in the urban planning process, including enabling community participation. The most successful case studies, in this regard - Kronsberg and Vauban - constitute exceptions precisely because the land is owned by the municipality and the building owners. In Brazilian cities, a certain area to be developed is generally parceled into lots owned by several private entities. Thus, urban development coordination still constitutes a challenge to be properly addressed.
