

Introduction
Literature Review
Classification system of defects in apartment houses
Data processing of defect classification
Methodology
Overview
Squeeze-and-excitation block
CADCNN Framework for defect text classification
Experiments and Results
Dataset and data preprocessing
Model setting
Experimental results and analysis
Conclusions
Introduction
Systematic quality control is essential for enhancing the performance and extending the life of buildings. In particular, the occurrence of defects due to insufficient quality control is known to lead to rework, schedule delays, cost overruns, or disputes, resulting in economic and industrial damage [1, 2, 3, 4, 5]. The construction industry development board in Singapore estimates that the typical contractor spends 5% -10% of the total project cost on rectifying defects [6]. In construction projects for residential, industrial, and commercial projects, the reported cost of defects ranges from 2% to 6% of the total contract cost [7]. Recently, Mills et al. (2009) argued that the cost of rectifying defects in the housing construction industry was 4% of the contract price [8]. Defect costs, including indirect costs, can increase by a factor of 6 greater than the aforementioned costs [9]. Accordingly, numerous studies have been conducted on defect management to improve the quality of housing [10, 11, 12, 13].
In particular, as the number of apartment houses is increasing owing to urbanization in various countries, efforts to reduce defects in apartment houses have continued so that numerous residents can live in a safe and comfortable living environment [14, 15, 16, 17]. In general, the damage from defects in apartment buildings has a wide reach with many victims; consequently, resident protection is required [7]. In addition, the construction of an apartment building, which is larger in scale than ordinary buildings, consists of dozens of work types; therefore, when a defect occurs, the cause is often relatively complex. Therefore, related experts are needed to identify and analyze the defects. At this time, the importance of efficient defect management emerges because human resources are limited and the management scope is wide from the viewpoint of actual operation management [8, 10, 18, 19].
Preventing the occurrence of defects requires first, identifying and classifying the defects [20]. By conducting a defect investigation and systematically classifying defects, project managers can quickly respond to defects that occur by analyzing their flow and trend of defects. In addition, project managers will have a platform to establish strategies to quickly discover possible defects or to prevent the occurrence of the same defects. However, the traditional method used to examine and identify the condition of a building has relied on manual records by experts [20]. Results appeared to change frequently. In particular, in the case of apartment houses, the number of survey items was large, indicating that the efficiency was even lower than that of other projects [17, 20]. Based on this recognition, classification of defect cases in apartment houses has become an important concern among construction researchers and managers. In general, it is difficult to obtain data related to defects, and the information is not standardized even when it is accessible [21, 22]. A standardization process is required to analyze the data. Lee et al. (2016) and Lin et al. (2016) demanded that the defect data be standardized, structured, and stored, and a feedback process to manage defects using these data was established [23, 24]. In this way, an integrated approach that links defect data among heterogeneous data sources can reduce losses in the management process and improve current defect management practices. However, this is a level of computerizing defect data, and it remains at the level of automation of data management and analysis through simple computerization. In defect classification tasks that require a professional workforce, such activities still have limitations. Eventually, a new method of defect classification based on information technology is needed to improve the existing method. Automating the defect classification process reduces the amount of human resources needed and dramatically increases work processing efficiency. From this point of view, this study focuses on improving classification accuracy and work efficiency through a model that automatically classifies defect text data input from consumers by applying deep learning to the classification process of defect data.
In Natural Language Processing (NLP), deep learning is a method that overcome the limitations of traditional machine learning such as SVM, Decision Tree, K-Nearest Neighbors (KNN), Naïve Bayesian, and Logistic Regression (LR). Traditional machine learning was applied to classify text data in various studies in the field of architecture, but it does not show high accuracy [25, 26]. On the other hand, deep learning is a robust learner that improves performance by learning the semantic features of words, unlike traditional machine learning which learns the distribution between words based on statistics. In particular, CNN (Convolutional Neural Network) is a representative deep learning model that enables significant performance improvement in the text classification of NLP [27, 28, 29]. The advantage of CNN is that it learns the relationship information between words efficiently while preserving the location information of words. In addition, the advantage of parameter reduction through weight sharing of convolutional filters supported the superiority of CNN. Based on these advantages, defect text data was automatically classified using a CNN of a deep learning algorithm in multi-class text classification problem. Not just a simple CNN model, but a model optimized according to the characteristics of defect text data is designed. In addition, channel attention mechanism is combined with the model to extract informative features from defect text data. As a result, the proposed CNN model has superiority compared to other classification models based on the task average F1 score.
Literature Review
Classification system of defects in apartment houses
In general, a defect is ‘a condition in which a product does not have the quality or performance that it would normally have.’ Similarly, defects in apartment buildings are defined as defects that cause cracks, settlement, broken pipes, water leaks as the result of a construction error, leading to problems with safety and functionality or esthetics of buildings or facilities [30, 31]. To minimize the loss resulting from the occurrence of defects, it is important to understand the defect items accurately and comprehensively. Failure to do so may cause confusion, and improper countermeasures may compromise building preservation efforts effect. Numerous studies have been conducted to provide a more general definition of defects, and defect cases have been reclassified into various criteria to understand the characteristics of defect occurrence [11, 21, 32, 33]. Defects have been classified into 11 categories as summarized in Table 1. The table gives the classification of defects that form the basis of this study.
Table 1.
Defect classification
|
Defect classification | Description | Reference(s) |
| Affected functionality |
-Materials/Components that must be replaced because its functionality is completely affected -Materials/Components that must be repaired but not necessarily replaced because its functionality is partially affected | [32, 33, 34, 35] |
| Broken | -Materials/Components physically and forcibly separated into pieces or split, as well as deteriorated elements because of its use and also the physical interaction with the environment, among many others | [10, 18, 32, 33, 34, 35, 36, 37] |
| Corrosion |
-All defects caused by living beings as molds -Corrosion of metals or the carbonation of concrete | [32, 35] |
| Crack | -Cracks in construction elements | [10, 32, 33, 35, 36] |
| Detachment | -Materials/Components that are not fixed in their position | [10, 32, [33, 34, 35, 36, 37] |
| Incorrect installation | -Materials/Components well positioned or does not satisfy project specifications or does not have the characteristics it should have | [32, 33, 32, 35] |
| Missing task | -Works that are not completed/done, although in the project or in the specifications are supposed to be collocated or completed/done | [32, 33, 34] |
| Surface appearance |
-Protuberance on a level surface -Opposite effect to a bump -Surface not even or uniform as e.g., in shape or texture, an uneven color, uneven ground, uneven margins, wood with an uneven grain -The result of a collision or abrasion -Surface with a powdery deposit caused by the evaporation of water when there is a certain level of dissolved salts | [10, 32, 33, 34, 35, 36, 37] |
| Excess moisture | -Wetness caused by moisture, including rising damp, penetration damp, and condensation | [32, 33, 34] |
| Entrapped water | -Water that does not drain | [10, 32] |
| Water leak | -Defects related to water that seeps through walls, slabs, roofs, etc. | [32, 34, 36, 38] |
Data processing of defect classification
The starting point of the defect management process is the detection and classification of defects. The classification of defects is performed through data collection through investigation and human-driven inspection, which reduces productivity. In addition, the classification of the investigated defect items appears to be subjective according to the accuracy of the generated data, the structure of data management, and the professionalism of the manager [39]. Accordingly, research was conducted on standardizing and computerizing of defect data in an effort to mitigate problems such as variability of classification and decrease in efficiency. Kimoto et al. (2005) developed a mobile computing system using personal mobile information for construction site managers [40]. Wang (2008) proposed a platform for collecting, filtering, managing, monitoring and sharing defect data using radio-frequency identification technology [41]. In the same year, a model was proposed that can automatically classify defect data by collecting defect data in real time in the field using a personal portable terminal and a wireless Internet connection [42]. Through numerous studies related to the development of information systems for sharing and processing defect data, the foundation for securing business computerization technology and efficient construction management was laid. However, this is at the level of simple computerization of data management and analysis automation through data sharing and document digitization.
With the introduction of a new strategy based on recent data processing technology, researchers have attempted to provide a higher level of objectivity when sharing and processing the signs of the state of the building. Park et al. (2012) proposed a system framework for defect management by integrating ontology and augmented reality with building information modeling. Kwon et al. (2014) developed a defect management system that automatically detects and manages defects using building information modeling, image analysis and augmented reality [43]. Recently, a system for detecting and classifying defects in the image data of the exterior of a building was implemented using an object detection method based on deep learning [44]. Automating these various processing tasks will make it easier for managers to achieve greater objectivity and consistency. Research on and technology for the detection and classification of defects are valuable and have the potential to prevent defects, but construction companies or managers may have difficulty adopting them all owing to time and budget constraints. From this perspective, in this study, we propose a consumer-friendly model by developing a defect classification model based on deep learning data processing technology that is lightweight and optimized for effective defect management activities.
Methodology
Overview
We propose CNN-based model for the automatic classification of defect text data. In computer vision, CNN has been developed to in extract high-level features by increasing the convolutional layer depth to enhance performance [45, 46]. Our model also extracts high-level features through a spatial hierarchical structure by stacking convolutional layers. The low-level convolutional layers learn general patterns while extracting local features, and the high-level convolutional layers learn comprehensive patterns for the entire sentence.
However, because the defect text data are composed of short-length text, there is a limit to increasing the model depth owing to a lack of information. Therefore, we used channel attention mechanisms to extract possible informative features from less text information. Channel attention can play a decisive role in improving model performance when used in deep CNN of computer vision [47]. This is because channel attention adds meaningful information by reflecting the relative importance of each channel in the feature map of the convolutional layer. In our model, this channel attention reinforces the representation power of important features for model robustness.
As a result, our model applies channel attention mechanism while maintaining the maximum depth of the convolutional layer. Therefore, we call our model a channel attention-based deep convolutional neural network (CADCNN). Before explaining this model, we first describe the squeeze-and-excitation block used as the channel attention [48]. We next describe the entire model.
Squeeze-and-excitation block
We improve model performance by inserting a channel attention squeeze-and-excitation (SE) block between each convolutional block. The SE block is illustrated in Figure 1. In computer vision, the CNN has a great advantage in improving performance by improving the representation power of spatial information. In addition, the SE Block helps to extract more informative features by further improving the representation power between channels. This is possible by calculating the channel attention score and multiplying it with the existing feature map. The process of calculating the attention score in the SE block is as follows.
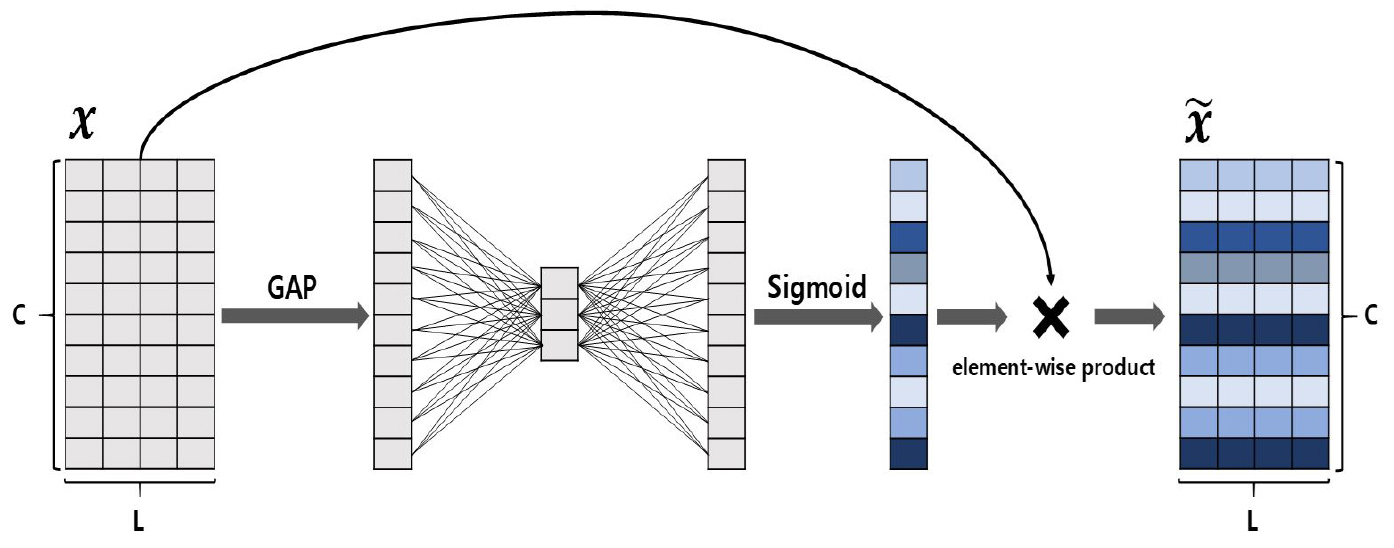
First, the global average pooling (GAP) operation summarizes the global spatial information corresponding to each channel in the feature map. In computer vision, because the feature map dimension of Conv2D is , it was calculated as . However, becuase Conv1D is used in text data, the feature map dimension is . Therefore, the formula for the GAP operation is adjusted as follows.
Then, scalar values obtained from the GAP are multiplied by a fully-connected with . It is then activated as a rectified linear unit (ReLU) function and then multiplied by fully-connected with . But at this time, and parameters has a bottleneck structure to reduce the complexity of the model by reducing dimensionality ( and ). So, the value is a new hyperparameter, and we experimentally confirmed that 8 is an ideal value. Finally, the channel values have an attention score between 0 and 1 by activating as a sigmoid function. Through this process, each channel value is readjusted to a channel-wise relative importance score. Then, this channel attention score is multiplied by the existing feature map . Therefore, the dimension of the feature map to which channel attention is applied is .
CADCNN Framework for defect text classification
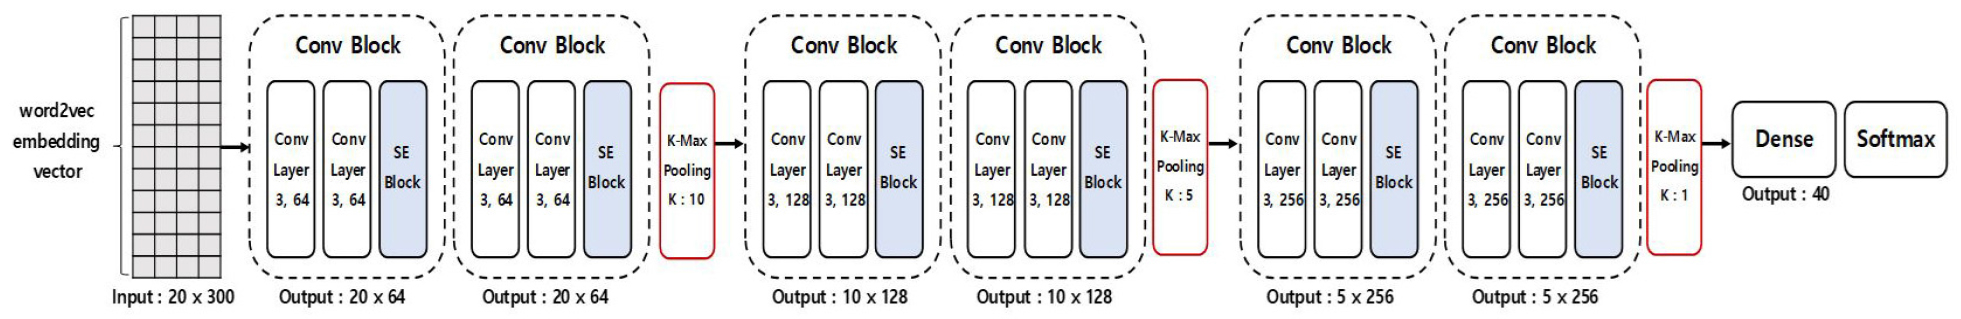
Figure 2 shows our CADCNN model. Its input consists of word-embedding vectors. The input dimension size is , where is the length of the sentence and is the dimension of the word -embedding vectors. The embedding vectors obtained by looking up the embedding matrix pretrained with word2vec [48, 49] are composed of . The dimension of our model’s input is a 300-dimensional embedding vector.
CADCNN is designed by deeply stacking convolutional blocks. The convolutional block is shown in Figure 3. Each convolutional block is a hierarchical structure consisting of two convolutional layers. All convolutional layers have a kernel size of three and padding is applied to keep the length. Batch normalization and parametric ReLU (PReLU) activation functions are applied to the convolutional layer to obtain a higher learning rate and improved accuracy [50, 51]. A shortcut connection was used for each convolutional block to prevent a vanishing gradient [43].
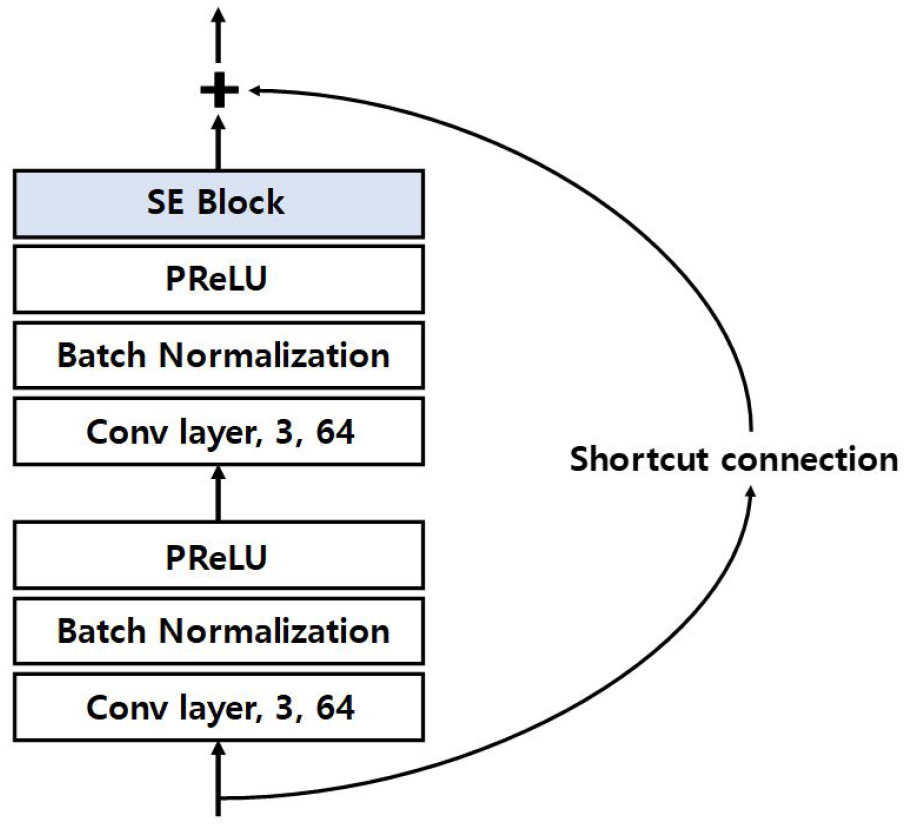
The SE block was inserted after each convolutional block. This channel attention, which reflects the relative importance of the channel works more effectively in our CADCNN model. Because the sentence length is very short and the number of channels is relatively large, it is effective to reflect additional information in the channel. In addition, features should will be well extracted for the role of each layer that extracts general pattens from low-level layer and abstract pattens from high-level layer.
In terms of the structure of the entire model in which SE blocks are inserted, the convolutional blocks consisting of two convolutional layers and one SE block are deeply stacked into six blocks. The numbers of channels in each convolution block were 64, 64, 128, 128, 256, and 256. At this time, if the number of channels is doubled, the length is downsampled to 1/2. To do this, we use k-max pooling to obtain only the most important feature values. It has k maximum values regardless of location in length but preserves the relative order information. Employing this structure allows us to design our model deeply while reducing the number of model parameters. In addition, high-level features can be extracted by maintaining the representative capacity of each convolutional layer.
Finally, the features extracted from the deep CNN are left only as the most important features per channel through 1-max pooling. Subsequently, it connected to a dense layer and we get the classification probability for task through softmax activation. The dense layer parameter for each task is set to 40, and the output layer parameter is set according to the classes of each task.
Experiments and Results
Dataset and data preprocessing
Defects in apartment buildings are caused by the overall overlapping of unexpected design mistakes, material defects, construction errors, environmental factors. Conflicts and disputes may arise from differences in the interpretation and perception by contractors responsible for construction and residents of defects that arise after the handover. To minimize social losses resulting from such disputes, the defect liability period is institutionalized in various countries. For defects in an apartment complex where a dispute occurs, the court determines whether the contractor was obliged to repair them based on legal standards. The data used in this study are text data representing the determined defect items in the aforementioned apartment building defect lawsuit.
Table 2 lists some examples of datasets. The building’s components have their own function. Each component, such as work type, location, and element, has a different material, main work type, and component installation level [38]. In other words, different types of defects may exhibit different characteristics depending on the work type, location, and element. Therefore, the defect factors should be analyzed as follows: The dataset consists of four tasks, all of which are classification tasks. The dataset was constructed based on 9 work types, 7 defect locations, 11 defect types, and 8 elements.
Table 2.
Examples of datasets
Table 3 lists the number of data samples for each task. There were a total of 16,106 sample, and we divided the sample into a 7:1:2 ratio for each of the training, validation, and test datasets for the experiment. However, the number of data points per class for each task was unbalanced. Therefore, we consider f1 score [52] to harmonize the average of precision and recall as important evaluation metric for our experiment.
Table 3.
Distribution of the datasets used in the experiment
We preprocessed the defect text to set the input of the model. Because most of the defect text were short, all text information was used as input to prevent the lack of information as much as possible. Therefore, preprocessing to remove special characters, English, number was not performed. However, preprocessing of converting English letters to lowercase letters must be performed for standardization. Tokenization for segmentation of sentences was carried out using a morpheme analyzer Mecab [53]. Along with this, the total size of the word dictionary consisting of unique tokens is 2694, and the fixed text length is 20.
Model setting
We trained our model using pre-trained embedding vectors. For this, the word embedding matrix trained with the word2vec [45, 46] model was used. We downloaded the Wikipedia Korean dump file and trained it directly. The learned word-embedding matrix consisted of 300-dimension embedding vectors per word.
The model’s hyperparameters were adjusted using a validation dataset. Finally, we used Adam optimizer [54] with an initial learning rate of 0.01, learning rate schedules with a decay factor of 0.1, two epochs patience based on the validation loss fluctuation. The weights of the convolutional layer and the dense layer were learned by setting the He normal initialization [51] and L2 regularization to 0.0001. In addition, the model was trained with 20 epochs and a mini-batch size of 32. For the experimental implementation, we used Tensorflow 2.3, on a single RTX 2080 Ti graphics processing unit.
Experimental results and analysis
In this section, we evaluate the influence of the main components of the model, namely channel attention. Our main contribution is a thorough evaluation of CNN model with increased depth using channel attention. This was confirmed to achieve significant improvement compared to other representative models in the text classification of our dataset.
Table 4 lists the results based on the presence of channel attention (SE block). We compared the model excluding the SE block to determine how the SE block affects our CADCNN model. The result showed that our model has a 0.16% higher average accuracy than the model excluding SE block. The average f1 score of tasks was 0.74% higher than that of model excluding the SE block. In addition, our model exhibits overall high performance in each task metric. In particular, in the case of element task, the average f1 score is overwhelmingly higher than that of the model excluding the SE block. These results demonstrate that the informative features extracted by applying channel attention have significant influence on all tasks without missing a single task.
Table 4.
Model comparison according to the presence of channel attention
Table 5 lists the results of comparing CADCNN model with the other models. Through this, we confirmed the advantages of the proposed model. The comparative models are Kim’s CNN [27], a representative feature-based CNN model, and BERT [55] and GPT2 [56], the most representative fine-tuning models. These models were redesigned into models suitable for each task by additionally using a dense layer for each task. As a result, fine-tuning models are learned with a redesigned structure during fine-tuning.
Table 5.
Model performance comparison between the representative and proposed model
First, we compared our model with Kim’s CNN. The average F1 score of tasks in the CADCNN model is 1.35% higher than that of Kim’s CNN using the word2vec embedding matrix. This shows that CADCNN model is a feature-based model like Kim’s CNN, but is much better. We also compared our model with the recent fine-tuning models. This comparison demonstrated that CADCNN model offers far better cost-effectiveness despite its similar performance. CADCNN model has significantly fewer parameters and involves far fewer model computations than all the fine-tuning models. The results are listed in Table 6. This is a comparison of models corresponding to the work type task. Compared to the multilingual pretrained BERT, the CADCNN model uses approximately 94 times fewer parameters and 366 times fewer model computations. Apart from this, CADCNN model’s performance is similar compared to that of the KoBERT and KoGPT2 models pretrained in Korean, but with much fewer parameters and model computations. Therefore, we contend that this model will work more effectively in embedded systems such as mobile; if our model performance improves over fine-tuning models in the future, its superiority will be doubled.
Conclusions
In this study, we propose a model called CACCNN-MT to automatically classify in defect text data. This CNN-based model was designed to extract informative features from defect text by applying a channel attention mechanism, not simply a CNN. Because of this, there are two strengths of this model. First, the average f1 score of all tasks is 89.60%, which shows the superiority of automatic classification. The high-performance automatic defect classification system shows the possibility of saving time and money compared to the traditional method that has relied on manual work. Second, the CADCNN model can be used in embedded systems such as portable terminals because it requires less model computation compared to the existing representative NLP models. We believe this will contribute to the development of an optimized and lightweight defect management system for the efficient defect management activities of managers. Based on these good results, future study can be developed in the direction of further improving model performance by learning all tasks together.
