

Introduction
Topology
Geographical description
Climate
Site details
Methodology
Experimental procedure
CFD Simulation
Results
Discussions
Variation in the air temperature observed from field experiments and CFD simulations
Variation in the corridor temperature observed from field experiments and CFD simulations
Conclusions
Introduction
Recently, the infrastructure management industry has been shifting its focus towards constructing energy-efficient buildings [1, 2]. Energy-efficient buildings are meticulously planned settings that offer ccupants the highest level of thermal comfort while minimizing energy usage. Number of countries have made it mandatory for builders to obtain energy performance certification (EPC), with the goal of promoting energy-efficient building practices in their respective regions [3, 4, 5, 6, 7]. Although government policies are in place, energy consumption in buildings continues to be on the rising side [8, 9, 10, 11, 12]. If one takes a closer look at the literature, majority of authors highlight following reasons for higher energy consumption in buildings; (i) wrong choice of construction materials and (ii) poor construction design [13, 14, 15]. It is clear from their work that, even after changing the design and construction materials, there is no significant improvement in the thermal comfort index values [13, 16, 17]. Hence, something must be fundamentally wrong with our assumptions while doing the experiments/simulations. One such parameter that we feel is important, but found missing in the literature is; how the building would perform, when its orientation changes with respect to its true north axis? Looking at the literature, only a handful of authors have considered, building orientation as a parameter, in their experiments for assessing the micro-climatic conditions [18]. This information is critical during the design stage, as it is going to decide the degree of daylight progress, wind flow, relative humidity, [19, 20, 21] shadow area, etc., inside the built space.
The role of the sun path diagram on the microclimatic conditions inside a building needs to be understood constructively. Only then the building can respond to climate change effectively. This ideology will not only help developers, but can also help the contractors who are into retrofitting business. For example, the authors Yuling and Xiaohua have developed a computational model to improve the thermal performance of a retrofitted building by including the orientation aspects [22, 23, 24, 25, 26]. And in this study, the authors have mentioned that the building orientation plays a vital role in deciphering the air temperature dynamics inside the living rooms [26]. Which eventually will have a say on the micro-climatic conditions in the living space, viz., occupants’ health insight, work outputs, environmental responsibility, etc. Recent studies also report that experimental models accompanied with machine learning techniques can be helpful to design buildings for a better tomorrow [22, 25, 27, 28, 29].
In this study, we have attempted to understand the importance of orientation on the shadow area evolution, the room/corridor temperature dynamics, and the daylight progress inside an academic complex. The degree of shadow area variation and its impact on the courtyard temperature evolution is also discussed. Extensive building simulations using IES-ve is done to validate the differential heating phenomenon inside the classrooms. We have also explored the role of building orientation on the air temperature progress inside the classrooms via window openings, using Autodesk Revit.
Topology
Geographical description
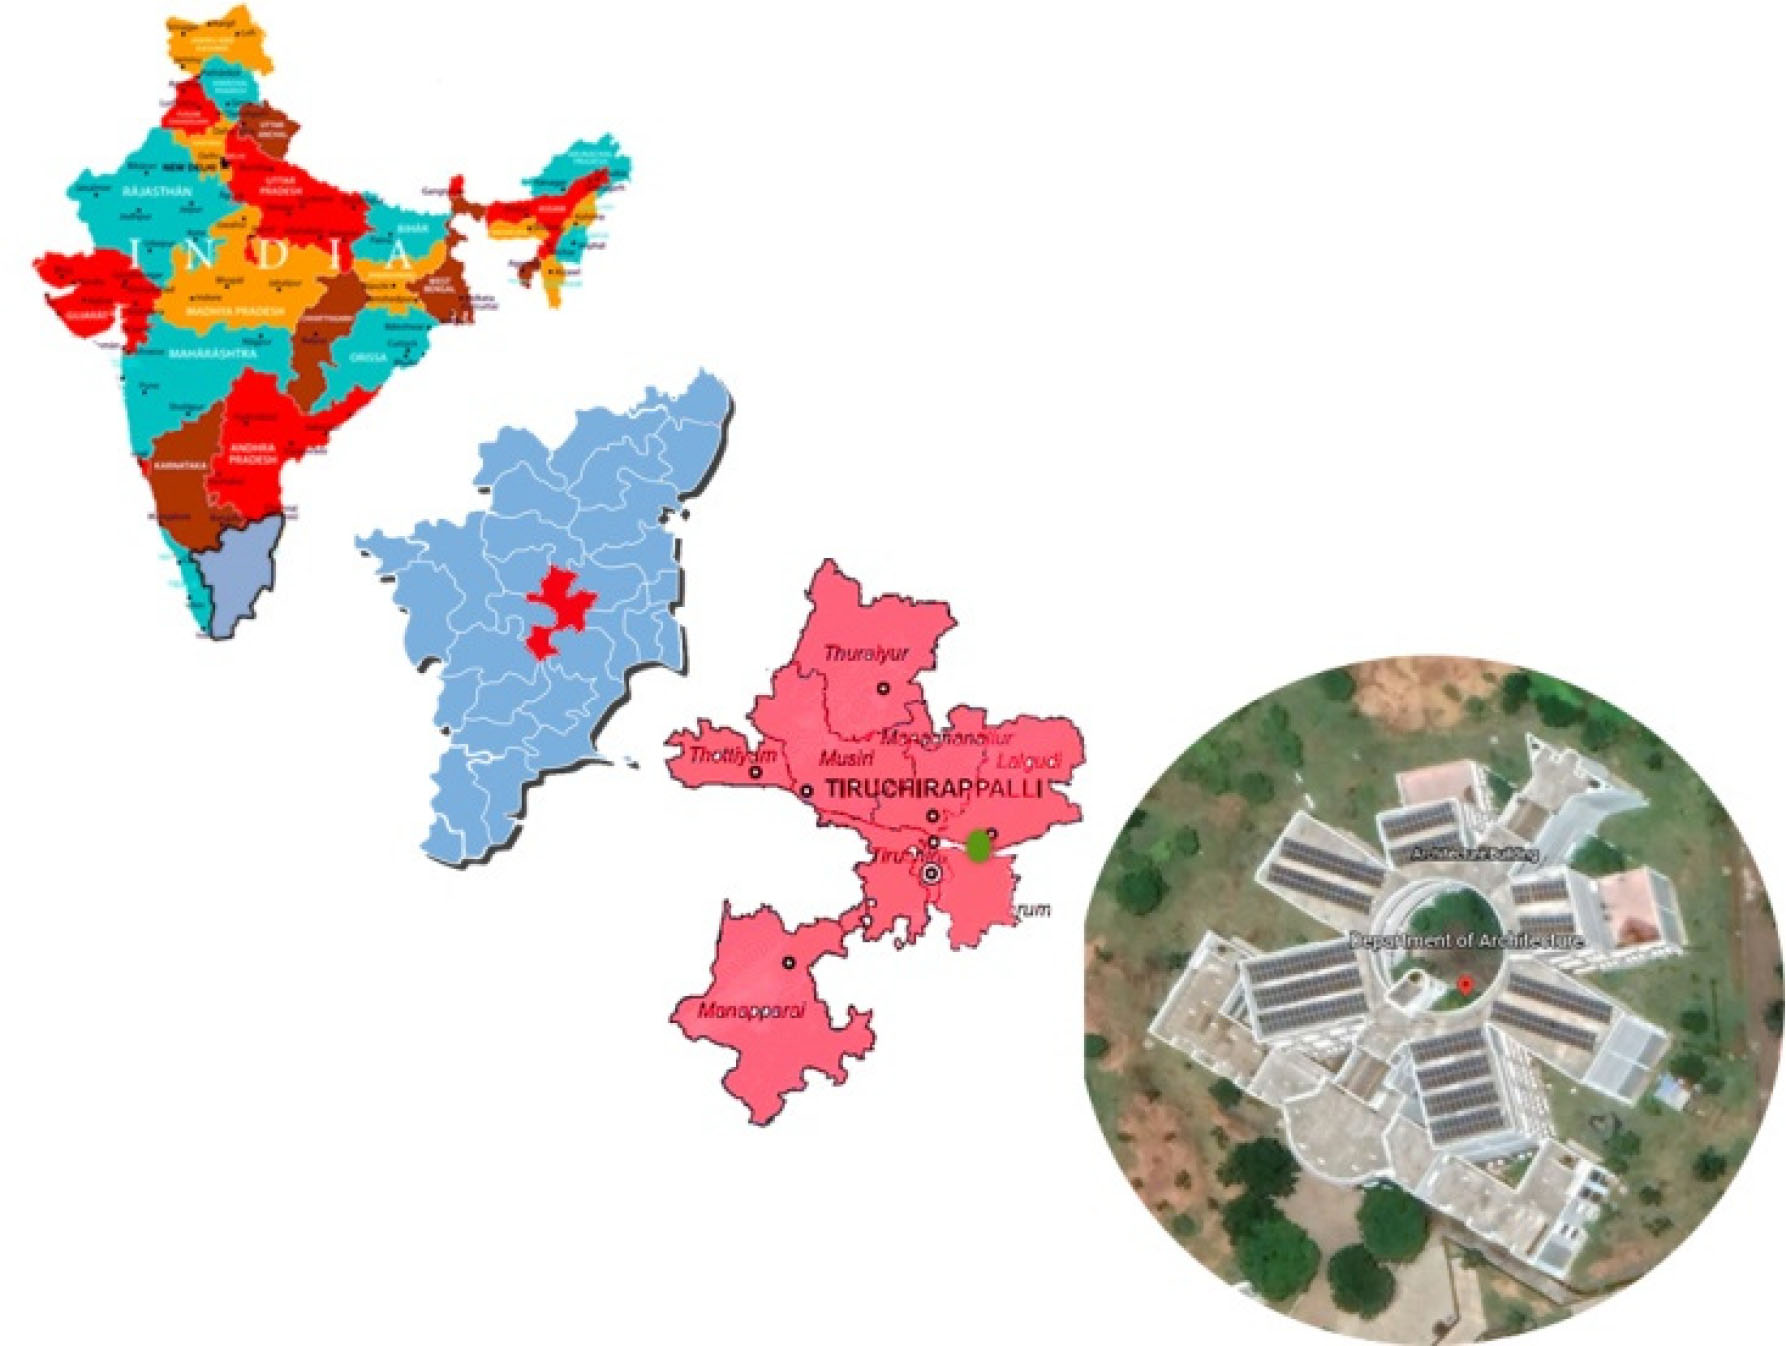
Tiruchirappalli is located in the southern part of India, under Tamil Nadu province. It is geographically located at 10.8050°N and 78.6856°E. Tiruchirappalli is also the geographic epicenter of Tamil Nadu. The topographical condition of Tiruchirappalli is flat with few hillocks like Golden Rock, Rockfort, etc., made up of cretaceous rocks of the Trichinopoly group. The city can be broadly divided into the cantonment area in the south, temples in the north, the bazaar in the city center, and the industrial/educational hub along the east. This study focus is limited to the eastern part of Tiruchirappalli, as the site is located on the Tiruchirappalli-Thanjavur highway (NH-83). It is on this highway, National Institute of Technology Tiruchirappalli (NITT) is located. The institute is spans over eight hundred acres and offers a perfect ecosystem for professional education. The location of the study area from a global perspective is shown in Figure 1.
Climate
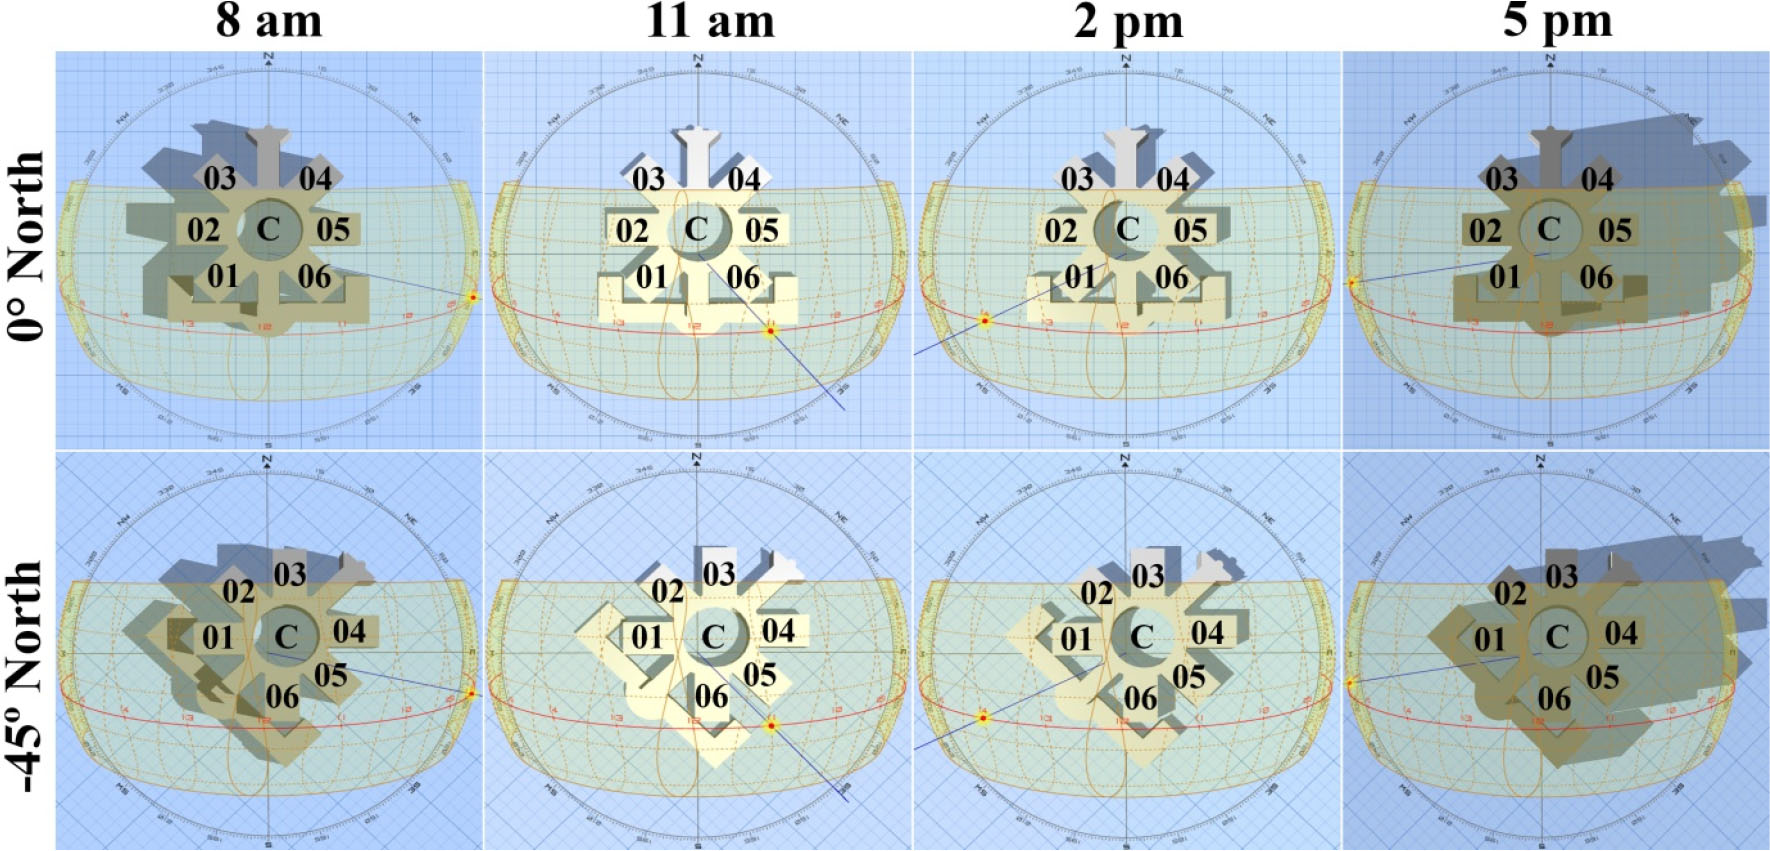
According to Köppen-Gieger, Tiruchirappalli experiences a warm-humid climate and comes under ”Aw” type of climate classification. During rainy season it is oppressive and overcast, while the summer is muggy and partly cloudy. The city is hot throughout the year, while the peak summer is experienced from March to June. The average temperature of Tiruchirappalli is 28.6°C, while the average rainfall is about 82 cm. Tiruchirappalli experiences rainfall from the southwest monsoon (June - September) and the northeast monsoon (October - November). Among the two, the northeast monsoon is more prominent than that of the southwest monsoon. As Tiruchirappalli is in the northern hemisphere, the hottest month of the year is May, during which the sun travels east to west via north. Air temperature (A.T), relative humidity (R.H) and wind velocity (W.V), values fluctuate as follows; 20 to 42°C, 32 to 94%, and 1 to 12 m/sec respectively. Field experiments were done on 5thMarch, during the driest month of the year. The sun path diagram for the true North and -45° North oriented building is presented in Figure 2. The numbers “01 to 06” in Figure 2 indicate the room numbers in sequential order, while the letter “C” represents the courtyard space of a true North and -45°North oriented building. From this diagram, the shadow area swept by the courtyard in the true North and -45°North oriented building was calculated as a function of time, 8 am to 5 pm. The sun path diagram conforming to 5 March 2019 (8 am to 5 pm) was downloaded from www.andrewmarsh.com. Offline, we used AutoCAD 2018 software to calculate the shadow area information. And using this information, the shadow area variation rate (as a function of time) in the true North and the -45°North oriented building was calculated.
Site details
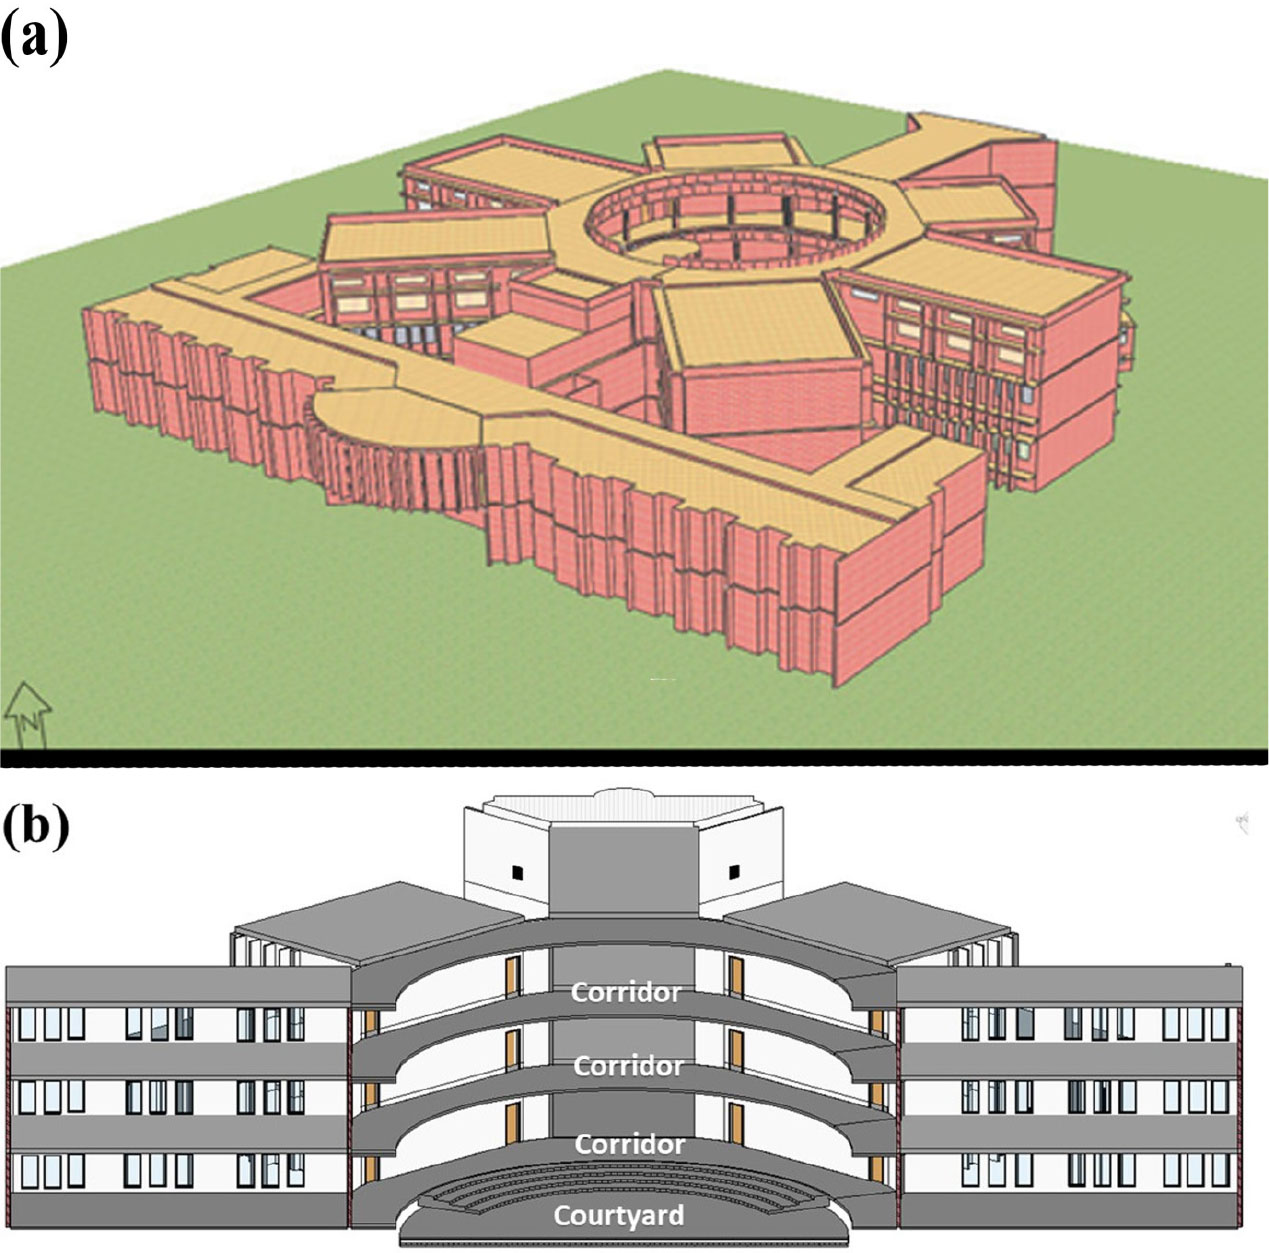
A 3D view of DoA with its sectional view is presented in Figure 3. The building has been intentionally oriented to -45°North, so that it is parallel to NH-83. The external wall of the building is 0.3 m thick (brick wall), with horizontal and vertical slits of 0.15 m thick (concrete masonry units). The department encompasses classrooms in three levels viz., ground, first, and second floor levels, with a circular courtyard of 12 m in radius. The courtyard is flanked by a 3 m wide corridor, which paves the way for the rectangular classrooms of 12 m x 18 m. The total height of the classroom is 4.95 m with window openings on the northern and southern side. Each window encompasses a translucent glass of 0.25 solar heat gain capacity (SHGC). Both, the southern and northern side has a clerestory window opening of 1.2 m high. Below the clerestory windows are the normal casement windows of 1.2 m and 0.6 m high which corresponding to the northern and southern side of the classrooms. To approve northern light inside the classrooms, the windows placed on the northern side are comparatively larger than the southern side. All the windows are flanked with vertical slits in the ground and first floor levels.
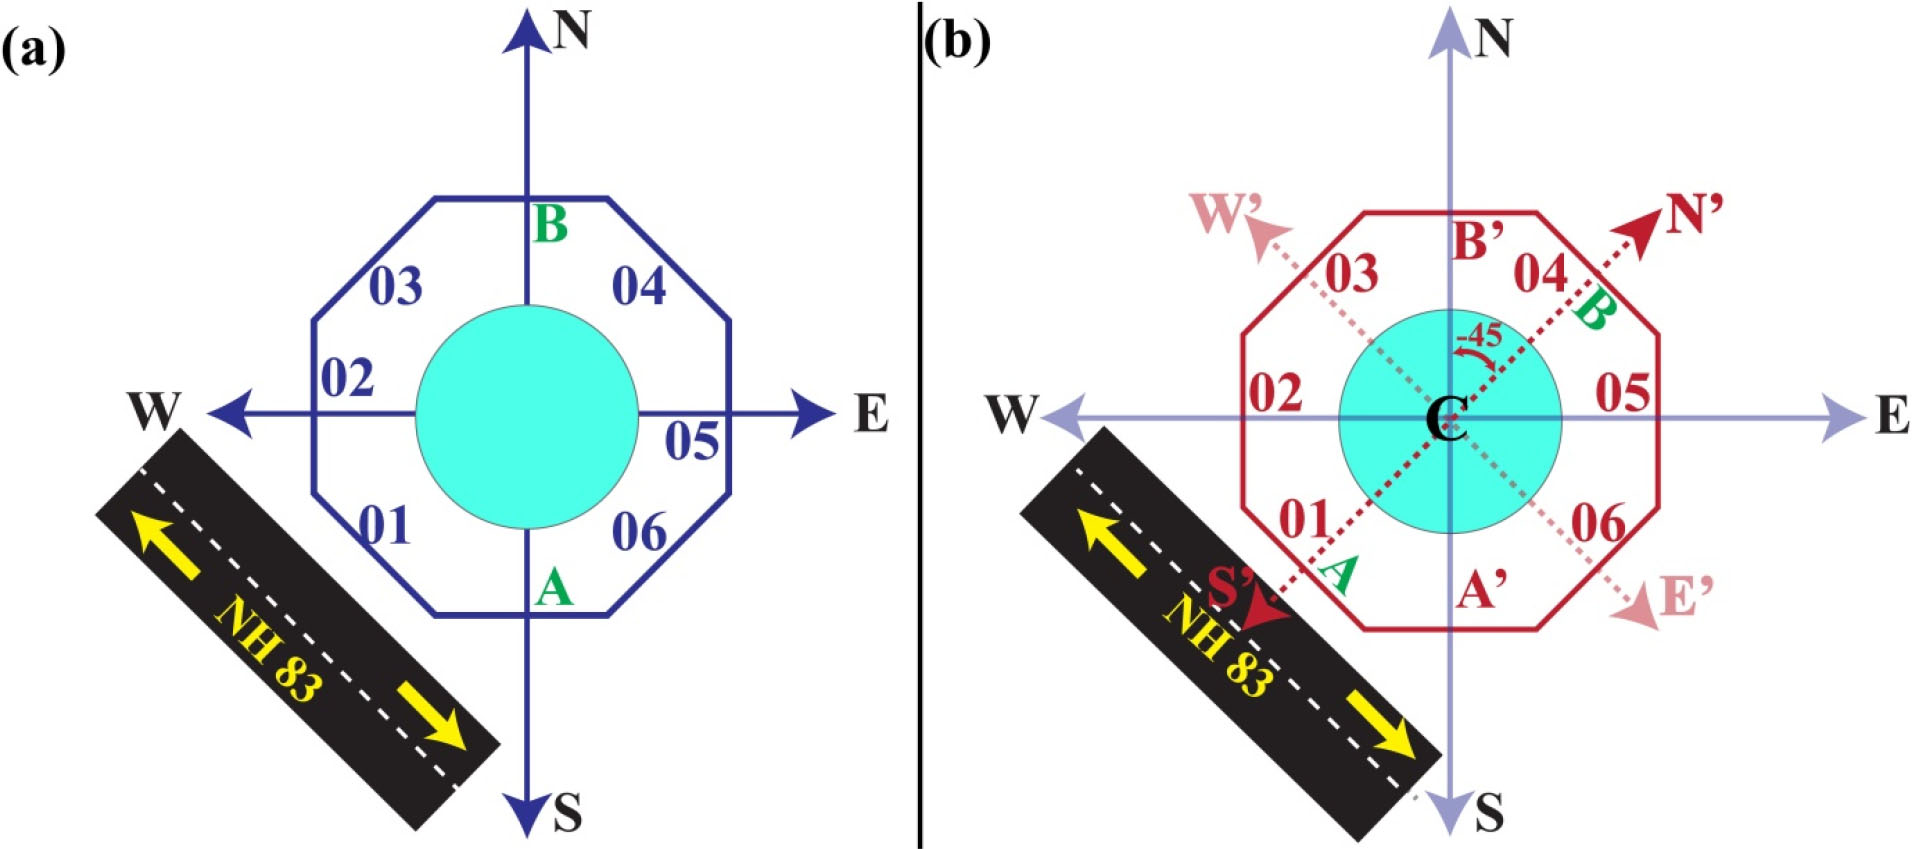
To understand the effect of building orientation on the air temperature dynamics inside the classrooms, it is wise to have a fair picture of the building itself in the true North and -45°North orientations. Figure 4(a) and (b) show the 2D illustration of true North and -45°North oriented buildings, respectively. The letter “C” displayed in the center of Figures 4 (a) and (b) indicates a circular courtyard, while its perimeter is highlighted in blue and maroon color. The classrooms associated with the courtyard are arranged chronologically (from “01” to “06”) from the entrance (A or A’), while their entry and exit are indicated using A and B & A’ and B’ respectively. Figure 4(a) indicates an imaginary/ideal design space using which DoA, NITT should have been built so that the building axis (A-B) is parallel to North-South axis. Since the building is not going to be parallel to the NH-83 if we orient it that way (as shown in Figure 4(a)), it was decided to orient the building axis by -45°w.r.t the North (A’-B’) as shown in Figure 4(b). As it is evident from Figure 4(b), upon orienting the building axis from A-B to A’-B’; the DoA, NITT has been made parallel to NH-83. To provide a better understanding between the true North and -45°North oriented building, maroon and blue colors have been used to distinguish the perimeters of true North and -45°North buildings. Here the N’, E’, S’, W’ are the axes of -45°North oriented building (maroon color axes) while N, E, S, W are the axes of an ideal/imaginary (true North) building.
Methodology
Experimental procedure
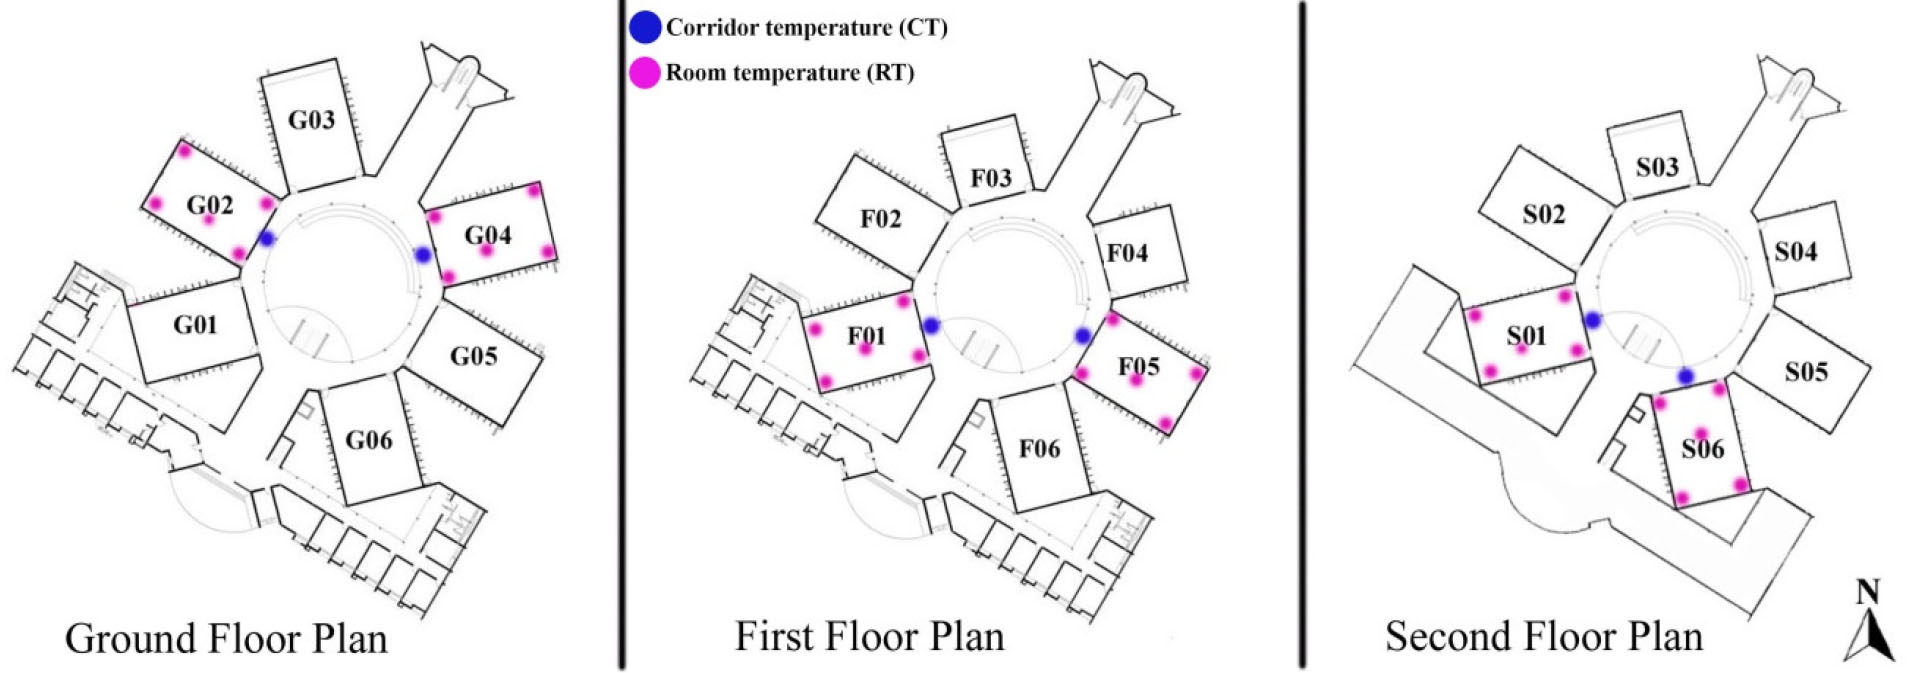
Experimental work can be broadly classified into two aspects, (i) field experiments and (ii) the building simulations using IES-ve. In the first part, two classrooms (one from the east and another from the west side of the building) were selected randomly from each floor. Subsequently, air temperature (AT) in the corridor and classrooms were measured using a Heat stress index system supplied by M/s. Extech, USA. Experiments were done on March 5th 2020 from 8 am to 6 pm, and the data was recorded for every 3 hrs. The measurements were taken on the corridor and inside the classrooms by closing the clerestory windows and opening the casement windows. Five readings were taken inside the classrooms 1.2 m from the base level, which is highlighted in blue (on the corridor) and pink color (inside the classrooms), as shown in Figure 5.
CFD Simulation
The experimental work was validated using computational fluid dynamics simulation with the help of IESve software. A 3D model of DoA was developed using “ModelIT” module in IESve. Subsequently “Apache” module was used to run the air temperature-related simulations for the entire building. Based on the ”Apache” simulation, the boundary condition was fixed for CFD simulations using “VistaPro” module in IESve. Matrix spacing and merge tolerance used to perform CFD simulations were 1e−4 m and 1e−5 m. While the number of superficial repetitions were fixed to 500. Finally, using the ”MicroFlo” module, the air temperature distribution in the corridor/classrooms were estimated using IESve. CFD simulations were done based on ASHRAE 55 standard. The input variables used to validate the air temperature distribution in the corridor and classrooms are discussed in Table 1.
Table 1.
The climatic variables considered in IES-ve for calculating air temperature distribution in corridor and room spaces [30]
Further, Autodesk Revit 2023 was used to build a 3D model of DOA NITT and subsequently solar analysis was performed using Revit Insight 2023 plugin. Motive behind solar analysis is to understand how the solar heat gain varies in different levels as a function of building orientation. Autodesk Revit Insight uses Perez solar model to comprehend our problem in a graphical sense. The floors in different levels were selected and the following sun settings were used as shown in Table 2.
Table 2.
Parameters used for solar analysis in Revit Insight 2023
Results
To understand the impact of building orientation on the air temperature dynamics in the corridor(s) and classroom(s), CT and RT measurements were made over time, as illustrated in Figure 6. The red and green color lines in Figure 6 represent RT and CT, respectively. Irrespective of the floor levels, RT mimics CT over time, but their magnitudes vary considerably. To comprehend the impact of floor levels on the magnitudes of CT and RT, the rate at which room and corridor temperatures vary (between 8 am and 2 pm) is computed from Figure 6 and is presented in Table 3. It is clear from Table 3 that the corridor gets heated up faster than their respective classrooms. Although this is an expected outcome, harmonious heating of the courtyard and corridor could make a huge difference in perturbing the air temperature dynamics inside the classrooms, as such. For example, the rate at which CT/RT increases in G4 is higher (eastern side) than that of G2 (western side). Similar analogy holds true for the classrooms positioned in the first and second floor levels (Figure 6 and Table 3). The rate at which CT/RT increases is higher in the eastern side, than its western counterpart. Based on the climate theory, the trend should be opposite to what we have got in Table 3. Which is, the corridors/classrooms located on the western side must have heated up faster than the corridors/classrooms in the eastern counterpart? Since the DoA building axis is oriented -45°North with respect to its true north axis (Figure 4 and Figure 5), eastern block is preferentially exposed to sunlight most part of the day. Thus, the intentional tilting of the DoA building must be the reason behind the preferential heating of the eastern block when compared to its western block. Ascribed hypothesis can be further understood and validated using the sun path diagram.
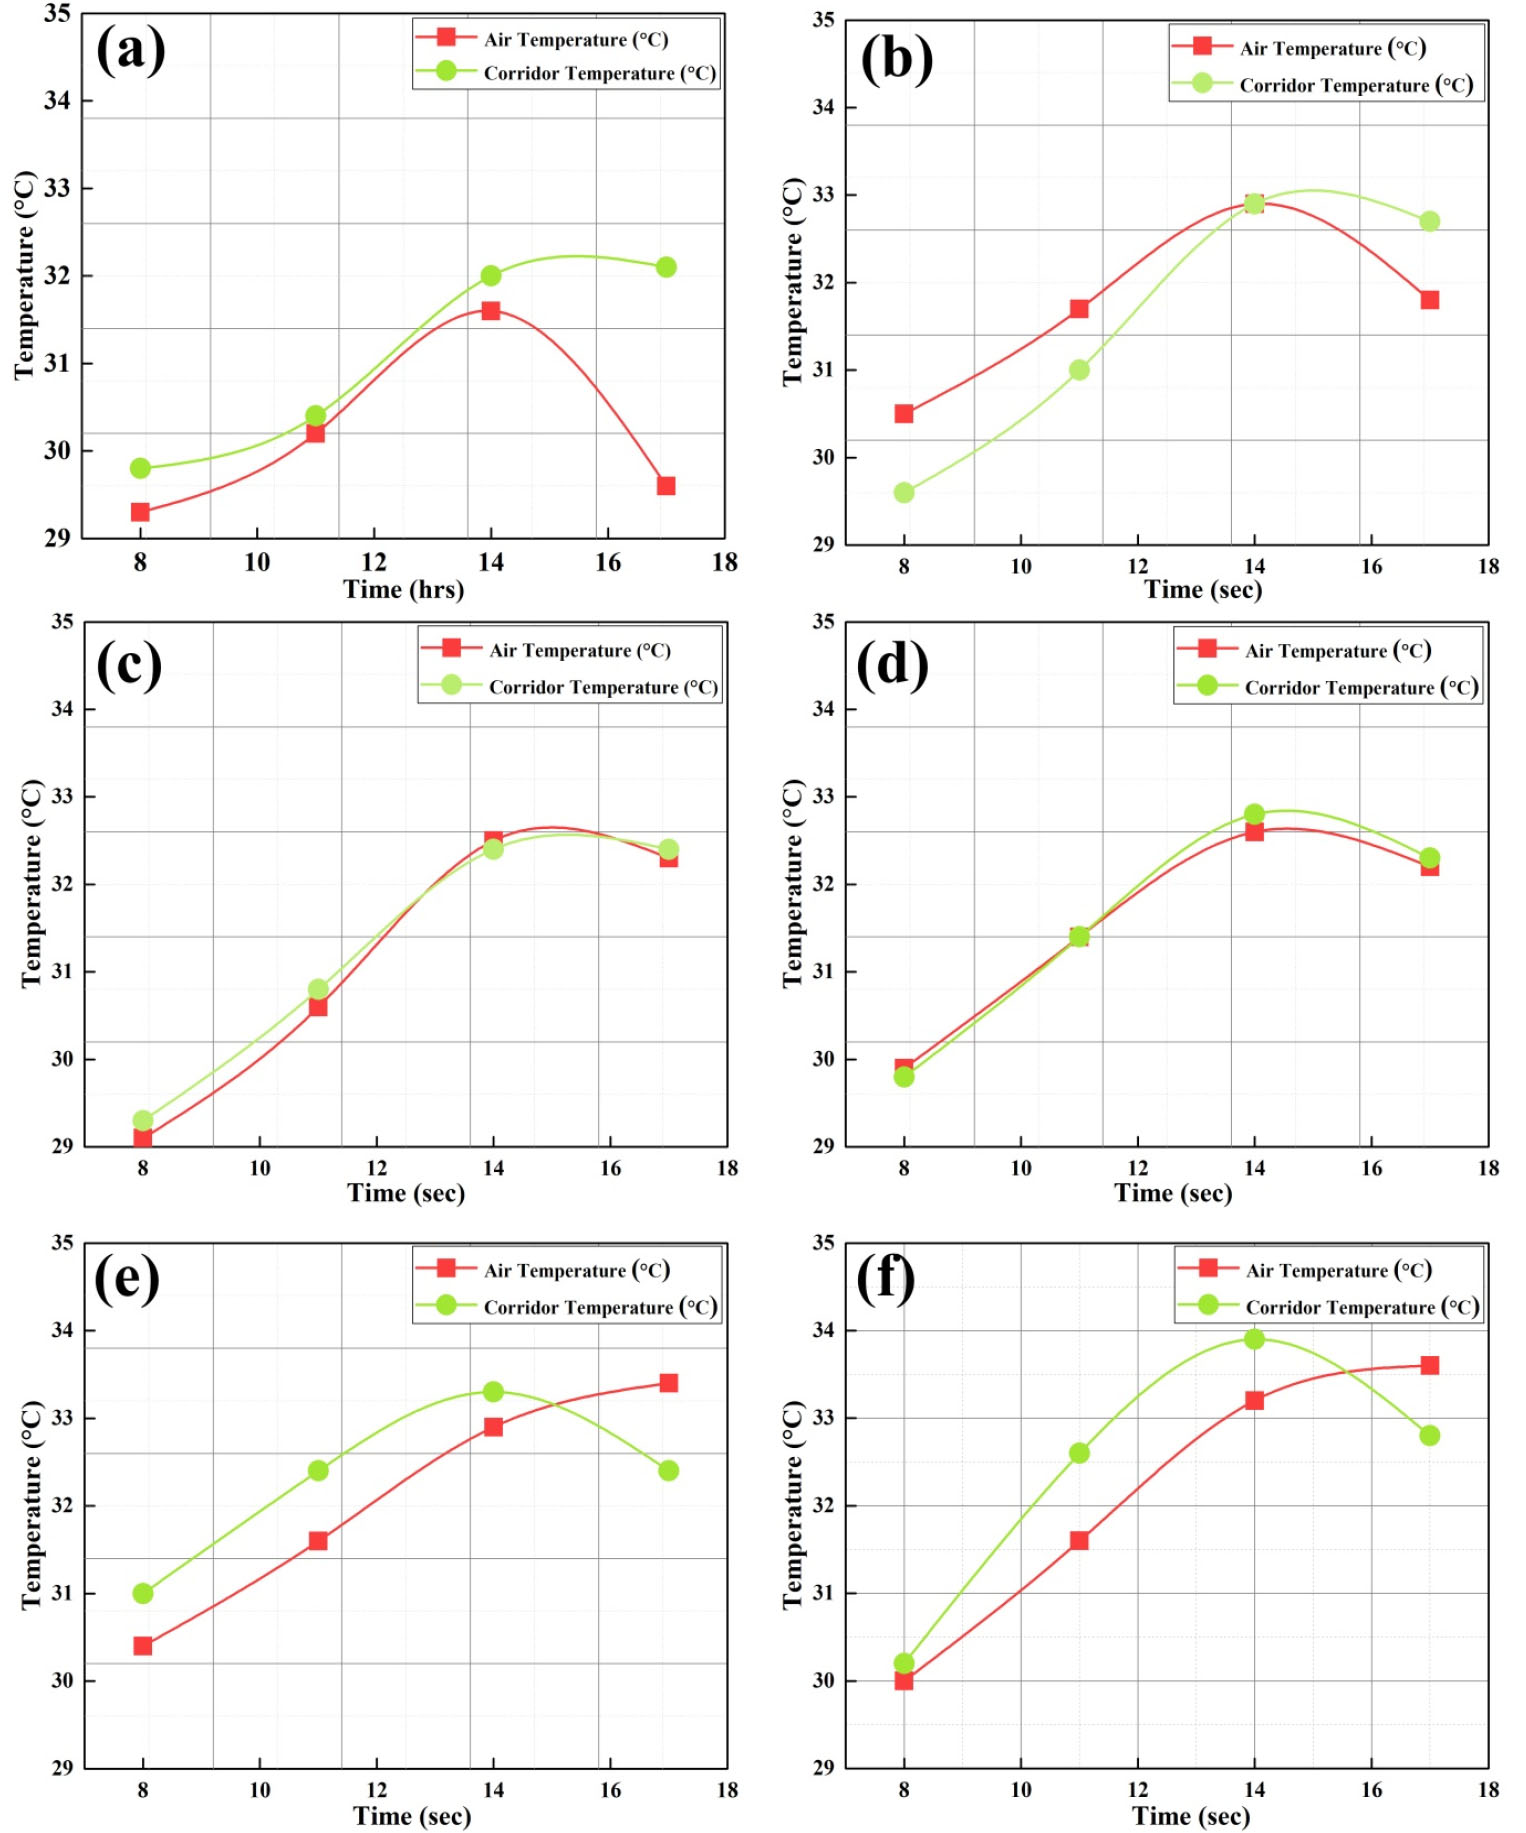
Table 3.
The rate at which AT inside the room and corridor varies with time and floor levels
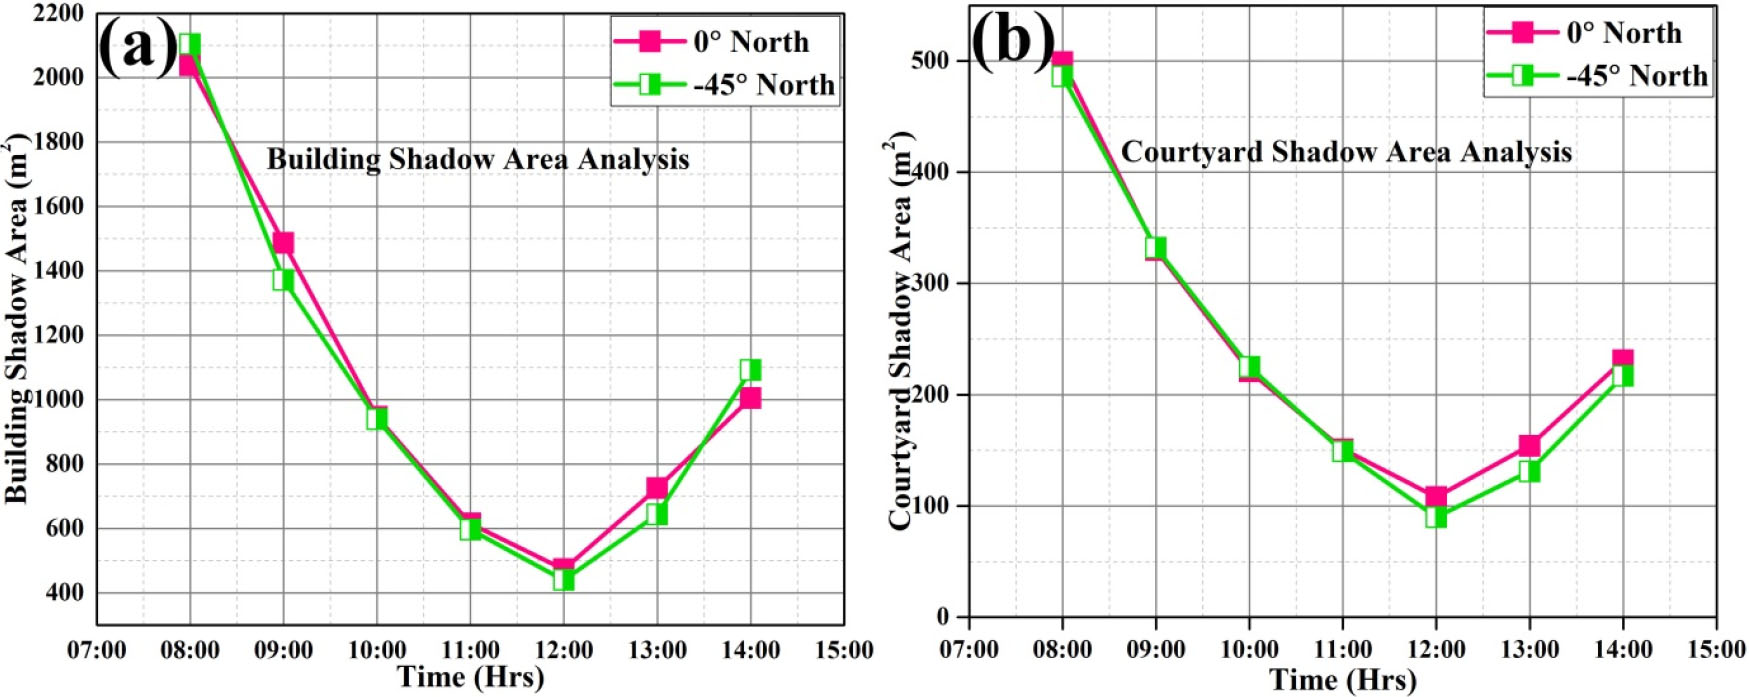
If we revisit Figure 2, there is no significant difference in the shadow area swept by the true North and -45°North oriented building. Moreover, it is evident from Figure 2 that the -45°North oriented building exposes itself favorably to the sunlight, than its true North counterpart. For example, the luminescence corresponding to 8 am, 11 am, and 2 pm is apparently higher in the -45°North oriented building. This indicates that for a given set of experimental conditions, the -45°North oriented building heats up faster than its true North counterpart. To address this anomaly, the rate at which shadow area (of both courtyard and building) decreases in the true North and -45°North oriented building is calculated from Figure 2. To our surprise, their magnitudes differ considerably as shown in Table 4. In case of the true North building, the shadow area (building/courtyard) decreases at a faster rate than its -45°North oriented counterpart. In other words, the -45°North oriented building is exposed to direct sunlight for extended periods of time, and this could probably be the reason behind the higher luminescence in the -45°North oriented building. Thus, the collective heating of the building surface, the courtyard, and the area surrounding the department could have increased the AT dynamics in the -45°oriented building. To validate this hypothesis, CFD simulations were done on the corridors and inside the classrooms, using IES-ve software.
Table 4.
Rate at which building and courtyard shadow area varies from 8 am to 5 pm in the true North and -45° North oriented building
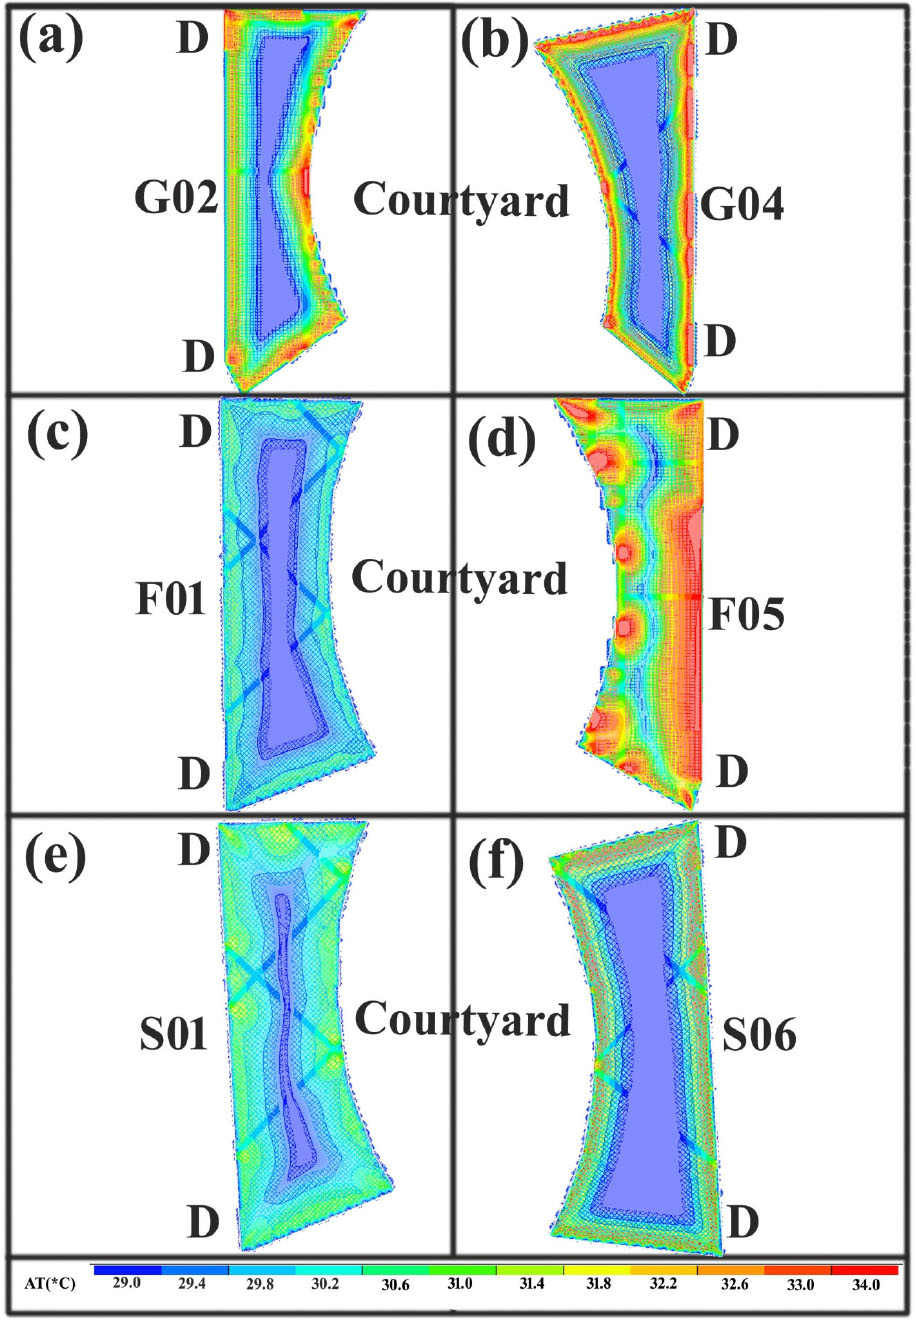
As the courtyard is coupled with the corridor and in turn with the classrooms, the exposure of the courtyard to sunlight can eventually perturb the air temperature dynamics inside the classrooms (refer to our earlier discussions from Figure 2, Figure 4, Figure 7, and Table 4). Since the DoA building is oriented -45° to the true North, preferential heating of the classrooms is apparently higher. The images corresponding to the row 1, 2, and 3 in Figure 8 indicates CT distribution contours in the ground, first, and the second level at 2.30 pm. The blue-colored regions in Figure 8 indicate cooler regions, while the red-colored regions represent hotter regions. Column one and two in Figure 8 helps one to compare/understand how the CT distribution varies in the western and eastern sides of the building. It is evident from Figure 8 that the CT distribution is higher on the eastern side than its western counterpart. In case of the corridors located on the ground level, CT distribution is higher in G4, as shown in Figure 8(b). It should be noted that the CT is higher on the G4 corridor periphery and not in the middle. The probable reason behind the same would be the sun’s position at 2.30 pm with respect to the G4 corridor space. According to the sun path diagram in Figure 2, only a fraction of sunlight can be expected to interact with G4 corridor space, whereas most of the sunlight is interacting on F5 and S6. That is why the CT distribution contour of F5 is more reddish in color than G4 and S6. Moreover, the sun makes an obtuse angle (@ 2.30 pm) with G4 corridor space, which eventually increases the shadow area. When it comes to the CT distribution on the second level, one may expect a strong red-color contour for S6 than F5, but the CT trend is lower than G4. The probable reason behind the relatively cooler corridor temperature in S6 is its placement with respect to the true north. The sun path diagram corresponding to 2 pm in Figure 2 indicates that the S6 corridor space is completely concealed from the direct sunlight, during most of part of the day. Finally, the IES-ve corridor simulations have helped us to visually understand the differential heating phenomenon (eastern side hotter than the western side) in the -45°North oriented building and how this orientation could perturb the AT in the classrooms.
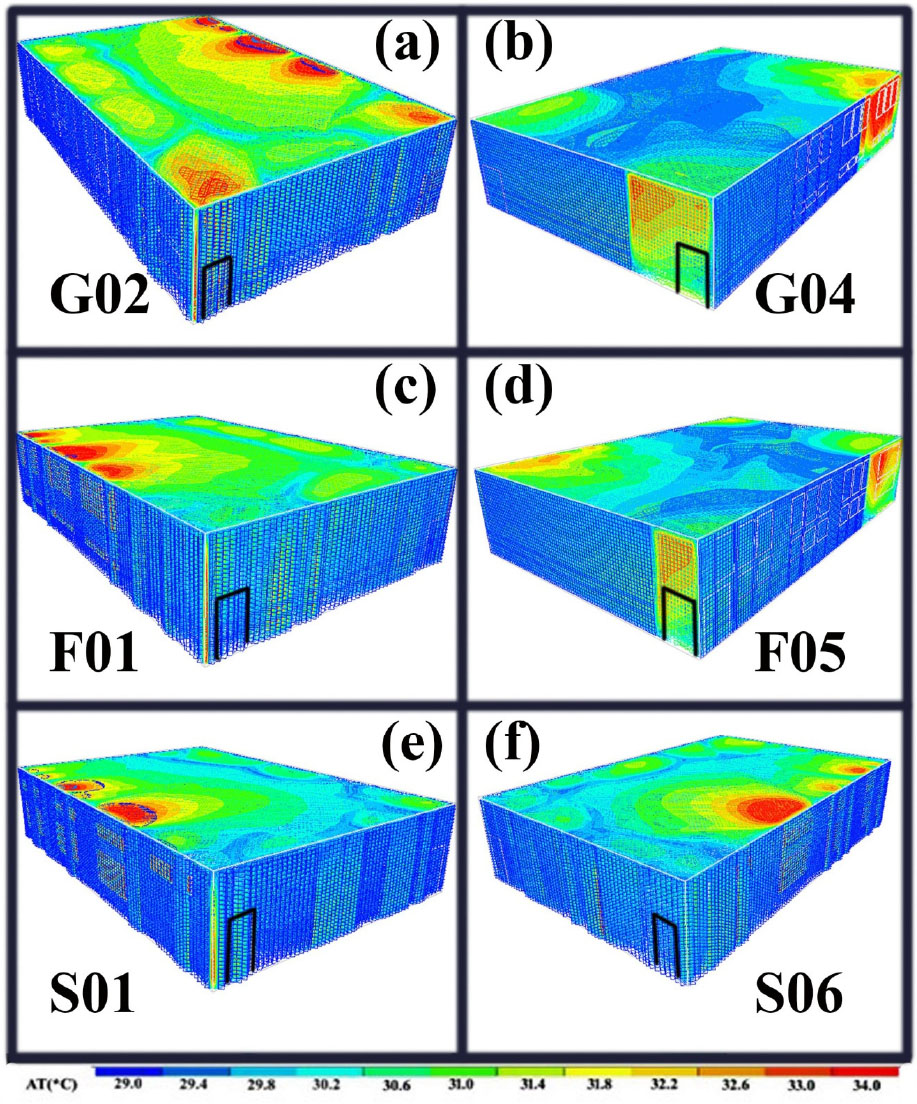
Further, to visually comprehend the synergistic role of building orientation and corridor spaces on the AT dynamics inside the classrooms, CFD simulations were performed in the study area using IES-ve and the typical outcomes are presented in Figure 9. Since all the arguments explained in context to Figure 8 concedes with the outcomes presented in Figure 9, the hypothesis explaining “can building orientation perturb the AT dynamics inside the classrooms?” is also true. It is evident from Figure 9 that there is a considerable amount of hot air movement inside the classrooms via the windows and the doors. Now the question is, whether the corridor heating alone perturbs the AT dynamics inside the classrooms or is there any other parameter that contributes to rise in the classroom temperature? Irrespective of the levels, the classrooms in Figure 9 clearly shows red color contours near the windows and doors. Even if one gives full credit to the corridor spaces for circulating the hot air inside the classrooms near the doors, there is a considerable amount of hot air trying to enter the room via the window opening. Thus, the AT dynamics inside the classroom gets perturbed by the building orientation, the corridor opening, and the window opening. Another fact that needs to be mentioned here is that, hot air prefers to enter the classrooms via the south side of the building. Reason behind the same can be understood from the sun path diagram shown in Figure 2, in the month of March the sun travels from east to west via south. And, that is the reason behind the red color contours around the window opening positioned in the southern side of the building.
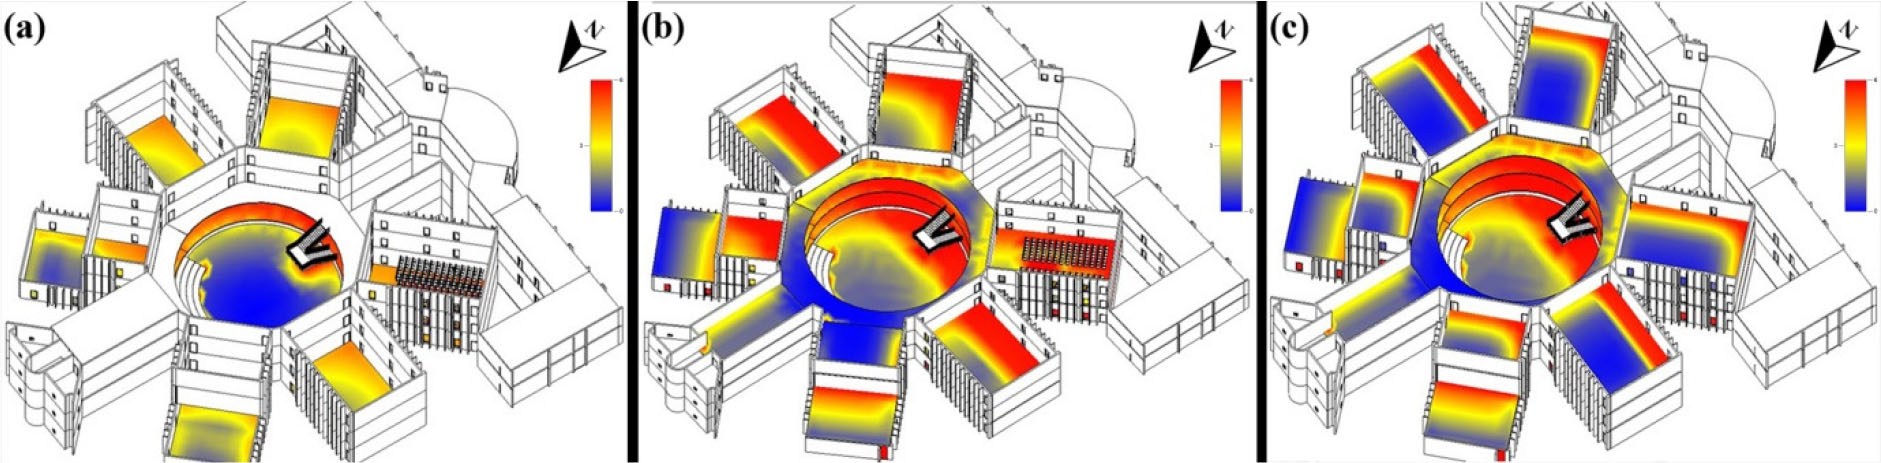
The synergistic effect of the building orientation, the window opening, and the corridor spaces on the AT dynamics inside the classrooms were understood from the solar analysis as shown in Figure 10. The red color contour indicates a hotter surface while the blue colored region indicates a cooler surface. It is clear from Figure 10 that the window opening plays a major role for hot air movement inside the classrooms. The degree/rate of air flow inside the classrooms is apparently higher in first floor than the other two floor levels. Thus, the window opening plays a crucial role alongside the corridor temperature, leading to a synergistic rise in the room temperature. Thus, the solar radiation analysis has provided us with enough clarity to understand, how the building orientation can perturb the air flow inside the academic spaces.
Discussions
Variation in the air temperature observed from field experiments and CFD simulations
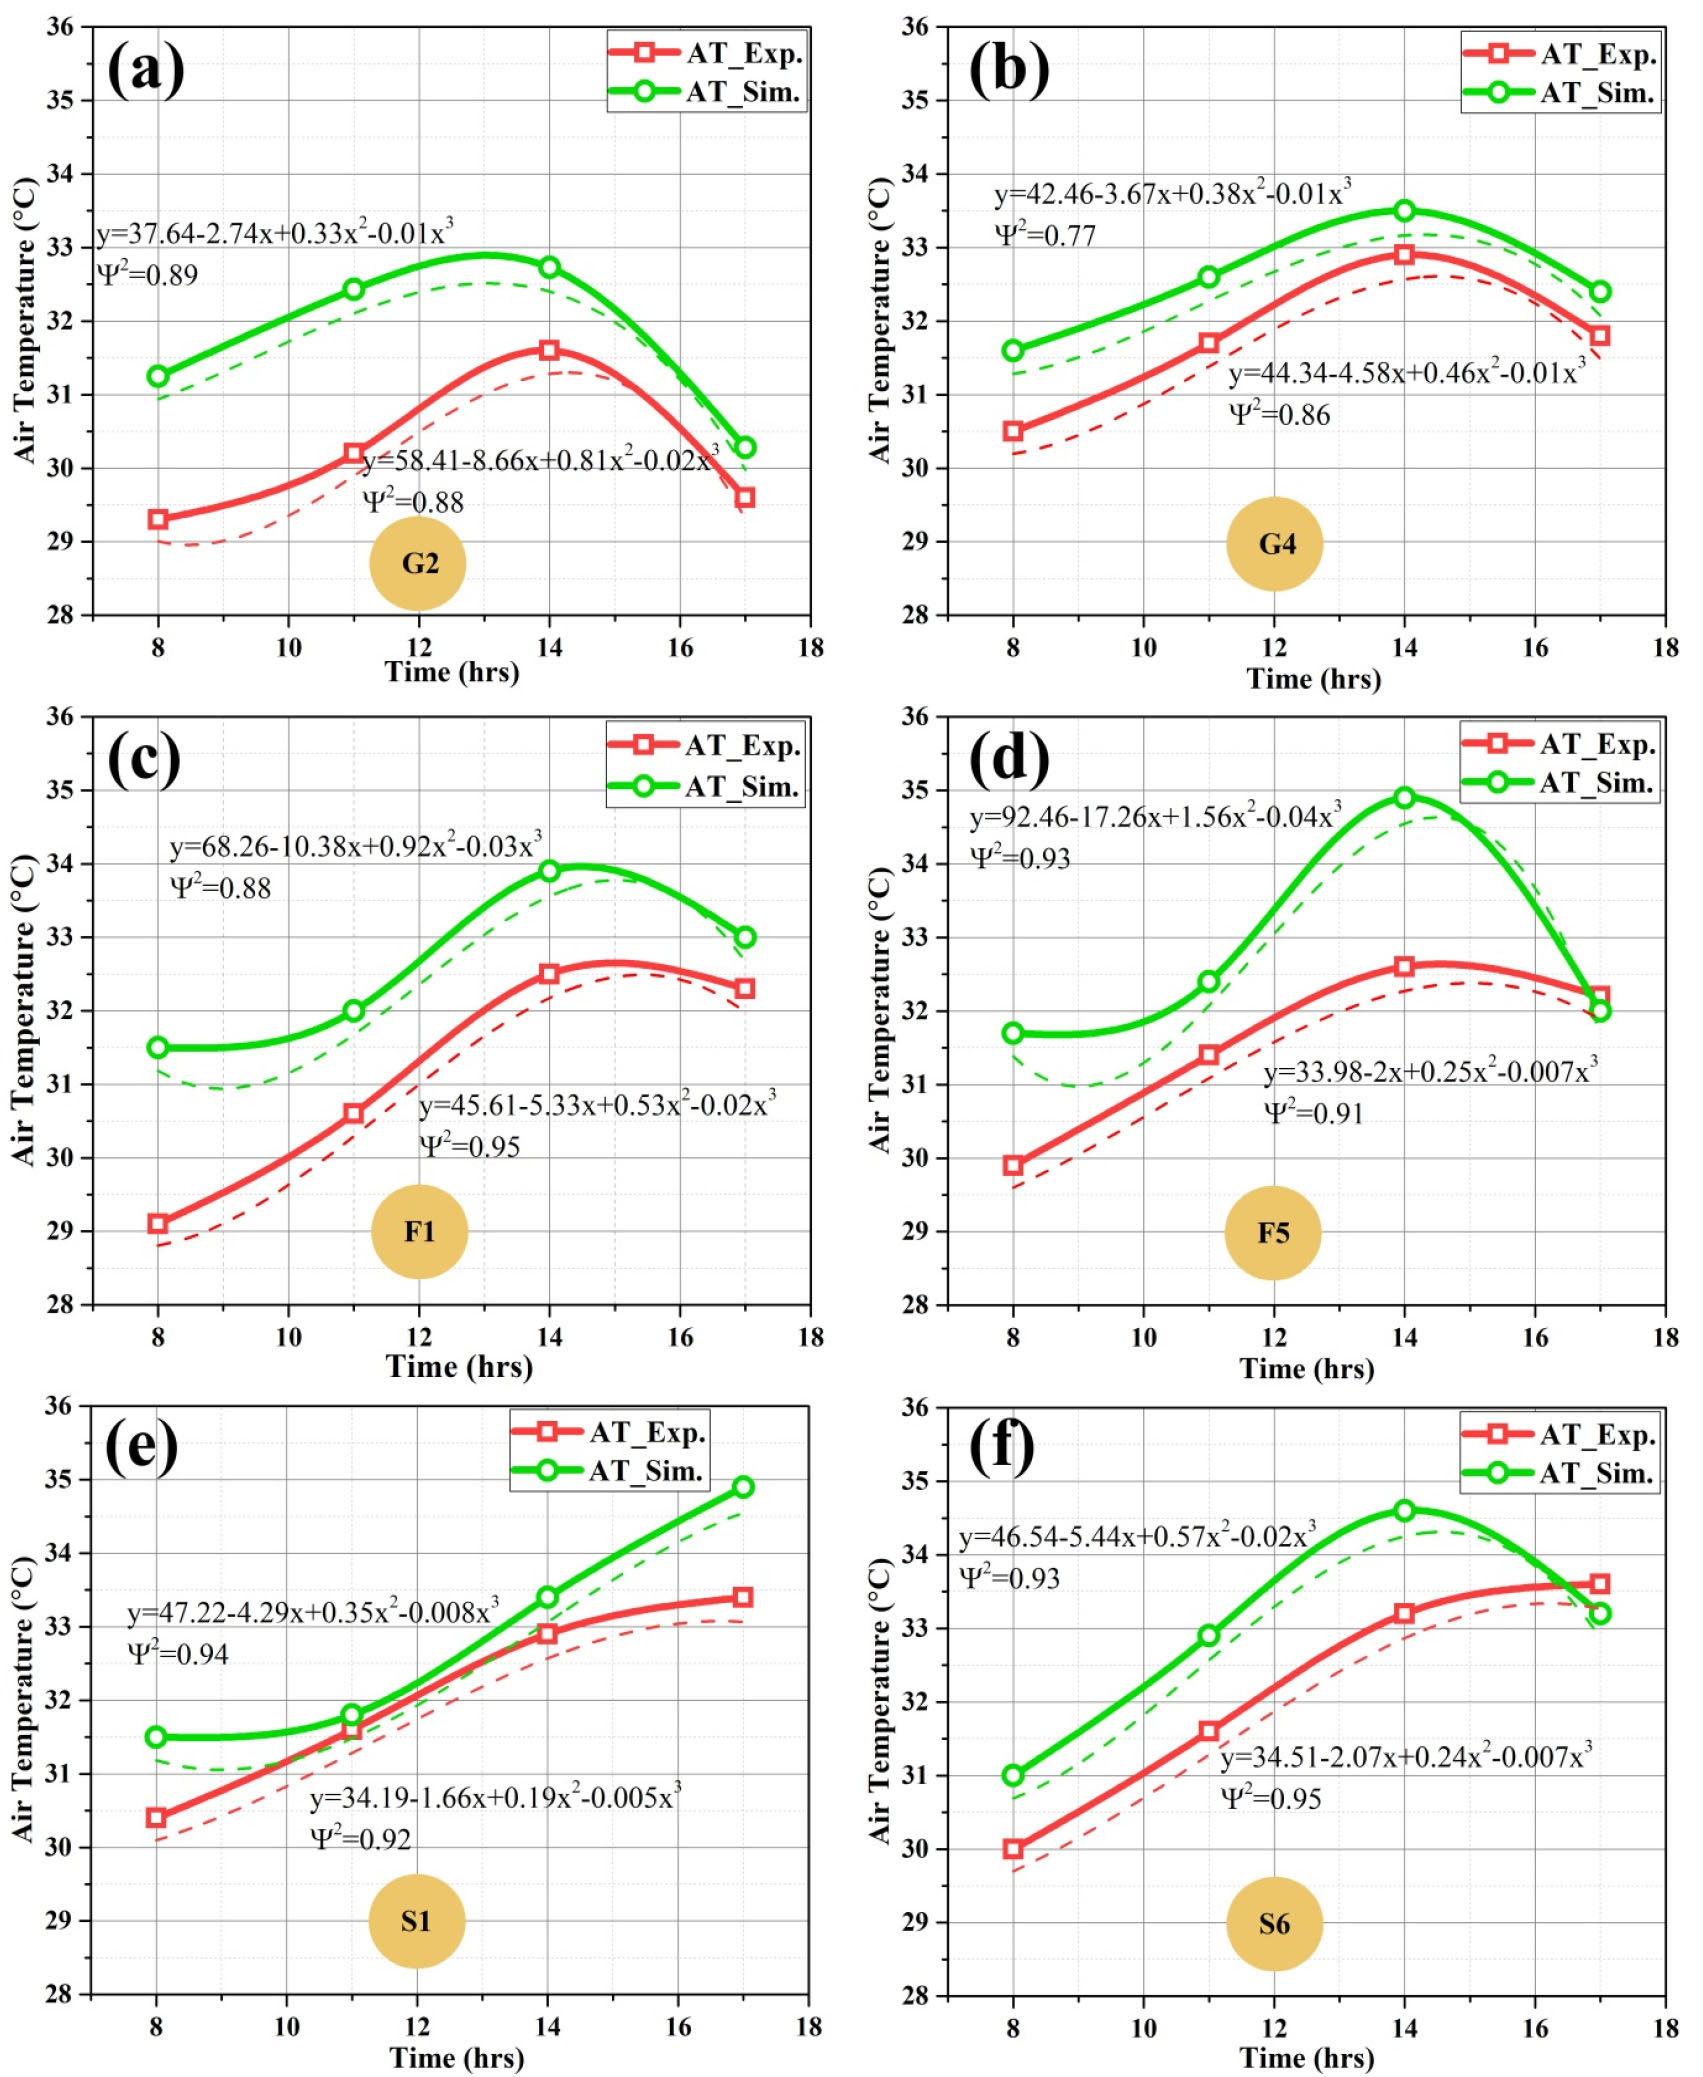
In this section, we have compared the air temperature (AT) outcomes obtained from the field-experiments and CFD simulations, as shown in Figure 11. The red and green color AT profile corresponds to the response from field-experiments and simulations, respectively. It is clear from Figure 11 that the simulation profile goes in parallel with the experimental outcomes, with minor deviations here and there. Though the AT profiles of the simulation mimics the experimental data, their magnitudes differ marginally. Given the experimental/simulation conditions, the governing equation that best explains the room temperature dynamics inside the classroom(s) is found to be a third order polynomial or a cubic equation, as shown in Table 5. If one compares the data points (simulation and experimental) presented in Figure 11 column-wise, it is evident that the AT distribution along the eastern side of the building is apparently higher than that of its western counterpart.
Table 5.
Governing equation(s) that best describes the room temperature dynamics of a -45° oriented building
Variation in the corridor temperature observed from field experiments and CFD simulations
In this section, we have compared the corridor temperature (CT) outcomes obtained from the field experiments and CFD simulations using Figure 12. Both, the experimental and simulation profiles follow a similar trend, with a minor deviations here and there, as shown in Figure 12. But, when it comes to the magnitude of the corridor temperatures, the experimental and simulation outcomes differ slightly, similar to what we have observed earlier with air temperature distributions (see Figure 11). The possible reason(s) behind the deviation needs to be understood and will be of utmost priority in our future work. The rationale behind the corridor temperature distribution in a -45°North oriented building is best illustrated by the governing equations presented in Table 6. By comparing the experimental and simulation outcomes based on the Figure 11 and Figure 12, following inferences were deduced; (a) eastern side of the building is hotter than its western counterpart, (b) southern side of the building heats up faster than its northern counterpart, (c) preferential building orientation (-45°North) introduces a differential heating phenomenon leading to extensive heating of eastern corridors/rooms when compared to their western counterpart, (d) F5 corridor space heats up faster than other corridor spaces, and (e) it also proves that the maximum amount of solar radiation enters through the windows than the corridor spaces and door opening.
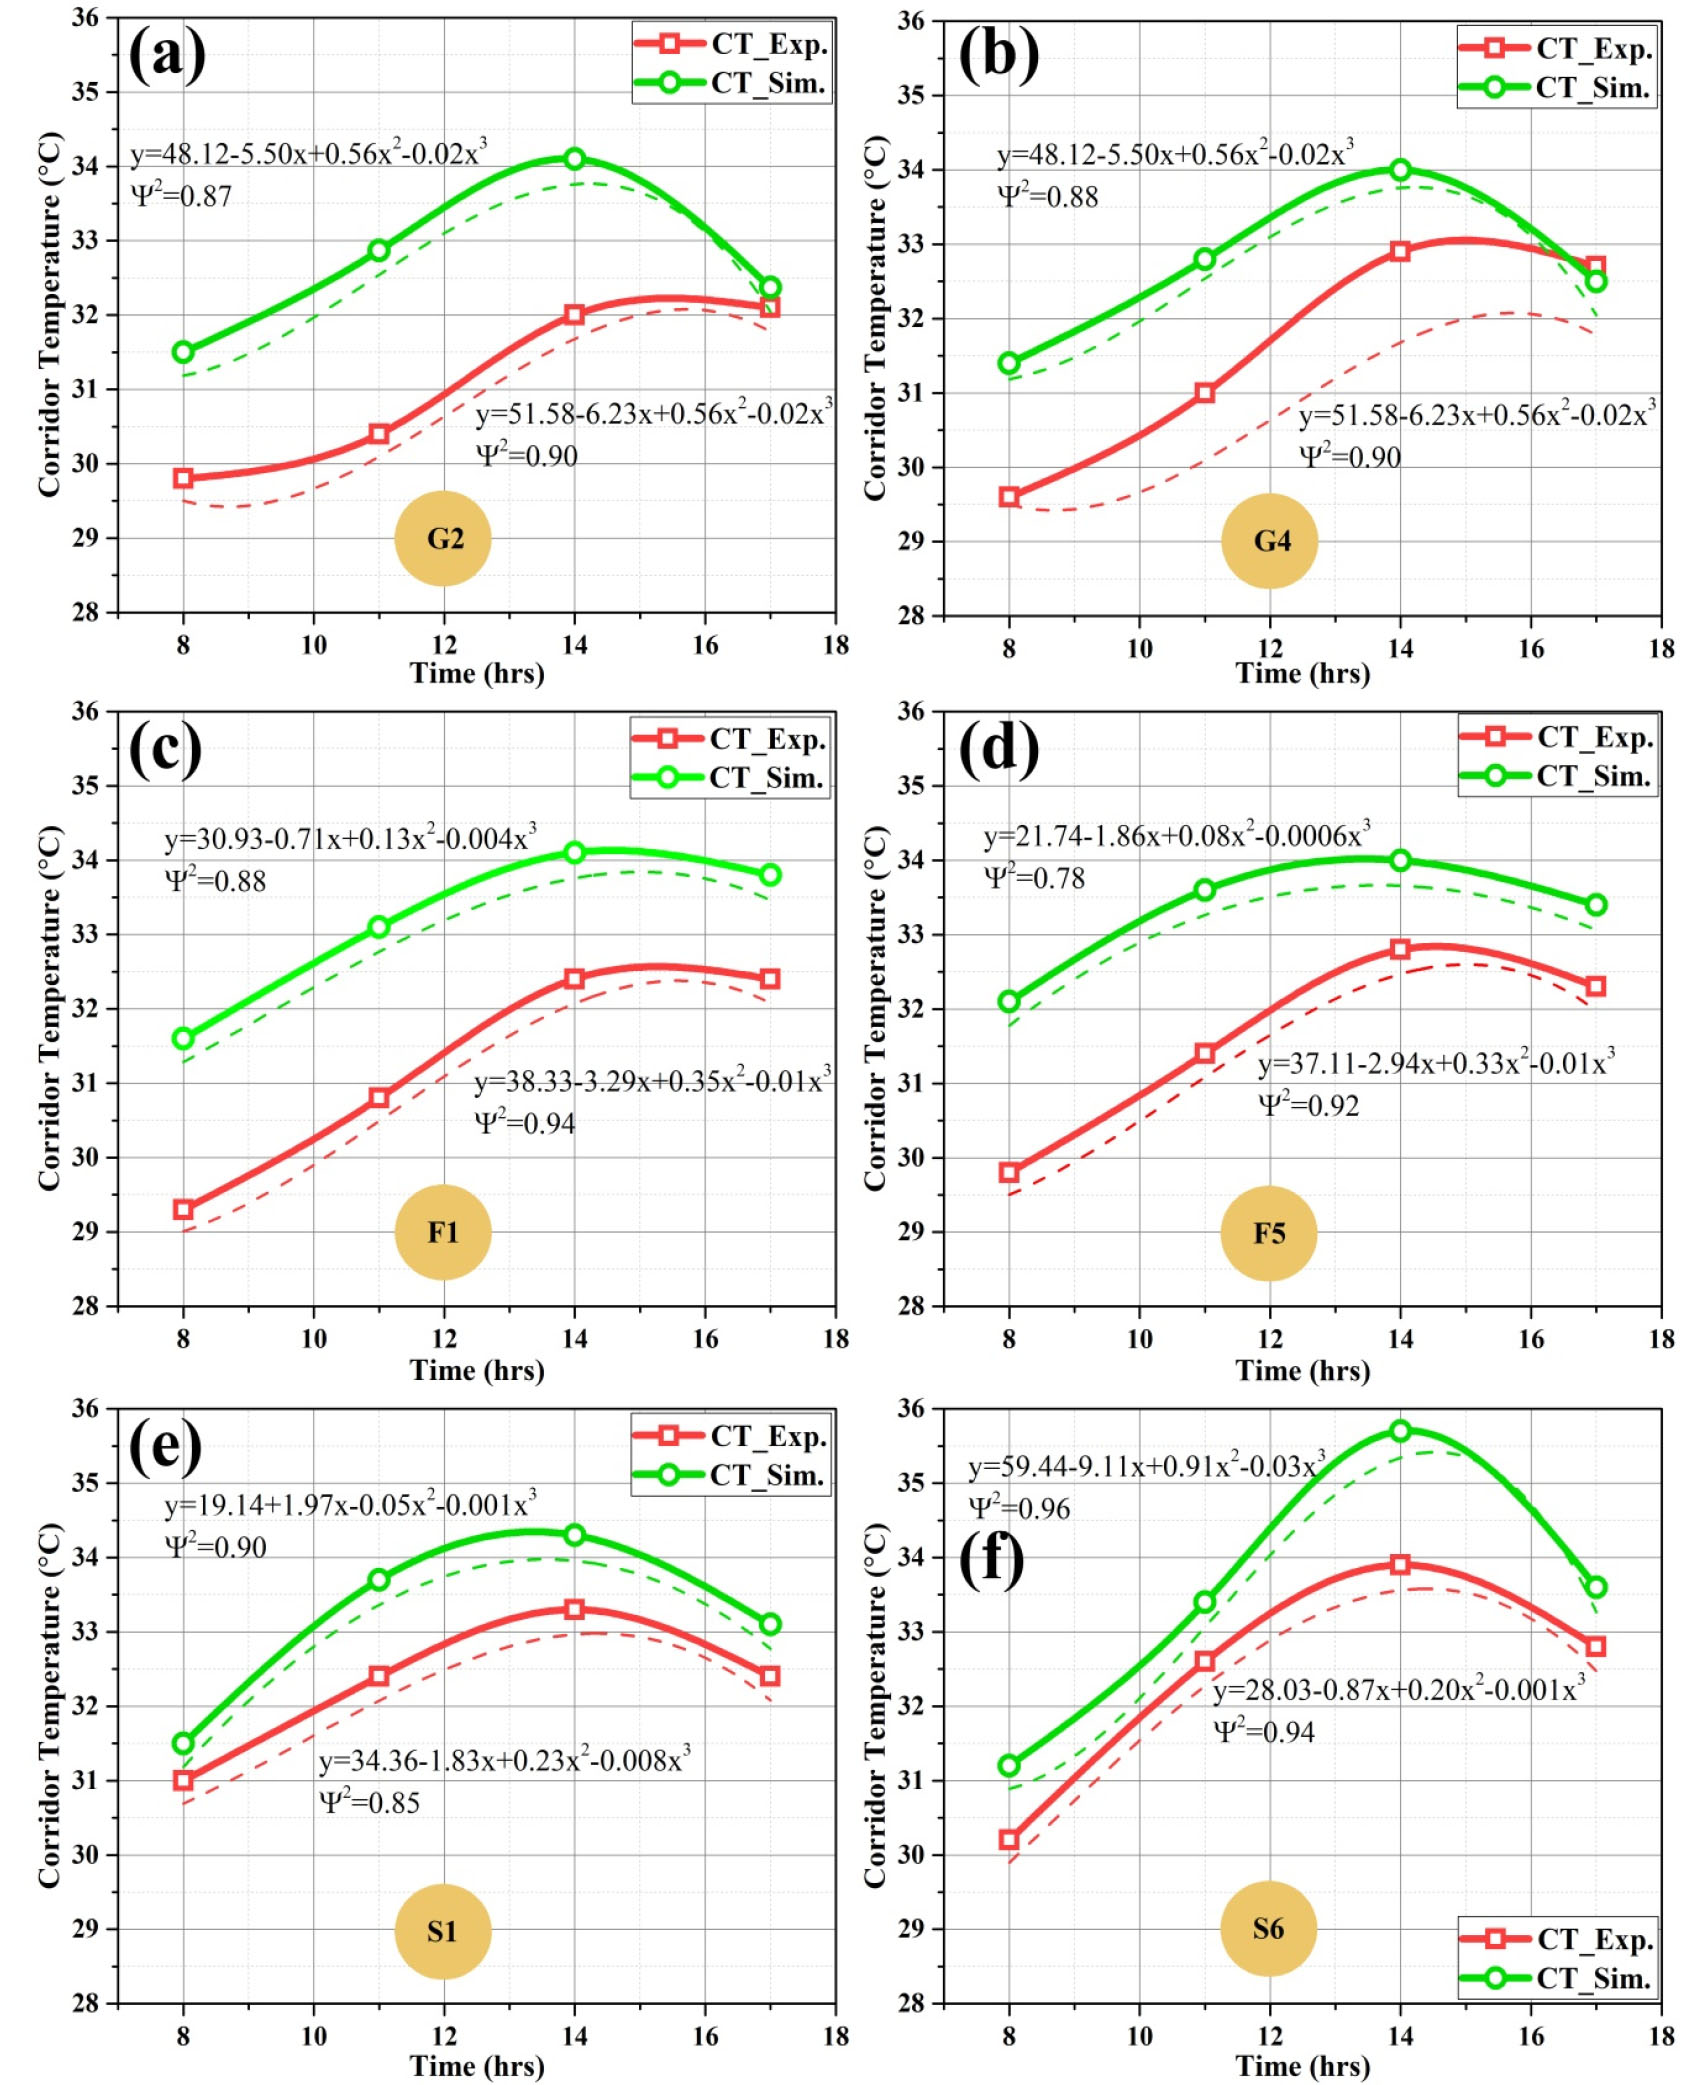
Table 6.
Governing equation(s) that best describes the corridor temperature distribution of a -45º oriented building
Conclusions
The role of building orientation on the shadow behavior, corridor temperature, and room temperature dynamics inside an academic building is studied using field experiments and computational fluid dynamic simulations. The building/courtyard shadow area decreases faster in the -45°North oriented building. In other words, the -45°North oriented building exposes itself favorably to the sunlight than its true north counterpart. This phenomenon exposes the east face of the building to direct sunlight, for the most part of the day. This eventually leads to the preferential heating of the eastern side over its western counterpart (G4, F5, and S6). Ascribed hypothesis was validated with building simulations using IES-ve and Autodesk Revit Insight. Building simulation outcomes concedes with the experimental results, with minor deviations. We have developed a mathematical model which can mimic the physics behind the preferential differential heating phenomenon in the corridor(s) and classroom(s). Building simulation and solar analysis outcomes leads us to the following conclusions; (a) the AT dynamics inside the classrooms is most importantly perturbed by the hot air entering through the window opening than courtyard/corridor heat transfer into the classrooms, (b) the southern side of the classrooms gets heated up faster than its northern counterpart, (c) the solar radiation analysis confirms that the eastern side of the building heats up at a faster rate when compared to its western counterpart, and (d) finally it also acknowledges that the building orientation decides the degree of differential heating phenomenon inside the classrooms. Thus, the building orientation plays a crucial role in deciphering the air temperature dynamics inside the classrooms located in warm-humid climatic conditions.
