

Introduction
WSI Description
WSI Application
Hydrology
Environment
Life
Policy
WSI Computation and Interpretation
Conclusion
Introduction
The sustainable development paradigm promotes inter-generational equity and requires mankind to strike a responsible balance between the anthropogenic pressures on natural resources and the resilience of natural systems (Meadows, 1998). Management of socioenvironmental systems can rely upon sustainability assessment methods based on indexes and indicators, which support decision making in allowing for diagnostic and prognostic studies of scenarios of interest (Siche et al. 2007). In isolation, indicators for environmental, economic, infrastructure and other aspects could not adequately reflect the complexity of sustainability issues (Guimarães & Feichas, 2009). When combined in a multi-dimensional and multi-scale analysis framework, however, they may be used to represent the sustainable development context (Bellen, 2004).
Access to water with adequate quality and quantity is essential for sustainable human development, as water is one of the key resources required to sustain anthropogenic activities (UNESCO, 2001). The concept of water sustainability is used to represent, in a water-centric manner, the interconnected socioenvironmental aspects of natural and human water cycles. The overall goal is to achieve a balanced utilisation pattern that does not compromise the water cycle and ecosystems (Ni et al. 2012). In this context, sound water management approaches are required to promote rational use of resources, but the effectiveness of actions in promoting sustainability also depends on factors which are not under the direct competence of water managers. Aspects such as education, income, health, food demand and level of environmental awareness of a population all interact to determine the form and intensity of water use.
Analyses encompassing one or a few such aspects have been undertaken using indexes such as the Watershed Sustainability Index (WSI), Water Poverty Index (WPI), Canadian Water Sustainability Index (CWSI) and West Java Water Sustainability Index (WJSI) (Silva, 2016). Among these, WSI is an established index for application to river basins and has received international attention in the context of water resources management (UNESCO, 2008). This index integrates key indicators linked to water sustainability in a single analysis framework. Its application has assisted in the identification of threats owing to diffuse source pollution in a Brazilian rural basin (Chaves & Alipaz, 2007), quantitative water scarcity in semi-arid regions of Chile, Mexico and India (Cortés et al. 2012; Jiménez et al. 2013; Chandniha et al. 2014) and a combination of sewage and agricultural diffuse source pollution and soil erosion in Costa Rica (Catano et al. 2009).
In the region of Curitiba, water resources management is undertaken in the remit of Comitê das Bacias do Alto Iguaçu e Afluentes do Alto Ribeira (COALIAR), a river basin committee that encompasses the upper portion of the Iguaçu river basin and the basins of two affluents of the Ribeira river, namely the Açungui and Capivari rivers (SUDERHSA, 2007). The corresponding remit area of 5870 km2 encompasses a large part of the metropolitan region of Curitiba, with a population of 3.2 million inhabitants (93% urban) (IBGE, 2010). All of the water management instruments prescribed by the Brazilian water resources policy have been implemented, but recent data have shown opposing trends in aspects that can influence water sustainability. For instance, from 2001 to 2010 water quality in the Upper Iguaçu river worsened, in a scenario of quali-quantitative scarcity (ANA, 2012); environmental degradation increased as a result of uncontrolled urbanisation (IPARDES, 2013); but socioeconomic aspects, such as indicated by the Human Development Index (HDI) and its sub-indexes improved in the region (IBGE, 2010). This suggests that recent economic growth may have occurred at the expense of natural resources, such as water. In such a situation, environmental resilience and sustainable development can be compromised. Such wide ranging water sustainability diagnostic does not appear to have been made for this region. Thus, the objective of this study was to determine WSI for the COALIAR remit area, to support water researchers and managers in the identification of the most critical aspects that impair water sustainability in the region.
WSI Description
The WSI (Chaves & Alipaz, 2007) is based on the internationally recognised HELP platform (UNESCO, 2001), with four analysis categories or sub-indexes: Hydrology (H), Environment (E), Life (L) and Policy (P). The index is calculated as the average of the four sub index values, as in Equation (1). The range of each parameter is from 0.25 to 1.0. A WSI value is interpreted based on Table 1.

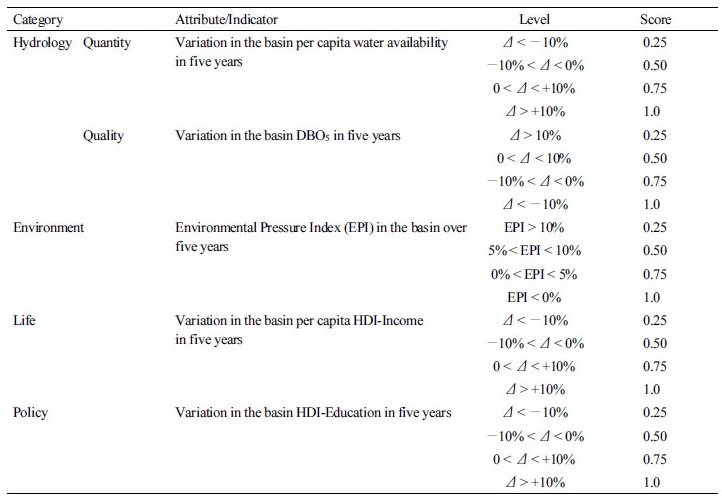
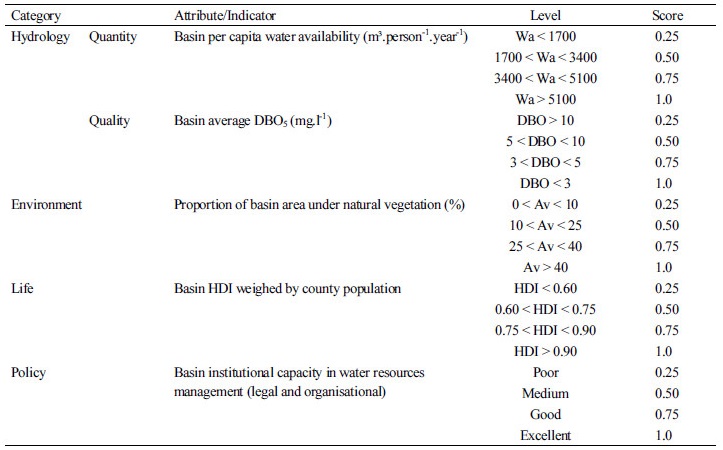
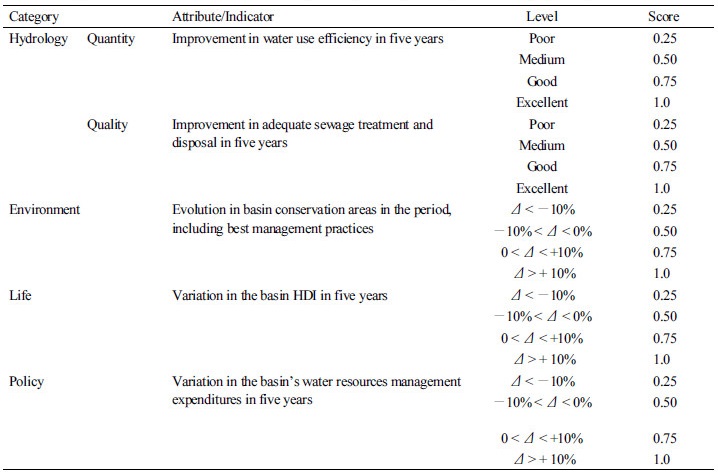
Hydrology is assessed through two sub categories, namely for Quantity and Quality. These sub categories and the remaining categories are each represented by three attributes or types of indicators, namely for Pressure (P), State (S) and Response (R), which allows for cause-effect relationship assessments of the effectiveness of management decision making and any corrective actions. Thus, WSI includes 15 attributes and/or indicators in the sustainability diagnostic of a river basin, as shown in Tables 2, 3 and 4. Chaves & Alipaz (2007) pointed out that the index should be calculated for a management-relevant local-regional scale, and suggested an area of the order of 2500 km2. A suitable timeframe of analysis should allow for effects of management actions and/or climate change to be reflected upon WSI indicator values, so that a five-year period was proposed as standard.
WSI Application
|
Figure 1. COALIAR remit area in relation to the municipalities of the Metropolitan Region of Curitiba. |

The study area for WSI application was the COALIAR remit area, as shown in Figure 1. The Upper Iguaçu, Açungui and Capivari basin areas are 3630 km2, 1285 km2 and 955 km2 respectively (SUDERHSA, 2007). Indicators were computed based on official data and information of Instituto Brasileiro de Geografia e Estatística (IBGE), Agência Nacional de Águas (ANA), Instituto Paranaense de Desenvolvimento Econômico e Social (IPARDES), Fundação SOS Mata Atlântica, Instituto das Águas do Paraná, Sistema Nacional de Informações sobre Saneamento (SNIS), Sistema Nacional de Informações sobre Recursos Hídricos (SNIRH) and United Nations Development Programme (UNDP). Key national and state laws and documents on water resources management and the scientific literature were also consulted. The period of analysis was from 2000 to 2010, which allowed for a consistent match of databases in an adequate and recent time span. Any indicator variations thus computed were then divided by two to adjust to the original five-year scoring levels of Tables 2, 3 and 4. Perhaps such scoring levels could be transformed to a yearly-rate format, in future WSI applications. Data were available for different territorial units, such as municipalities, Human Development Units (HDUs) and river basins. Thus, as required the datasets were transposed to the study area by using area-weighed averaging, so that indicators could be determined for the COALIAR remit area.
Discrepancies were noted in the calculation approach of several indicators by Chaves & Alipaz (2007), UNESCO (2008), Catano et al. (2009), Jiménez et al. (2012) and Cortés et al. (2012), owing to conceptual differences and/or adaptations to data availability. Thus, a sensitivity analysis was done for the effect of indicator determination approaches on WSI, for some indicators which are qualitative in nature or for which there is no estab
Hydrology
The population of the study area was estimated from IBGE (2000; 2010), as 2,735,751 inhabitants in 2000, and 3,135,645 inhabitants in 2010. For computing the Quantity-Pressure and Quantity-State indicators, the basin water availability (Wa) was determinovided by SUDERHSA (2007) considering both surface water and groundwater availabilities, as Wa = Q38 – Q95 + Qgw, where Q38 = 114.4 m3.s-1 was the long term average discharge, and Q95 = 25.74 m3.s-1 was the ecological discharge and Qgw = 27.86 m³.s-1 was the groundwater discharge. As a result, the basin per capita water availability was 1344 m³.person-1.year-1 in 2000, and 1172 m³.person-1.year-1 in 2010. Such levels are usually associated with a water scarcity scenario (Brown & Matlock, 2011). Due to population growth, water availability decreased by around 12% in the ten-year period, which was associated to a 6% decrease in five years. The use of historical discharge data seemed justified by the lack of significant increase in the absolute water availability in the study area in the period, e.g. due to climate change or water transfers. However, both influences are expected to occur in the next few decades (AGUASPARANA, 2007), so that similar calculations in the future may not be solely based on the historical discharge data. For this analysis, based on the above results and Tables 2 and 3 levels, the Quantity-Pressure indicator scored 0.50, while the Quantity-State indicator scored 0.25.
Determination of the Quantity-Response indicator relied on data and information of IPARDES and SNIS, about losses in the water supply system and measures undertaken by the public sector to promote end-user efficiency. It was observed that losses increased by 8% in the period, while in Curitiba, municipal law no. 10785/2003 made it compulsory for new dwellings to install water storage systems and more economic household appliances. Thus, a score of 0.50 was conservatively set to this indicator.
For determining the Quality-State indicator, a representative DBO5 value must be found for the basin. This task is complicated by the fact that monitoring results can be biased by the sampling strategy, and because the diversity of land use patterns over such a large area favour high variability. Thus, two methods were considered in setting the basin DBO5 value for the study area. Firstly, based on historical water quality data at the basin outlet (Formigoni et al. 2011) and for Q38, whereby the value of DBO5 = 6.5 mg.l-1 was found and applied to the whole analysis period. Secondly, based on monitoring data publicly available at Portal da Qualidade das Águas of Brazil’s National Water Agency, the reference DBO5 was calculated as the median value of available data in each year. For this method, for 2000 the result obtained was 7.60 mg.l-1, while for 2010 it was 2.50 mg.l-1. Such values are considerably below the levels measured in river reaches situated in the more densely populated area of the river basin, and especially in Curitiba, where the median values were 19 mg.l-1 in 2000 and 13 mg.l-1 in 2010. Thus, for the study area and based on Table 3, the Quality-State indicator score was set as 0.50.
For the Quality-Pressure indicator, the monitoring data suggested that the basin-wide median DBO5 decreased in the period. In five years, the variation was –33%, which suggested an overall trend of improving water quality in the river basin, at least in terms of the organic load and within the indication capacity of the parameter. This would lead to the maximum score for this indicator, based on Table 2. However, recognising the data limitation to provide a representative DBO5 value for the basin and in view of the known water quality issues, the score was more conservatively set as 0.75 for this indicator.
The Quality-Response indicator was determined using data and information provided by IPARDES and SNIS. Investments on sewage collection and treatment systems increased, so that the population coverage more than doubled in the period, while population growth was around 15%. However, recognising the occurrence of irregular land occupation with off-the-grid dwellings, especially in the urban zone and often in conservation areas, a score of 0.50 was conservatively set to this indicator, based on Table 4.
Environment
The indicator for Environment-Pressure is the Environment Pressure Index (EPI), which is calculated as EPI = (%Va + %Vp)/2, where %Va and %Vp represent variations in basin agricultural area and urban population respectively, both in five years in the study area. The IBGE and IPARDES databases were used, and the computation of %Va took into consideration plantations, pastureland mixed with forest and agriculture mixed with forest. The results thus obtained for the ten-year period were %Va = +2.6% and %Vp = +15.5%, which led to EPI = +4.5% in five years. Based on Table 2, this indicator scored as 0.75, denoting a medium level of continued anthropogenic pressure on the environment.
For the Environment-State indicator, an analysis of data in SOS Mata Atlântica (2011) indicated that 15% of the COALIAR area is occupied by remnant vegetation. Based on Table 3, this corresponded to a score of 0.50 for this indicator.
Data and information made available by IPARDES and SUDERHSA were involved in the determination of the Environment-Response indicator. The number and date of implementation of protected areas were considered. Before the year 2000, 16 preservation units were registered. In the period leading up to 2010, seven further units were implemented. This represented an increase of 22% in five years for this criterion, which would lead to the maximum score for the indicator, based on Table 4. However, due to the authors not being able to access further information about these or other areas, the indicator score was conservatively set as 0.75.
Life
Data provided by IBGE and UNDP for the HDI and its sub index per capita HDI-Income (HDI-I) were used to compute indicator values for this category. Such data was available for two territorial units, namely municipalities and HDUs, so that the computation of HDI results for the COALIAR remit area was made using both datasets, for comparison. The results thus obtained are shown in Table 5. Small differences in HDI values were associated with selecting a given territorial unit over another, which did not affect the subsequent indicator scoring. For a five-year period, HDI-I increased by 3.7% or 3.3% using data for HDUs or municipalities respectively, so that the Life-Pressure indicator scored 0.75, based on Table 2. The basin HDI in 2010 was 0.780 or 0.786 respectively, so that the Life-State indicator scored 0.75, based on Table 3. And, for a five-year period, the HDI increased by 6.4% or 6.5% respectively, so that the Life-Response indicator also scored 0.75, based on Table 4. These results suggested that human development levels in the COALIAR remit area were relatively high on average, which can be partly credited to the metropolitan region of Curitiba performing the role of an economic hub for the area.
Table 5. Results obtained for the COALIAR remit area for the Human Development Index (HDI) and its sub indexes of per capita income (HDI-I) and education (HDI-E) |
|

Policy
Determination of HDI-Education (HDI-E) followed the procedure outlined earlier for other HDIs, and led to the results shown in Table 5. For a five-year period, HDI-E increased by 11% or 12% using HDU or municipality data respectively, so that the Policy-Pressure indicator score was set as 1.0, based on Table 2. It can be noted that formal educational development was relatively high in the study region, but there is no guarantee that environmental education followed the same trend in that period. Not contemplating some natural resource conservation awareness indicator is, perhaps, a drawback of WSI.
The water resources management capacity in the COALIAR remit area was estimated by taking into account both the existence and the effectiveness of legal and organisational instruments. Data and information for this analysis were obtained from SUDERHSA and SNIRH. The following elements were considered: i) national and state legislations; ii) management instruments (national, state and river basin plans; water body classification according to prescribed uses; water permits; water usage charges; and information systems); and iii) management institutions (river basin committee, national and state water agencies, river basin agency). Each criterion was assessed on a scale ‘yes-partial-no’, to reflect its existence relative to the period of analysis. For instance, in 2010: the state water resources plan had just been concluded; the state and river basin agencies had just been created; the river basin management plan had not yet been finalised; and water usage charges had not yet been implemented. Thus, the Policy-State indicator score was set as 0.75, based on Table 3.
To determine the Policy-Response indicator, it was not possible to access sufficient data to quantify investments directly made towards water management actions. Thus, a similar approach as taken by Catano et al. (2009) was used, by taking into consideration information on structural and non-structural actions known to have taken place in the basin to improve water resources. Evidence was found of investments made to support the implementation of linear parks alongside urban rivers to reclaim and protect their banks, enhancements to several wastewater treatment facilities, expansion of the water quality monitoring network and in the river basin committee itself. The associated investment increase was deemed to lie between 0% and 10% in five years. Thus, this indicator score was set as 0.75, based on Table 4. Future investigations may include investments arising from the water charging scheme implemented in 2013.
WSI Computation and Interpretation
The WSI result of 0.69 was obtained for the study region, by using Equation 1 and with the category scores shown in Table 6.

In relation to the types of indicators, it can be noted that the lowest score occurred for State, with 0.59, which might be explained by the strong urban footprint associated with the presence of a metropolitan region in the study region. This was followed by Response, with 0.69, and Pressure, with 0.78. Such WSI value was associated with the Intermediate sustainability class of Table 1. This result was the most conservative estimate made herein with different calculation approaches, but the index has shown a low sensitivity to the variation of indicator calculation methods (please see Castro & Loureiro, 2016 for individual indicator results, further information and in-depth analyses). This note may be reassuring for future investigations involving similar assessments, for minimising biases arising from, for instance, the transference of data and information from a municipal or Human Development Unit format to the river basin remit area of WSI, or to scoring indicators which are qualitative in nature or for which there is no established calculation method. Such a low sensitivity of the index might also be attributed to the relatively low scoring resolution, with only four tiers (0.25, 0.50, 0.75 or 1.0), and/or to the ranges of results of specific indicator associated with each tier. The fact that the Intermediate class in Table 1 is numerically the widest of the three, for a range of 0.30 (against 0.25 for Low and 0.20 for High) arguably slightly favours it as the most likely assessment outcome.
There was a marked disparity among the four aspects that influence water sustainability, as indicated by WSI. It was found that the Hydrology category was the most severely impacted in the study region, with a score of 0.50, followed by Environment, with 0.67. This outcome came as no surprise, since the Upper Iguaçu river, in particular, is known for its highly degraded state, suffering from virtually all of the typical urbanization problems of a developing country.
The relatively high scores obtained for Life, with 0.75, may have been impaired in recent years due to the national economic crisis. This could be verified through an up-to-date assessment with consistent data and/or projections. The Policy score of 0.83 is expected to improve further in such an update, if based on similar analysis criteria as used herein.
Overall, these results suggested that any socioeconomic and water management improvements were not accompanied by comparable improvement in natural resource stocks. Broadly speaking, such a scenario is notoriously associated with a decreasing resilience of natural systems, which may compromise inter-generational equity and the promotion of sustainable development. The river basin management plan anticipates that water transfers into the region will be required, in the short to medium terms, to prevent the current scenario from deteriorating further, as population continues to grow.
Conclusion
In this study a water sustainability assessment was undertaken for Curitiba and surrounding region, based on an application of the Watershed Sustainability Index (WSI) for the period from 2000 to 2010. The analysis indicated an intermediate sustainability state. Substantial differences were found among the four analysis categories, namely for Hydrology, Environment, Life and Policy. Critical issues that compromised sustainability were a quali- quantitative water scarcity scenario and insufficient preservation of remnant vegetation, both of which were made worse by population growth. Human development levels and the water resources management capacity were relatively high and improved further in the period. A significant improvement in the water sustainability scenario probably can only be achieved through large scale structural measures, such as water transfers and more efficient and widespread basic sanitation. Such measures could be instrumental in reversing the threat of environmental unsustainability in the medium term, to hopefully prevent the occurrence of a water crisis in the region of Curitiba.
Future studies could determine WSI or a similar index up to the present day, and estimate future decadal scenarios taking into account the effects of climate change, population growth and expansion of the water supply and sanitation systems.
