Introduction
Material and Methodology
Climate regions of Algeria
Structure of the exterior wall used in the optimization
Annual heating and cooling loads calculation
Economic model and optimum insulation thickness
Calculation of CO2 emission
Results and discussions
Conclusion
Introduction
The global energy consumption of a country accounts for the consumption of several sectors, including industry, transportation, and construction. In Algeria, the energy demand in the building sector still high, with consumption in the household sub-sector reaching 36%, according to the national energy balance published by the Ministry of Energy [1]. This percentage increases every year due to demographic growth, which increases the annual energy requirement and has repercussions on greenhouse gas emissions that affect global warming. From an economic and environmental point of view, it is necessary to use energy efficiency measures. One of these measures is of the passive type and aims to introduce thermal insulation into the building envelope, with the main goal of reducing energy consumption and thus reducing CO2 emissions related to the heating and cooling of buildings, while ensuring suitable comfort for the occupants.
In the literature, there are many studies on the determination of the optimal thickness of insulation. The thickness of the insulations materials can vary depending on the physical characteristics of the buildings (thermal property of the envelope), the insulating materials, his location, the energy sources used to power the air conditioning systems, as well as the economic parameters. Kaynakli [2] reviewed previous research, and presented a comparative study of the approaches used for the estimation of the transmission load as well as the economic models applied in the optimization procedure. A practical application was conducted, and the results showed that a building in the city of Ardahan needs 3.1 times thicker insulation than a building in the city of Iskenderun. Nematchoua et al. [3] also reviewed the more recent literature on thermal insulation applications and presented an example for a tropical climate under dynamic conditions. He found that the south facing wall compared to the other orientations has the lowest value of optimum insulation thickness 0.09 m, and the longest payback period 4.73 yr.
Determining the heat gain and the heat loss of a building with the concept of degree-days is an approach that appears in several studies [4, 5, 6, 7, 8, 9, 10, 11, 12, 13]; it allows an evaluation of the annual heating and cooling energy needs. Kurekci [14] used the degree-day method for 81 provinces of Turkey with natural gas, coal, gasoline and LPG as fuel and XPS, EPS, Glass wool, rock wool, and polyurethane as insulation. The annual energy gains for Istanbul province are 8.83, 6.37, 4.41, and 2.12% for natural gas, coal, fuel oil and LPG respectively. As a result, natural gas was found to be the most cost-effective energy source with the lowest insulation thickness compared to other fuel types.
In practice, exterior walls often contain windows, whereas in the literature there is only a few researches on the influence of glazing types and areas on determining the optimal insulation thickness of an opaque wall. Ozel [15] studied the influence of the glazing to total wall area on the optimal thickness of extruded polystyrene of an exterior wall located in the city of Elazig in Turkey. For different orientations, he found that the transmission loads of heating and cooling could be considerably reduced with the right combination of insulation thickness and glazing percentage. In the case of a south-facing wall, for values ranging from 0 to 60% of the glazed area, the results obtained for the optimal thickness of the insulation range from 2.5 to 8.5 cm. With the aim of improving thermal comfort and reducing energy consumption, Derradji et al. [16], determined the optimal thickness of expanded polystyrene by varying the glazed area in the walls and the type of glazing, for different structures composing the envelope of Algerian classical buildings. They found that the thickness varied for cooling from 1 to 2.5 cm and from 1 to 7 cm for heating, while the energy savings vary respectively from 0.5 to 1.5 $/m2.yr and from 0.05 to 12.7 $/m2.yr in winter and summer. The lowest saving was found for natural gas as an energy source and the highest was for electricity. Ozkan and Onan [17], evaluated the effect of variation in the percentage of glazed area in an exterior wall on heating energy demand, as well as the optimal thickness of two types of insulation, extruded polystyrene foam and rock wool. Where the ratio of glazing area to exterior wall area is 20%, the results obtained showed that the optimal thickness of polystyrene with natural gas as an energy source varies between 3.6 and 8.6 cm, the savings between $11.79/m2.yr and $64.65/m2.yr according to the studied region. The reduction in energy consumption has led to a decrease in CO2 emissions of up to 50.91% with natural gas as fuel and extruded polystyrene as insulation.
Other researchers have examined the contribution of insulation to the reduction of CO2 emissions from fuel combustion but in the case of walls without windows [18, 19, 20, 21, 22, 23, 24]. Mahlia and Iqbal [25] studied the reductive potential of several insulating materials by applying their optimal thickness in an exterior wall to reduce the electrical energy consumption and CO2 emissions related to the electrical production in the Maldives. They also introduced an air gap in the wall and their results showed a 65% to 77% reduction in CO2 emissions by combining a 6 cm air gap with the optimal thickness of the insulation materials. Ozel [26], in his study, determined the environmental impact of several insulations with coal and electricity for heating and cooling. The fuel consumption, energy saved, payback periods and reduction of CO2 and SO2 emissions were estimated for extruded and expanded polystyrene, rock wool and glass wool, with a reduction ranging from 68% to 89.5% for the optimal thicknesses. He found that rock wool had the smallest value of 5.4 cm while the largest value found was for glass wool of 19.2 cm. The greatest reduction in CO2 emissions with a value of 19.55 kg/m2.yr was for the rock wool and the smallest for the glass wool.
The main goal of this study is to evaluate the impact of both the ratio of the glazing to total wall area in a concrete wall and the energy sources available in the local market on the optimal thicknesses of expanded polystyrene and on CO2 emissions. All the climatic regions of Algeria are considered. Seven cities, characterized by their heating and cooling degree-days, have been chosen to represent each climatic region. In order to achieve these objectives, improvements are made to the mathematical expression of the optimal insulation thickness determined by the life cycle cost analysis model. This economic model can be found in several previous studies [14, 18, 26, 27, 28, 29]. These improvements allow for the direct calculation of the optimal insulation thickness as a function of the GAP for heating and cooling period separately or for annual assessment. The annual savings are evaluated for the optimal EPS thicknesses for each climatic regions based on the percentage of glazing ranging from 0% to 50%, as well as the optimal energy sources combinations, which are natural gas, butane gas and electricity for heating with electricity for cooling. Then, the seasonal and annual environmental impact is evaluated with and without insulation as well as by varying the glazed area and type of glazing for each climate region.
Material and Methodology
Climate regions of Algeria
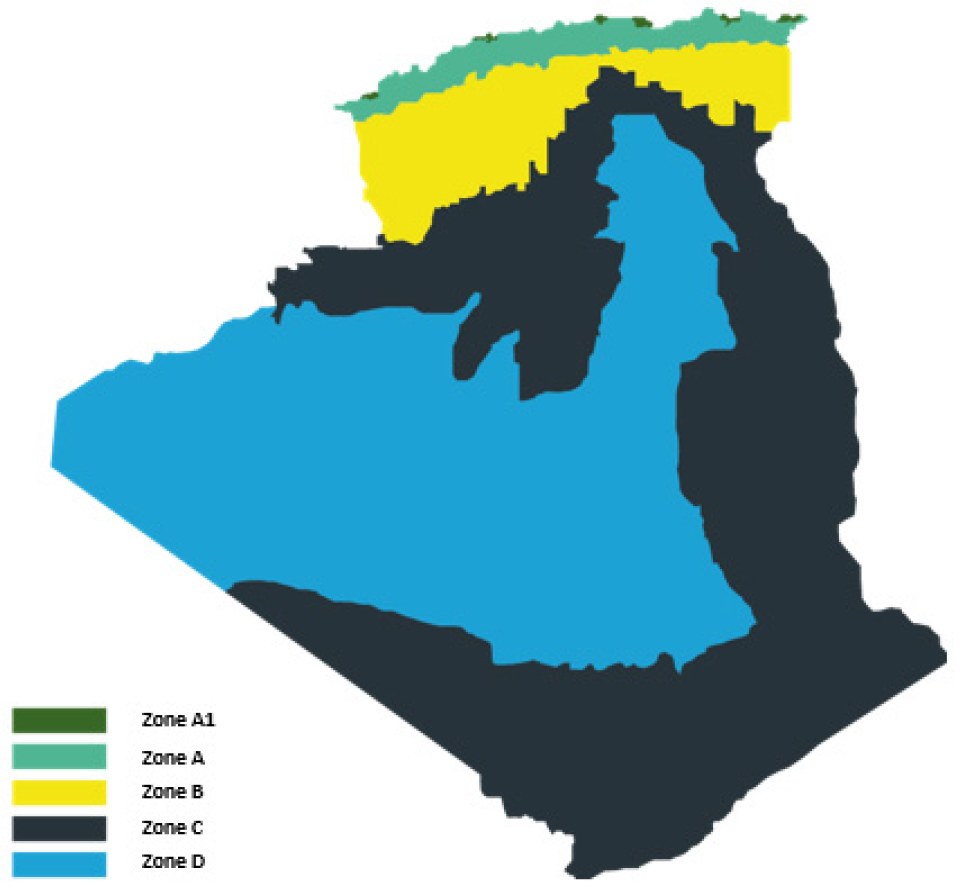
According to the Algerian thermal regulations [30], the country is divide into five regions (A, A1, B, C, D) for the winter period and six regions (A, B, C, D, E, F) for the summer period, the summer sub zone are not considered in this study, and the climatic regions for winter season are Illustrated in Figure 1. The average daily outdoor air temperatures are set over a 10-year period from 2000 to 2009 with METEONORM 7.3, a meteorological software. (Table 1) gives the heating and cooling degree-days for the selected cities, each one is located in a summer and winter climatic regions defined by the Algerians standard. The number of degree-days is set for indoor base temperatures of 21°C for heating and 24°C for cooling.
Table 1.
Location of the cities and their corresponding climatic regions with their heating and cooling degrees-days
Structure of the exterior wall used in the optimization
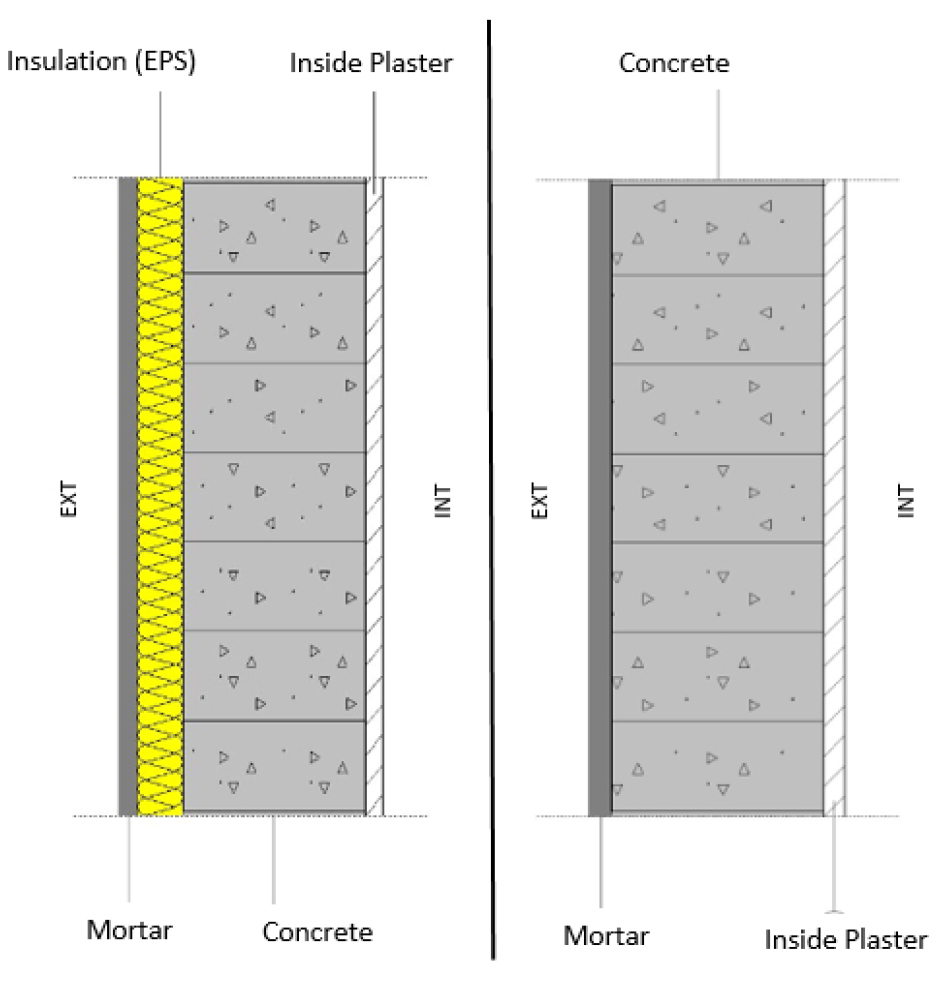
In this study, the exterior wall illustrated in Figure 2 is composed of a plaster layer on the interior side, a main structure made of concrete and a layer of cement mortar on the exterior side. Expanded polystyrene is used as insulation with a thermal conductivity of 0.046 (W/m. °C) and for the transparent part two types of glazing are considered, single glazing (Uw = 5 W/m2. °C) and double-glazing (Uw = 2 W/m2.°C).The physical properties of building materials constituting the studied wall are summarized in (Table 2).
Table 2.
Physical parameters of the materials
| Materials | Thickness (m) | λ (W/m. °C) | R (m2.°C/W) | U (W/m2.°C) |
|
Plaster concrete Mortar |
0.02 0.2 0.02 |
0.35 1.75 1.4 |
0.057 0.114 0.014 | 2.81 |
| Insulation (EPS) | / | 0.046 | / | / |
Annual heating and cooling loads calculation
The building envelope is the main protection against temperature variations between the indoor and outdoor environment. For cooling and heating, the estimation of the transmissions loads through the wall is conducted with the degree-days concept.
The number of heating and cooling degrees-days is established with the Eqs. (1) And (2) for base temperatures of 21°C and 24°C respectively for winter and summer, these values are applied for all climatic regions. It is noted that two degrees have been subtracted from the base temperature in order to take into account the internal gains, due to the occupants as well as to the various household appliances.
Where To is the average daily outdoor temperature, and Tb is the indoor base temperature. The temperature difference is calculated for each day of the year. The number of degrees-days for the heating and cooling period and defined by the sum of the positive values [2].
The equations (3) and (4) represent the transmission loads Ql and Qg, where Qg (W/m2) is the heat gain and Ql is the heat loss through the entire wall area. For the estimation of the transmission loads through the transparent part of the wall, only the temperature difference between the internal and external environment is considered.
U (W/m2. °C) is the overall transmission coefficient of a non-homogeneous wall consisting of an opaque and transparent part; it is expressed using the area weighted method and is given by [16] as follows:
Rwt (m2. °C/W) is the total thermal resistance of the wall without any insulation, (W/m. °C) the thermal conductivity of the insulation and symbolizes the thickness of the insulation. While and 𝛿 correspond respectively to the heat exchange coefficient of the window and the glazed area percentage of the wall.
Economic model and optimum insulation thickness
The addition of an insulation layer in the wall increases the thermal resistance and thus reduces the heating and cooling transmission loads. The optimum insulation thickness is calculated with respect to the heat transmission from external walls of the building, which means that the other load do not influence the optimal value [31]. Increasing the thickness of the insulation will reduce the energy bill over the life of the building but leads to a higher investment cost. In fact, the life cycle cost analysis allows the estimation of the optimal thickness of the insulation by minimizing the total cost, which includes the insulation and energy consumption costs [32].
The annual energy costs per unit area of a wall surface for heating and cooling are assessed with Eq (6) and (7).
Where (CF) is the cost of fuel, i.e. natural gas and butane gas ($/m3), (CE) represent the cost of electricity ($/ kWh). (Hu) is the lower heating value of fuels, () and (Cop) respectively the efficiency of the heating system and the coefficient of performance of the cooling system.
PWF is the present worth factor calculated with equation (8) where (r) is the effective interest rate adjusted for the inflation rate and (N) is the lifetime of the building. The actual value of energy cost for heating and cooling is obtained by multiplying the annual cost of energy by the present worth factor, the annual total cost per unit area (9) corresponds to the sum of the actual value of energy and the cost of insulation Ci $/m3[26].
The optimum insulation thickness is determined by deriving the expression of total cost eq (9) as a function of insulation thickness Xi (m) and setting the derivative equal to zero, to yield equations (10), (11), (12).
From equations (3), (4), (5) and (9), we extract the new expressions of Xopt as a function of the GAP (δ), for the heating or cooling period only or for the whole year. With this simplified formulation, the optimal thickness can be rapidly estimated for any insulation based on the percentage of glazing to be added to an opaque wall.
The general formula for an annual analysis is described as follows:
With equation (13), the optimal resistance of the insulation layer can also be calculated by dividing the optimal thickness by the thermal conductivity of the expanded polystyrene [18].
The energy savings Cs ($/m2) due to the presence of insulation is calculated from the difference between the costs without insulation and the costs induced after the application of insulation in the wall. Therefore, the optimal cost saving is defined as the difference between the total cost without insulation and the total cost resulting when the optimal thickness is applied.
Calculation of CO2 emission
The energy sources available in the Algerian market are natural gas, butane gas, and electricity is essentially produced from natural gas as primary energy. To evaluate the resulting carbon dioxide emissions from the combustion of natural gas for electricity production an emission factor is used, this factor is established by [33]. (Table 3) gives the parameters used in the calculation, fuels characteristics and costs.
Table 3.
Parameters used in the calculations
| Parameters | values |
| Natural gas (Heating) | |
| Hu | 34,54 MJ/m3 |
| 93% | |
| CF | 0.0355 $/m3 |
| ρ | 0,679 Kg /m3[34] |
| MCo2 | 2,743 kg CO2/Kg |
| Butane gas (Heating) | |
| Hu | 111 MJ/m3 |
| 93% | |
| CF | 0.3795 $/m3 |
| ρ | 2,53 Kg /m3[34] |
| MCo2 | 3,028 kg CO2/Kg fuel |
| Electricity (Heating and cooling) | |
| Cop | 2.5 |
| CE | 0.0447 $/KWh [35] |
| Conversion factor | 0,535 Kg CO2 / KWh, [33] |
| Insulation (EPS) | |
| Ci | 39 $/m3 |
| Economic parameters | |
| Interest rate, r | 6% |
| Lifetime, N | 30 years. |
| PWF | 13,765 |
The expression of the general chemical formula for the combustion of a fuel is given by [26] as follows:
Where X and Y are constant and are calculated with the following expressions:
The chemical formula of natural gas and butane gas combustions as given in reference [34] are expressed in (18), (19).
In order to estimate the rate of CO2 emissions resulting from the combustion of one kilogram of fuel, i.e. natural gas (methane) as well as butane gas (butane), the following formula is used [26]:
Where M is the fuel mole weight and is expressed as follows:
The yearly fuel consumption is determined using the following equation [19]:
Thus, the yearly carbon dioxide emissions are obtained by summing the emissions released by fuel combustion for heating, and the emissions caused by the electricity generation for both heating and cooling.
Results and discussions
In this study, the combined effect of several GAP and energy sources on the optimal thickness of expanded polystyrene (EPS) and on the resulting CO2 emissions is evaluated. To this end, the life cycle cost analysis is applied to seven cities for a 30 years building life time.
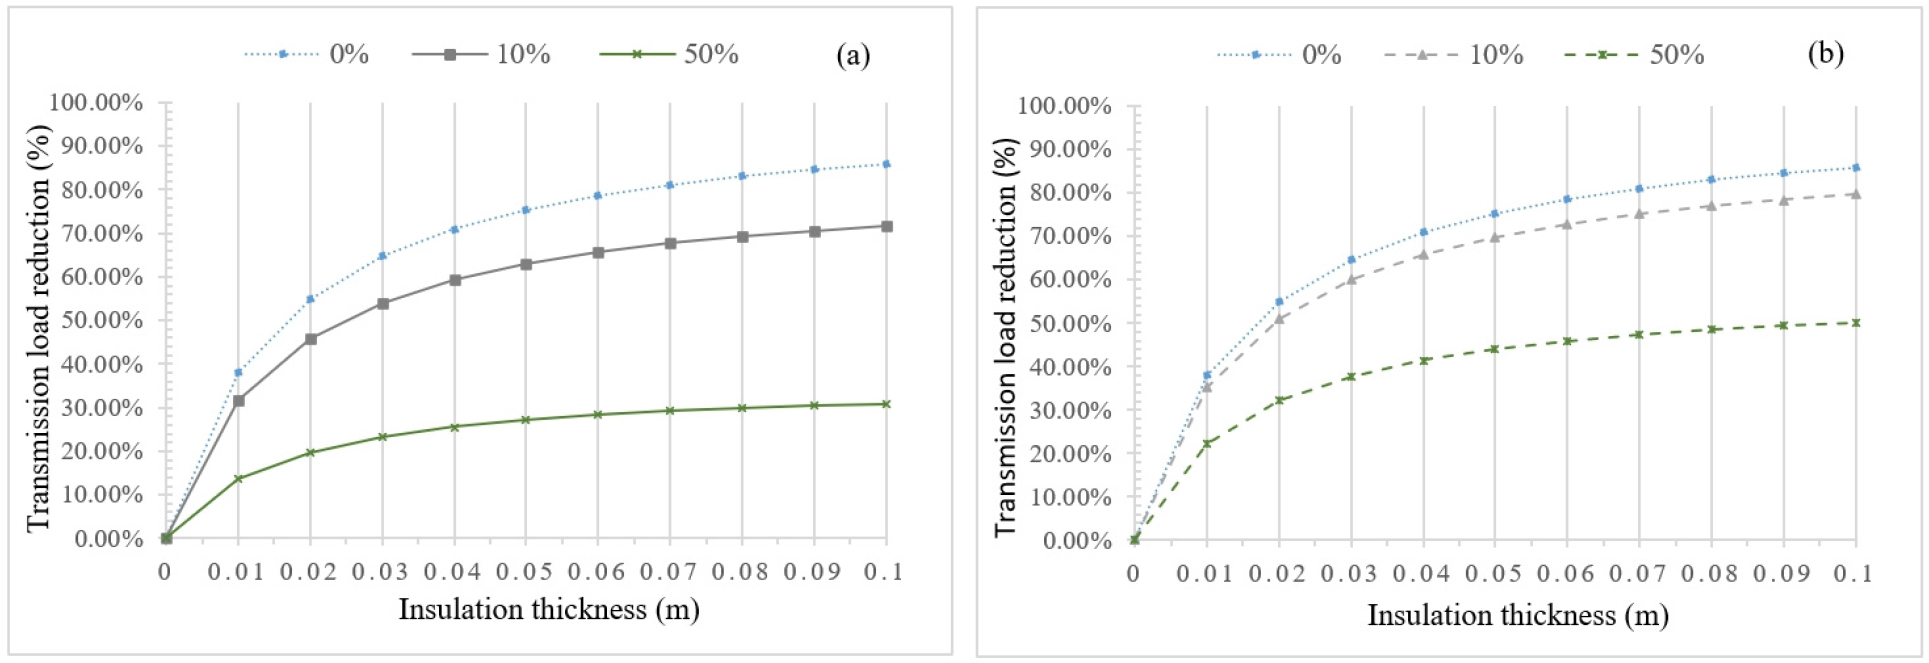
Figure 3(a) and 3(b) shows the influence of the EPS thickness on the transmissions loads expressed in percentage of reduction for a conrete wall with a glazing area percentage of 0%, 10% and 50%, respectively for single and double-glazing. These percentages of reduction are valid for the heating and cooling transmissions loads in all the studied climatic regions because they are essentially related to the physical property of the wall. In the case of a wall without glazing, the transmissions loads reduction is the highest and exceeds 80% for thicknesses greater than 6 cm. If we consider a wall with windows, which is more realistic, the reduction becomes smaller when the glazing area percentage is increased but the reduction is more significant for a double glazing than for a single glazing. However, in all cases, the reduction increases rapidly for small thicknesses of insulation up to 4 cm, the reduction for this thickness is 59.26% for a GAP of 10% and 25.54% for a GAP of 50% with a single glazing, whereas for a double glazing it is 65.77% reduction for a GAP of 10% and 41.47% for a GAP of 50%. Beyond a thickness of 4 cm there is a slowing down in the reduction of the transmission loads but reached for a thickness of 10 cm 71.76% and 30.93% respectively for a GAP of 10% and 50% with single glazing, the reduction with a double glazing for the same thickness is 79.64% for a gap of 10% and 50.21% for a gap of 50%. It is clear that for a double glazing window combined with insulation, the thermal performance of the wall is improved much more than with a single glazing. In fact, as the glazing area increases, the energy needs growth, but the increase rate is lower for double glazing window compared to single glazing. [36] showed similar results considering only the heating energy requirement, but as long as the degree day method is used, the percentage of reduction in energy requirements due to wall insulation remains the same for both heating and cooling.
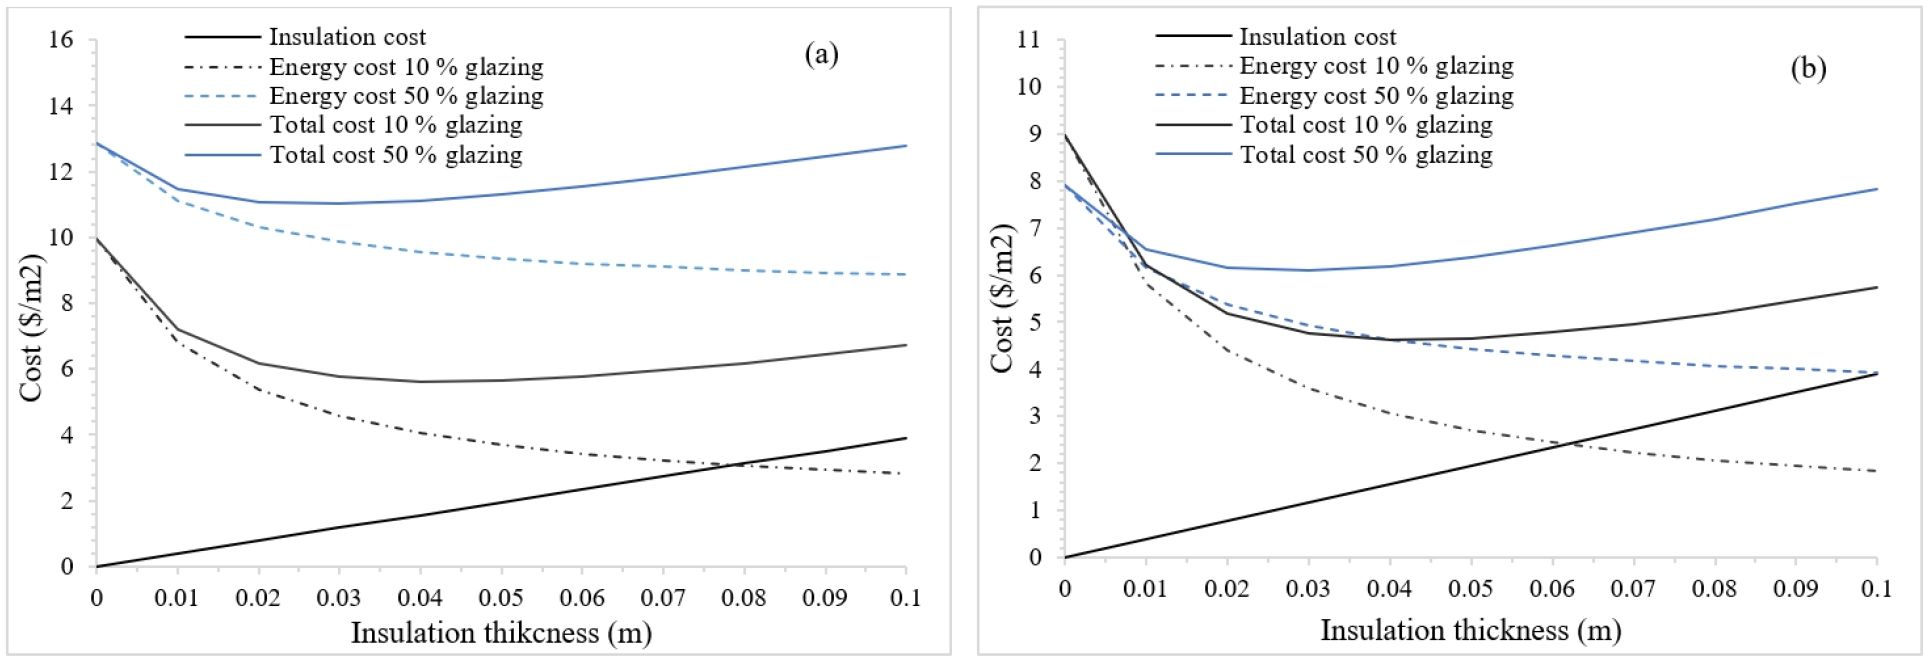
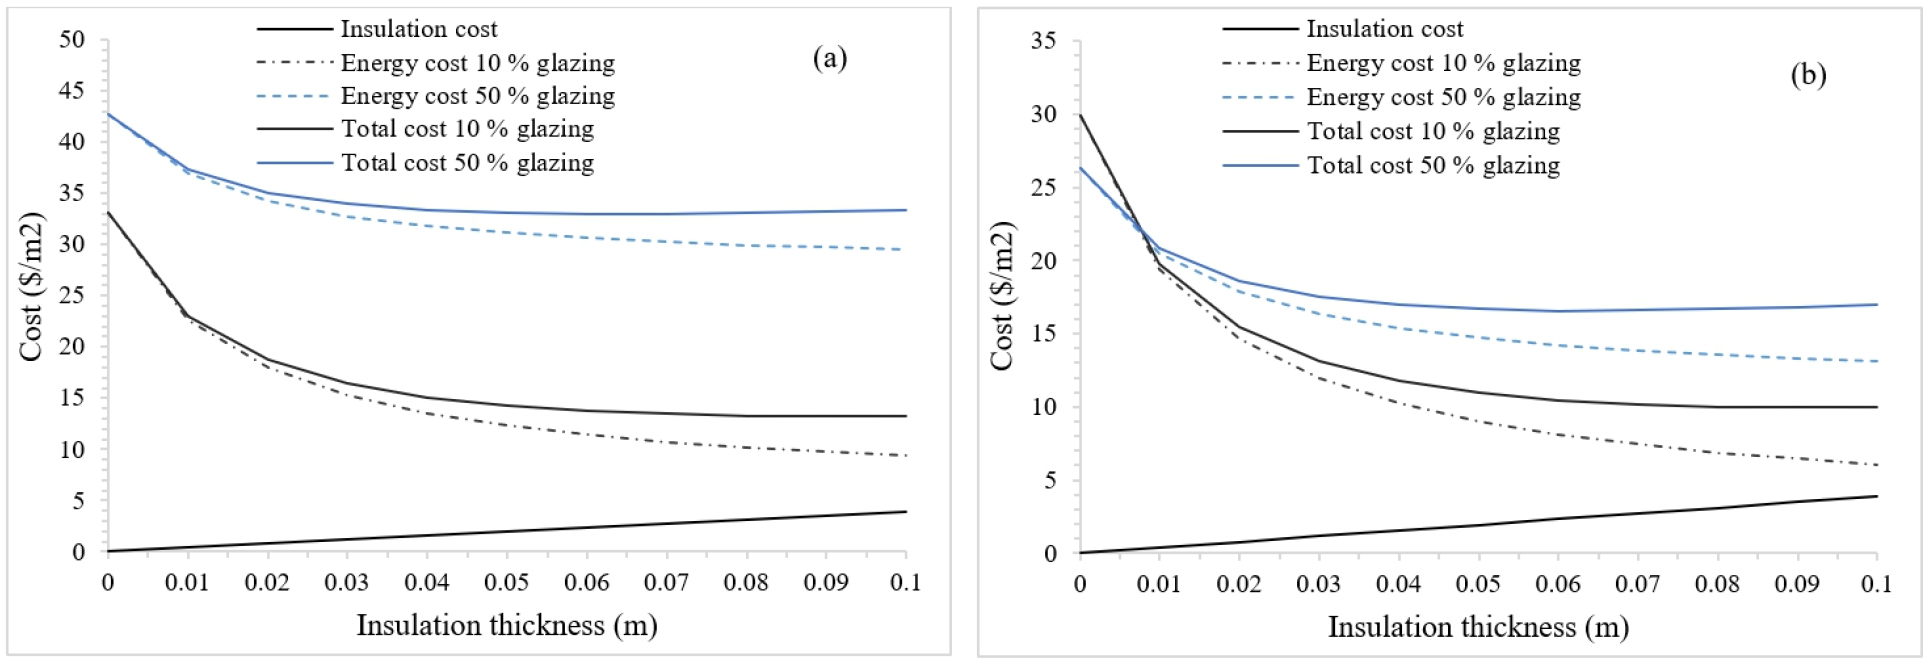
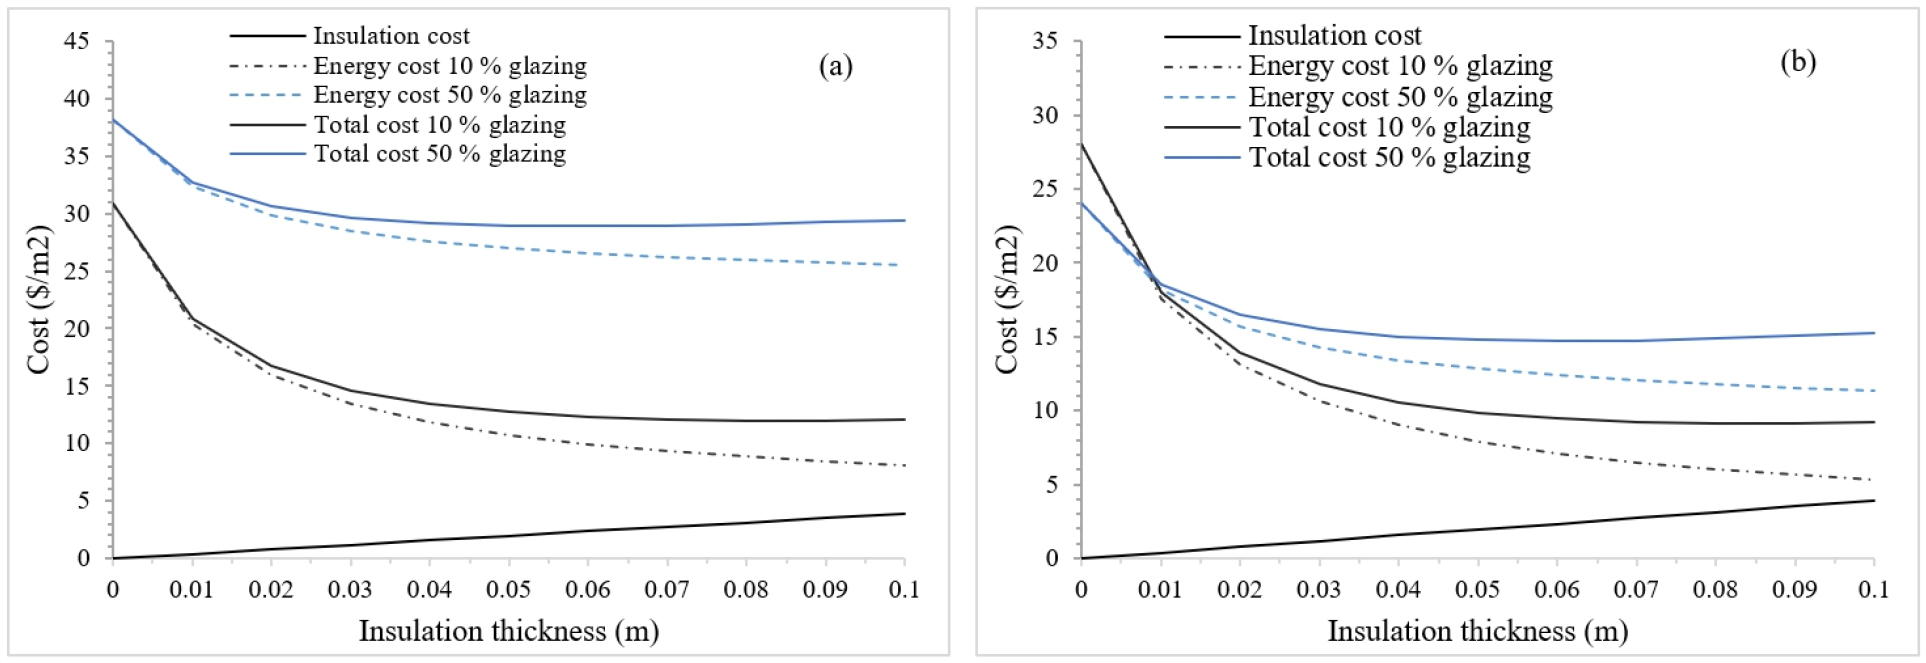
Figures 4, 5, 6 show the effect of varying the thickness of expanded polystyrene in a concrete wall on the heating energy and total costs of natural gas, butane gas and electricity for a GAP of 10% and 50% with simple and double-glazing. These figures are the city of Tiaret, located in one of the coldest regions of Algeria. As the thickness of the insulation increases, its cost increases linearly. In the city of Tiaret, for the use of natural gas, the initial cost is 9.96 ($/m2) for a 10% GAP of single glazing, while for butane gas the initial cost reaches 33.15 ($/m2) and 44.76 ($/m2) for electricity. The glazed area in a wall without insulation will cause an additional load, for single glazing this additional load will increase as the GAP increases and therefore will rises the initial cost, which is the cost before insulating the wall. While for a double glazing when the GAP rises from 10% to 50% the initial costs decrease slightly but by increasing the thickness of the insulation the decrease in total cost is greater for a 10% GAP.
Figure 7 show the evolution of the electricity cost and total cost of cooling according to the increasing insulation thickness for the city of Biskra, one of the hottest cities. For the case of cooling, the same behaviour as for the city of Tiaret is observed in the city of Biskra, when the GAP increases the initial costs rise for simple glazing and decreases for double-glazing. Figure 7(a) show that with a GAP of 10% of a single glazing the energy costs will decrease significantly for thicknesses between 0 and 4 cm. While with 50% of glazed area this reduction is much less than the reduction generated by a 10% GAP, this can be seen in Figures 4(a)-6(a) for natural gas, butane gas and electricity. The curve of the total cost decreases as a function of the insulation thickness down to its lowest point and then increases again, this point is the minimum total cost and by projection the optimal insulation thickness. It can be seen that the energy source used for heating and cooling will influence the savings induced by the insulation as well as the initial costs, and this is essentially related to the cost of energy. (Table 4) summarizes the optimal thicknesses calculated using the modified equations (10), (11), (12) resulting from the optimisation carried with the life cycle cost analysis. These thicknesses are identified for a seasonal and annual energy consumption of all the climatic regions of Algeria by considering several percentages of glazings, i.e. 0%, 10%, 30%, 50% combined with the energy sources availbale in the local market, i.e. the use of natural gas, butane gas and electricity for heating with the use of electricity for cooling. The heating and cooling degree-days affect considerably the optimal thicknesses of polystyrene, the higher the number of degree-days, the greater the thickness. It can be seen that by increasing the GAP, the optimal thicknesses are reduced for either heating or cooling or both, these thicknesses are greater for walls that do not contain a glazed areas. The highest thicknesses of expanded polystyrene are for the Tiaret city, which represents the coldest region if we consider only the heating period, with electricity as an energy source. The thicknesses are the highest whether for an annual or seasonal calculation and they vary from 7.7 cm to 12.6 cm for a gap of 0% to 50%. While for the hottest regions represented by the cities of Tamanrasset, Ghardaïa and Biskra, the highest thicknesses are for electricity considering only the summer season and they range from 5.1 cm to 9.1 cm depending on the city and the proportion of the glazed area. Assuming the heating and cooling period in the optimization leads to higher thicknesses with a decrease caused by the increase of the GAP less important compared to a seasonal optimization. The low price of natural gas results in lower thicknesses compared to other energy sources, while the expensive electricity leads to high thicknesses. It is seen that the smallest thicknesses are for the cities located in the north of the country near the Mediterranean sea, these results are similar to those found by [14, 15, 16], considering the effect of glazed area percentage on the optimal insulation thickness for heating only or for cooling only, leading to lower thicknesses and consequently lower savings. While an annual evaluation leads to higher optimal thicknesses and thus better savings.
Table 4.
Optimal thicknesses of EPS for seasonal and annual assesment with regard to the energy source and the GAP for all climatic zones
In (Table 5), the optimal thermal resistance is summerize for each climatic region as a function of the energy combination and percentage of glazed area, considering the heating and cooling season. These resistances are calculated with the optimum thickneses of expanded polystirene evaluated using the mathematical expression developed in the life cycle cost analysis that integrates the proportion of glazed area of the wall. For each city, the highest optimal resistances are for a wall without windows, these optimal resistances vary according to location and energy mix from 1.55 to 3.1 (m2.°C/W). It appears that the optimal thermal resistance of the concrete wall decreases when the GAP increases, this decrease is about 5.1% for a GAP of 10%, 16.3% and 29.3% for a GAP of 30% and 50%. For each location, the use of electricity for heating and cooling lead to higher thermals resistances compared to the other combinaison, while the lowest values correspond to the energy mix natural gas and electricity. The lowest OTR are for the city of Algiers heated with natural gas and conditioned with electricity. The highest optimal resistances are for the city of Tiaret heated and conditioned with electricity followed by a wall located in the city of Biskra heated with natural gas and butane gas. These results are directly affected by the variation of the optimal insulation thikness wich depend mainly on the number of degrees days for heating and cooling season, the type of fuels and the GAP of the wall. [37] stated that the optimal insulation thickness was impacted by 34.53% by the heating and cooling degrees days and 24.18% by fuel type, but the influence of glazing was not included.
Table 5.
Optimal Thermal Resistance of the concrete wall according to climatic region, fuels types and glazing percentage (0%, 10%, 30%, 50%)
The annual costs savings for the three combinaisons of energy sources and the increasing GAP generated by applying the optimal EPS thickness for each city studied is shown in Figures 8(a-g). The cost saving varies according to the climatic zone, the percentage of glazing and the energy source. The lowest cost savings are for the cities of Algiers and Chlef located in the north of the country. For the city of Algiers with a GAP of 10%, the savings are 6.74, 16.8, 22.08 ($/m2.yr) and for a GAP of 50%, the economy is 3.03, 8.15, 10.9 ($/m2.yr) respectively for natural gas, butane gas and electricity for heating associated with electricity for cooling. The cities of Constantine and Tiaret with the higher annual heating consumption represent the coldest regions. However, the savings for the city of Tiaret when natural gas is used remains very small with 9.73 ($/m2.yr) for a GAP of 10% and 4.53 ($/m2.yr) for a GAP of 50%. While for electricity, the saving is the greatest with a value of 34.33, 17.35 ($/m2.yr) for a GAP of 10% and 50%. The hottest regions are represented by the cities of Tamanrasset, Ghardaïa and Biskra, with electricity as energy source, the largest economy for the hottest regions concerns the city of Biskra with 32.35, 16.35 ($/m2.yr) respectively for a GAP of 10% and 50%. It can be seen that the increase of the GAP in the wall leads to a decrease of the economy, between a GAP of 10% and 50% the value of the economy is divided approximately by two. For all the studied regions, the saving rise with the increase of polystirene thicknesses until they reach their maximum values at the optimum thickness of insulation. However, the saving decrease when the GAP increase caused by the decrease of the optimum thickneses. These results are in agreement with those found by [16, 38], which showed that optimal insulation thicknesses are small due to low fuel costs. In fact [25, 39, 40] showed that the higher the cost of energy, the greater the savings achieved through insulation.
The combination of natural gas and electricity for heating and cooling applied to different climatic regions, results in the lowest annual savings and decreases by increasing the percentage of glazing of the wall, this is clearly due to the price of natural gas which is low. It is seen that the use of electricity for heating and cooling generates the highest savings, however, by increasing the glazed area the decrease in savings is greater than for other combinations. In spite of the higher saving for the use of electricity, the final total cost will be much higher than the combination of natural gas or butane gas with electricity for cooling.
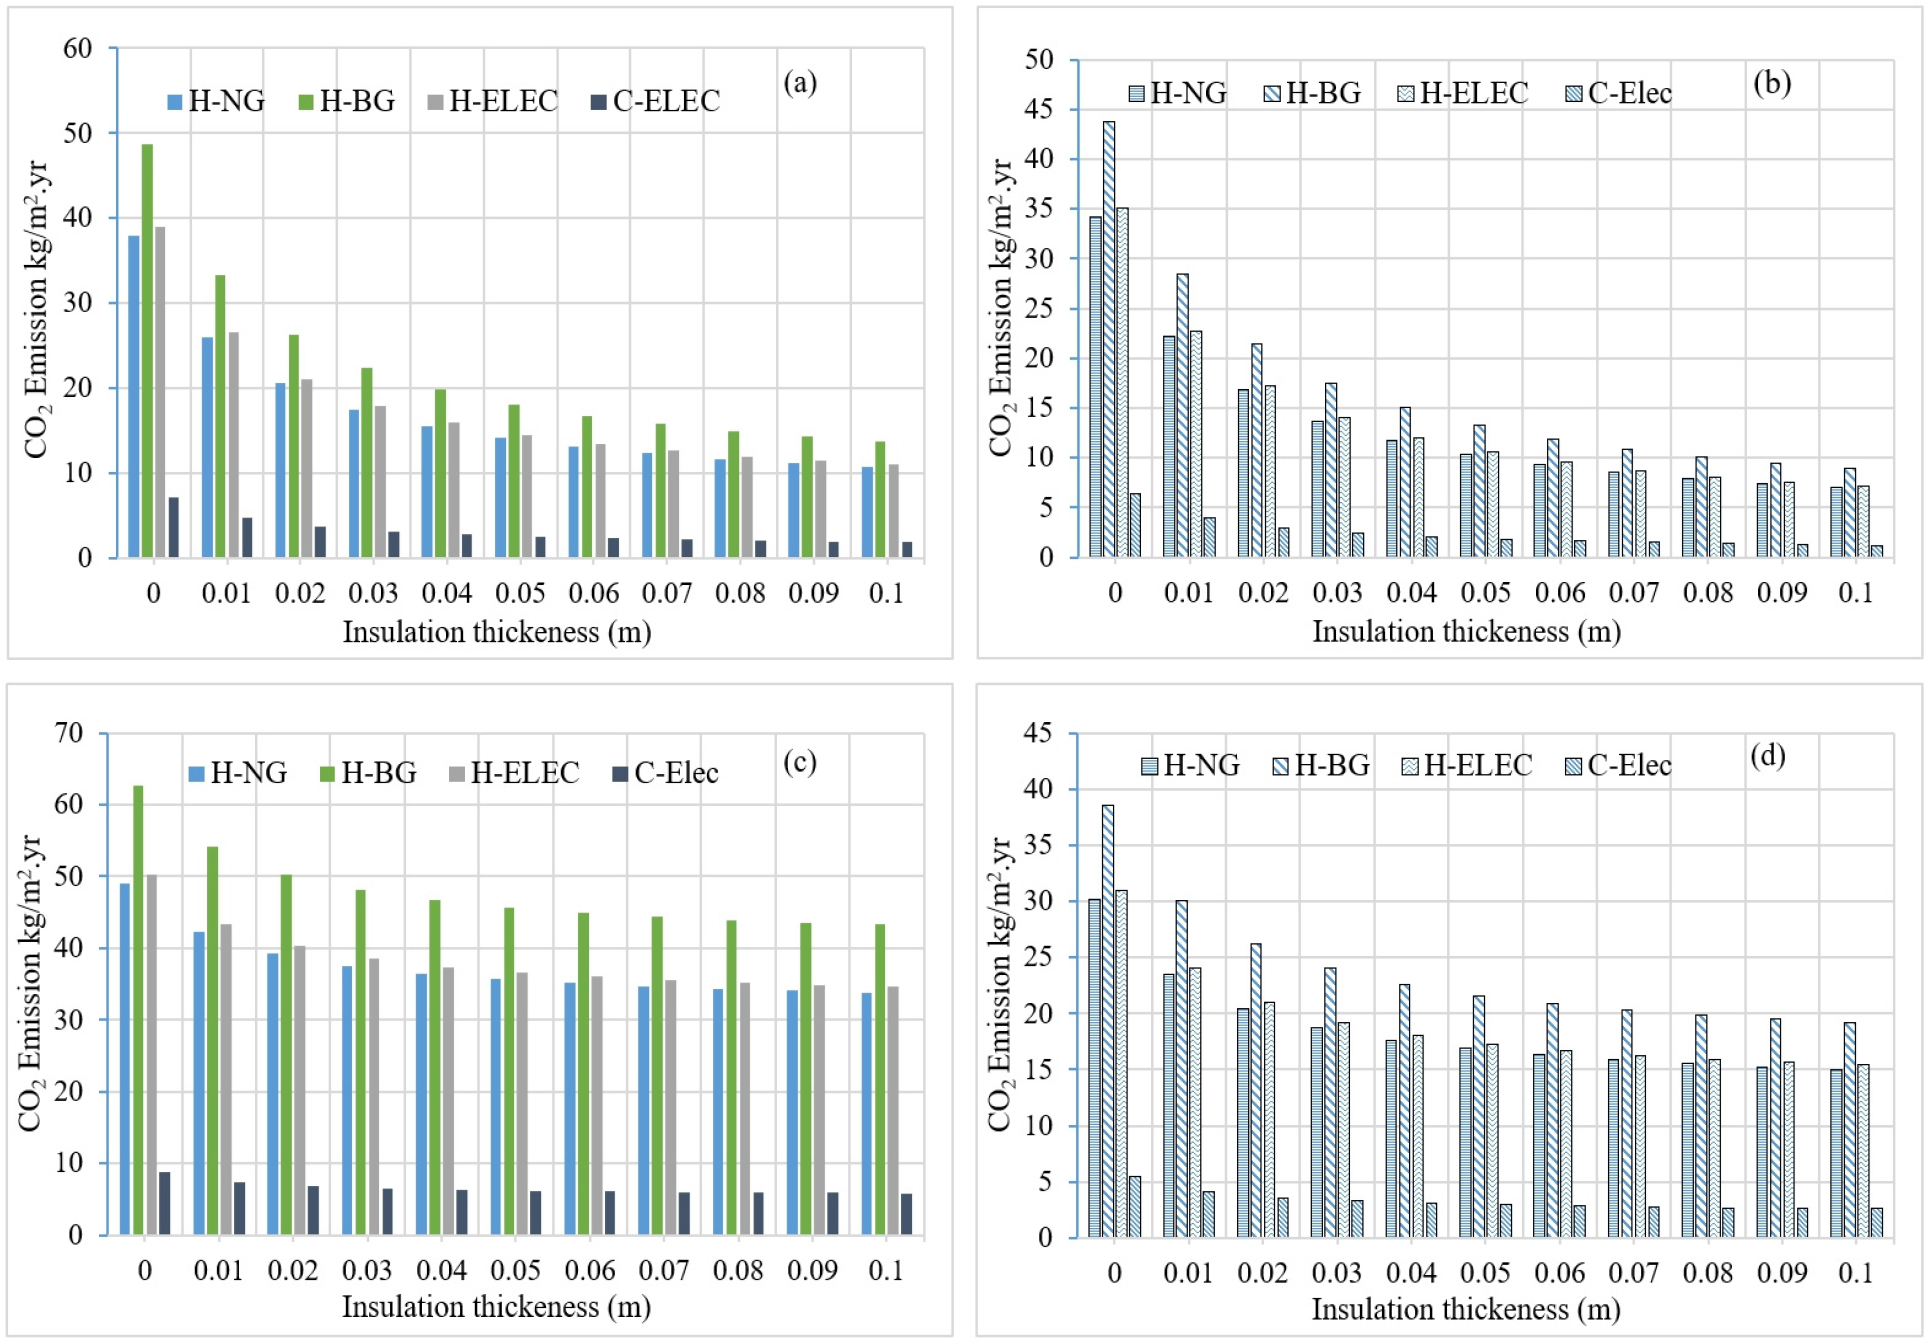
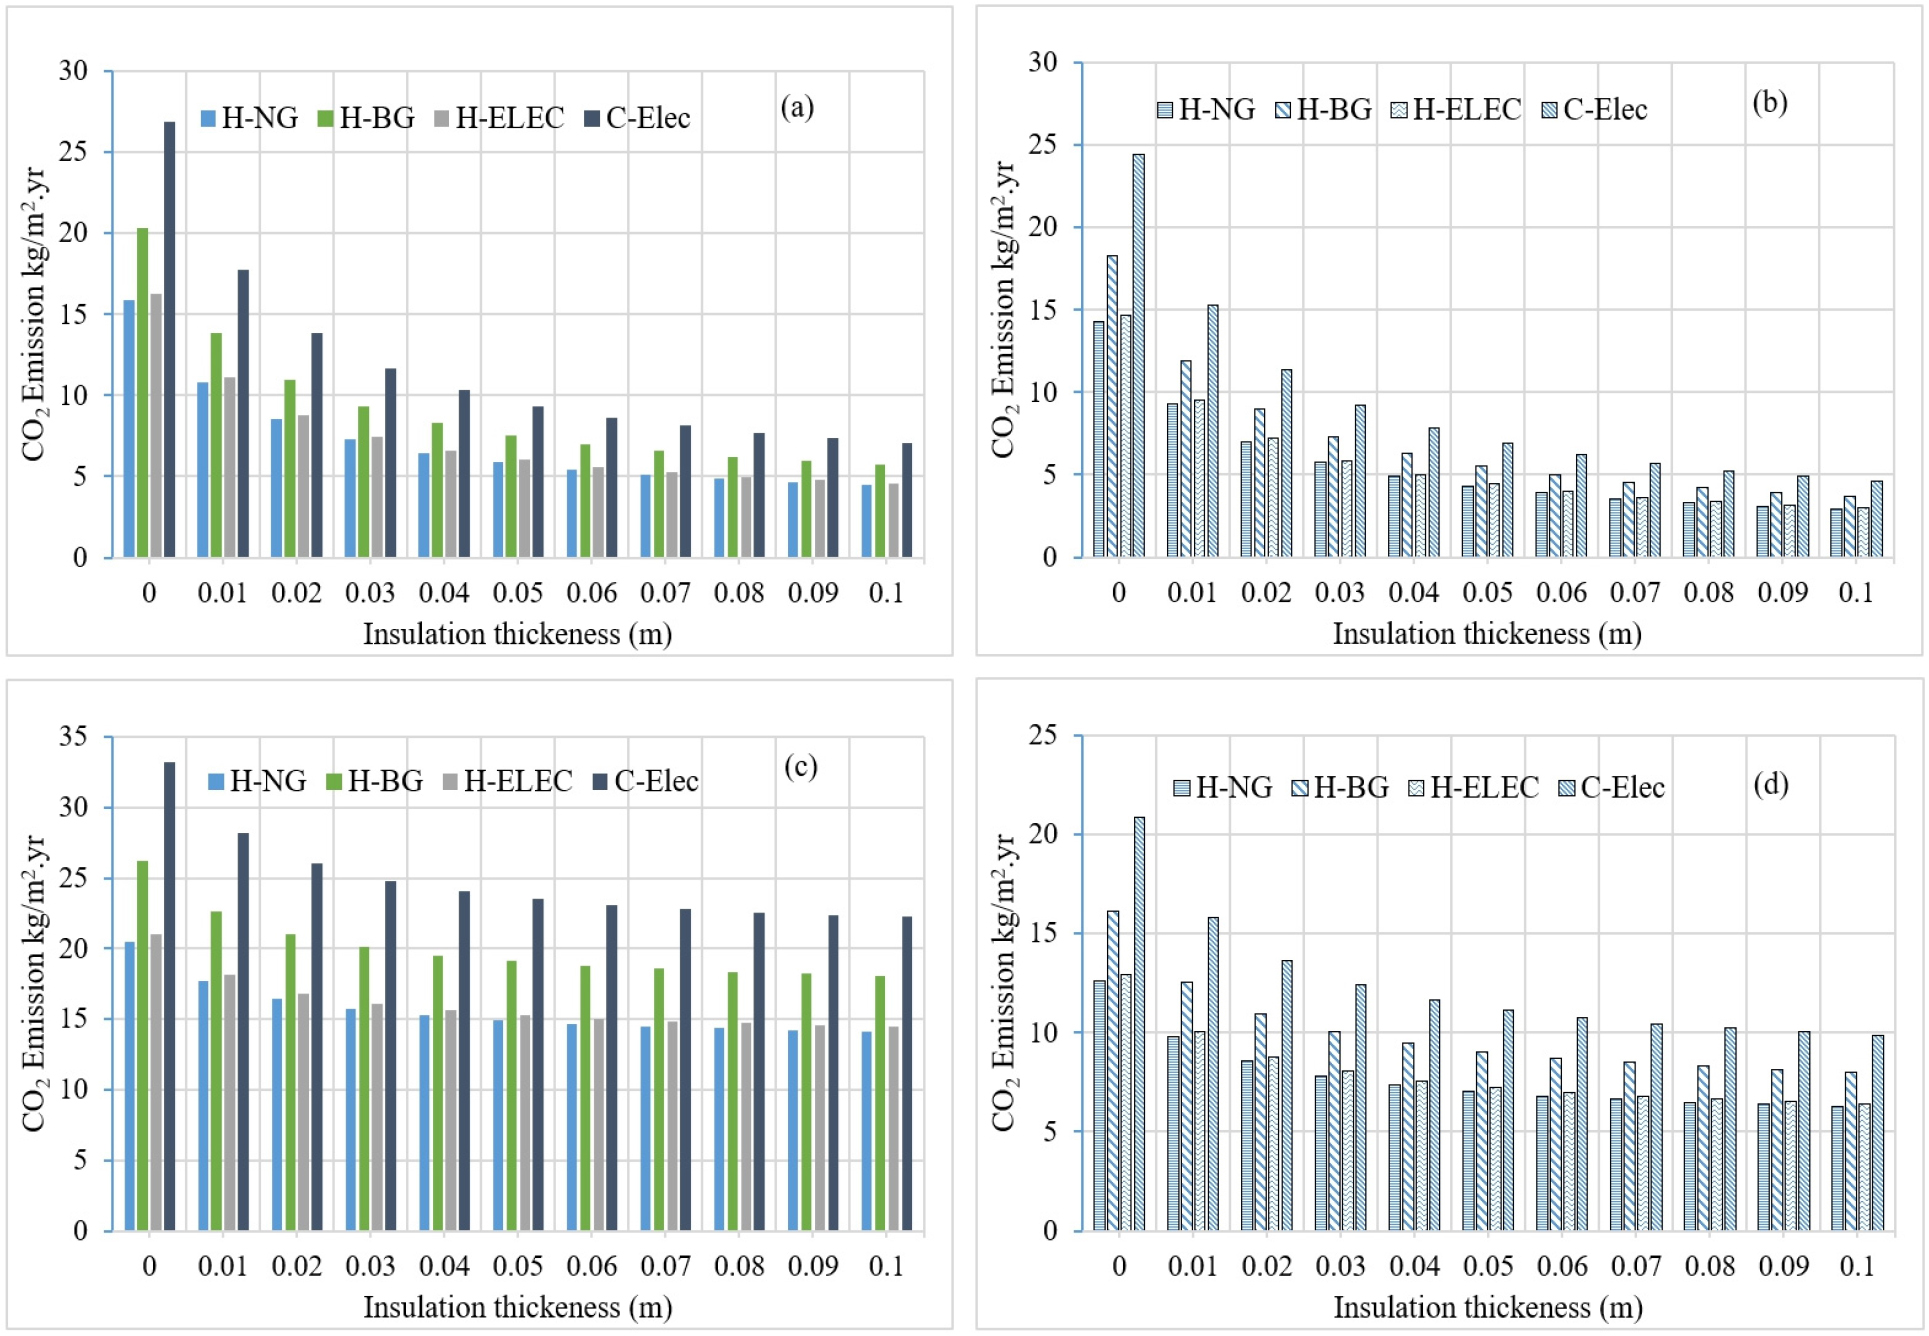
The installation of an insulation layer will reduce the transmission loads and thus reduce energy consumption, which affects the carbon dioxide released from the direct combustion of fuels. In CO2 emissions assessment, heating and cooling periods are considered and two types of glazing with a GAP of 10% and 50%. Figures 9(a-d) and 10(a-d) show the resulting CO2 emissions of fuels combustion as a function of the increased thickness of expanded polystyrene for walls located in the cities of Tiaret and Biskra. As a reference, a concrete wall without insulation, in this case, rises the GAP from 10% to 50% for single glazing and causes 28.89% increase in CO2 emissions while double-glazing provides a decrease of 11.89%. It appears that increasing the thickness of the insulation layer will decrease the emissions rates of carbon dioxide; this reduction is more significant for a GAP of 10% or less. It is seen that applying a single glazing with a GAP of 50% leads to much more emissions rate than for a GAP of 10%, and the insulation becomes less efficient. For a wall with double-glazing window, the same behavior as with a single glazing is observed but with better performance.
The city of Tiaret has 2503 heating degrees days, this implies a high fuel consumption for heating. Figures 10(a-d) shows that whatever the thickness of the insulation or type of glazing, butane gas remains the most polluting fuel. The CO2 emissions resulting from the combustion of natural gas and the production of electricity seem to be close to the lowest for natural gas; this is mainly due to the performance of the electric heating system. For the hottest city of Biskra with 1603 cooling degrees days shown in Figures 9(a-d), it is clear that the cooling energy consumption generates the highest carbon dioxide emissions in the same region.
In previous research, the optimization of the insulation layer was done for exteriors walls without windows. Indeed, the environmental benefit of the installation of an insulation layer is clearly demonstrated and can be seen in the first lines of Tables 6, 7, 8, these results are close to those found by [26] with a reduction that reaches 80% at the optimum thickness. The improved mathematical expression of the optimization procedure makes it possible to calculate the optimal thickness of an insulator as a function of the glazed area of the wall. In order to assess and compare the variations of the CO2 emission rates for the seven cities studied, an uninsulated concrete wall without glazing is taken as reference. (Table 6) show the resulting CO2 emissions from electricity consumption during the summer season, it is seen that the hottest cities have the highest carbon emission but also haves the highest reduction considering only the cooling season. Increasing the GAP for single glazing until 50%, show results close to the reference case and therefore there is no more benefit from an environmental point of view. For a double glazing window, a GAP of 50% rises the emissions rates for all the cities but lead to a reduction more than half for the cities of Biskra, Ghardaïa and Tamanrasset compared to the reference cases. (Table 7) summarizes the amount of carbon dioxide released during the winter season by the combustion of natural gas, butane gas and the production of electricity consumed. For each city, the optimal reduction of carbon dioxide emissions is for the case of an insulated concrete wall with a GAP of 0%. It appears for the reference case that the use of natural gas as fuel leads to the lowest emissions rate compared to butane gas and electricity, but has the least reduction of CO2 emissions at the optimum thicknesses of polystyrene. The city of Tiaret has the greatest reduction and reaches 87.53% for the use of electricity for heating, for the other cities, the reduction potential is slightly lower than for the city of Tiaret and corresponds to a wall without window. Increasing the GAP affects the reduction potential of the insulation layer, as it seen in Table 6 for a GAP of 50% with single glazing; the resulting emissions are close to the corresponding reference case. In the case of a wall with a GAP of 10%, it seems that for single glazing the reduction with natural gas ranges from 50% to 58% and from 65% to 70% with butane gas and electricity for the cities located in north and for the coldest regions. For the hottest regions, this reduction range from 37% to 44% with natural gas and 57% to 64% with butane gas and electricity.
Table 6.
CO2 Emissions (Kg/m2.yr) for cooling season at the optimal thickness of polystyrene with electricity as an energy source
Table 7.
CO2 Emissions (Kg/m2.yr) for heating season at the optimal thickness of polystyrene with natural gas, butane gas and electricity as an energy sources
In (Table 8), the heating and cooling season are considered for annual assessment of carbon dioxide emissions. It is seen that the combination of butane gas and electricity is globally the most polluting one when the GAP increases for simple and double-glazing. Some exceptions appear in the case of a 10% double glazing area for cities located in the north of the country and for the coldest ones. The use of electricity for heating and cooling lead to the minimum CO2 emissions and they are close to those of natural gas combined with electricity, those results are related directly to performance of the heating system, with a COP equal to 2.5 for electric heating. The use of natural gas and electricity have the smallest reduction of the CO2 emissions because of the corresponding optimal insulation thickness that are lower than for the others cases. The difference in the environmental impact between simple and double-glazing appears when the GAP increases from 10% to 50%. It is seen that for simple glazing the carbon dioxide emissions increase rapidly when the GAP up to 30%, while for a double-glazing with a GAP of 50% the environmental impact is lower than for a single glazing with a GAP of 30%.
Table 8.
Annual CO2 Emissions (Kg/m2.yr) for heating and cooling season at the optimal thicknesses of polystyrene
The increase in glazed area leads to a significant increase in Co2 emissions. For a 50% GAP of a double-glazing, the increase corresponds to a little bit more than twice the emissions generated by a 10% GAP, while for a 50% GAP of a single glazing the emissions are three times higher than for a 10% GAP. The author [17] also stated that the increase in the glazing area percentage would increase the emissions rate with and without insulation in the case of heating with natural gas, it appears in this study that electricity is the least polluting followed by natural gas and butane gas in the case of an insulated wall with glazed areas.
Conclusion
In this study, we evaluated the impact of the glazed areas and energy sources on the optimal thicknesses of expanded polystyrene and on the resulting CO2 emissions. For seven cities representing the climatic regions of the country, the optimal thicknesses of the insulating layer were determined for a concrete wall based on the percentage of glazing ranging from 0% to 50% and energy sources (natural gas, butane gas and electricity). To do so, the mathematical expression of the economic model based on the life cycle cost analysis is improved in order to take into account the percentage of glazing in the wall, cost saving is also evaluated during the life time of the building according to the percentage of glazing and the energy sources available in the local market.
It is clear that the application of an insulation layer increases the thermal resistance of the wall, therefore will reduce the transmission loads, and thus reduces energy consumption; this reduction is faster for small thicknesses from one to 4 cm. The climatic region has a strong influence on the optimal thickness of the insulation, when the number of degree-days increases, for both heating and cooling the optimal thickness will increase. While the increase of the glazed area will decrease the optimal thickness and rise the initial cost for a single glazing but will have a slightly decrease for a double-glazing. An annual evaluation of the optimal thicknesses will result in greater thicknesses than for a seasonal evaluation, and therefore better savings.
Without insulation, the application of double-glazing slightly reduces CO2 emissions by increasing the GAP. Whereas single glazing increases CO2 emissions, which are more consequent for 50% of the glazed to total wall area. For single glazing, the emissions are highest for the combination of butane gas and electricity regardless to the climatic region. With double-glazing, butane gas is slightly higher for the warmest climate regions. While for other climate regions, the combination of natural gas and electricity lead to the lowest reduction of CO2 emissions. By increasing the glazed area to 50%, the combination of butane gas and electricity becomes the most polluting for both single and double-glazing at the optimum insulation thickness.
From an economic point of view, with the optimum thicknesses of polystyrene, electricity offers the best reduction of costs and CO2 emissions reduction, except that the final cost will be much higher than that of natural gas, which remains the lowest. On the environmental side, the emissions resulting from the use of natural gas and electricity for heating and cooling are still higher than the emissions released by the exclusive use of electricity, but the trend is closer for a GAP of 50%. If we focus on the economic aspect, natural gas and electricity associated with the optimal thickness will have a lower total final cost and savings than other combinations. If we consider the environmental aspect, the use of electricity for heating and cooling combined with the optimal thickness of the expanded polystyrene generates the minimum CO2 emissions and the higher reduction.
The results of this study will be useful according to the national program [41] that aims to introduce insulation in the new buildings and refurbishment of the old one. In addition to the economic benefit of the insulation, the CO2 emissions are considerably reduced and this implies taking care of the environmental impact of the buildings. This research will continue with the introduction of other types of insulation and other wall configurations as well as the detailed exploration of the impact of the type of glazing in the improved life cycle analysis with a dynamic approach for more precision.
Nomenclature
Rwt: Thermal resistance of non-insulated wall (m2.C/W).
Rx: Thermal resistance of the insulation layer (m2. °C/W).
λi: Thermal conductivity of insulation (W/m. °C).
N: Lifetime of building (years).
U: Total heat transfer coefficient (W/m2. °C).
δ: Glazing area percentage (GAP).
η: Heating system efficiency.
Hu: Lower heating value of the fuel (MJ/m3).
r: Effective interest rate (%).
t: Time (s).
CF: Cost of fuel ($/m3).
CE: Cost of electricity ($/kWh).
Ci: Cost of insulation material per unit volume ($/m3).
CA: Yearly total cost of energy ($/m2.year).
T: Temperature (C°).
HDD: Heating degree-days (°C. days).
CDD: Cooling degree-days (°C. days).
PWF: Present worth factor.
COP: Coefficient of performance of air-conditioning system
LPG: Liquefied Petroleum Gas.
EPS: Expanded polystyrene.
C: Cooling.
H: Heating.
Opt: Optimum.
A: Annual.


