

Introduction
Methodology
Experiments and Implement
Experimental environment
Data collection
Data analysis
Results
Conclusion
Introduction
The recent gradual improvement in living standards has led to a growing demand for the comfort of occupants living in homes and general buildings [1]. In addition, the importance of energy conservation is increasing not only domestically but also globally [2], and there is a growing demand for energy conservation in large office buildings and workplaces these days when energy conservation has become a hot topic in the country since 2020 when the mandatory implementation of zero-energy buildings in public buildings and around the world [3].
Furthermore, People spend approximately 89% of their time in a day indoors. [4], and as more time is spent indoors, the desire for a pleasant environment is gradually increasing [5]. However, studies have been conducted on indoor thermal comfort, such as not simply adjusting the temperature and humidity of the room, but also controlling the temperature according to the room’s environment to find a thermal comfort range suitable for the room’s environment [6, 7].
However, there is a difference between the thermal comfort that the actual residents feel and the thermal comfort index made by Fanger and the currently most widely used thermal comfort index, the Predicted Mean Vote (PMV) [8] model [9, 10, 11]. Wei Zhang evaluated thermal comfort using a deep neural network (DNN), and the DNN model showed more accurate prediction results than the existing machine learning model [12]. For more accurate results, Zhibin Wu predicted the thermal comfort of occupants in buildings using ensemble in the existing machine learning methodology [13] Guanyu Gao adopted a deep neural network-based approach to predict thermal comfort. In order to learn the next thermal control policy, it was evaluated using Deep Deterministic Policy Gradients (DDPG) [14]. Furthermore, the previous studies presented that the thermal comfort sensation felt differently between changes in certain temperatures at warm and cold temperatures, and this could be also expressed through time series data and there was no reflection of these changes. In addition, there have been no cases of studying thermal comfort for Koreans. Therefore, this paper utilizes data obtained from experiments on thermal comfort of residents in real-world buildings, and uses time series data to learn from LSTM deep learning models to propose a model that predicts more accurate heat comfort of the residents through comparative analysis of predicted values.
Methodology
The Long Short-Term Memory (LSTM) was used in this study is excellent in learning time patterns from Recurrent Neural Network (RNN) in case of time-series data such as text, signals, and stock prices, and LSTM solve the extinction slope problem of RNN By overcoming it, we learn the long-term dependency of time-series data using memory cells and gates [15, 16]. Through this, in the existing RNN model, when there is a large number of input data, the problem can be solved by using an LSTM model that solves a problem in which an error rapidly increases in the data processing. In addition, thermal comfort is affected by a large number of data, as the thermal comfort changes through continuous changes and trends, not instantaneous changes, as seen from the data analysis results. Therefore, LSTM is a more effective model for predicting thermal comfort than conventional RNN models. In the period of model learning, different result values are caused according to each Hyper Parameter setting [17]. Therefore, for a more accurate experiment, various Hyper Parameters were used, and at this time, Neural Network Intelligence (NNI) developed by Microsoft was used. NNI, short for Neural Network Intelligence, is a toolkit that helps users efficiently and automatically design and tune the parameters of machine learning models, neural network architectures, or complex systems. Therefore, it helps to find the optimal value using parameters in various environments. Experiments were measured by varying the Hyper Parameter using NNI. Dropout rate, LSTM hidden1, LSTM hidden2, LSTM hidden3, fc1_layer, fc2_layer, and learning rate were set as Hyper Parameter variables. Through this, it was used to derive the most optimal learning model through learning in various environments. After training was completed, models with low loss values for each experimental model were selected, and the accuracy of the model was analyzed by MAE (Mean Absolute Error), RMSE (Root Mean Squared Error), and MASE (Mean Absolute Squared Error) values.
MSE is the mean square error, that is a model evaluation method that takes the average of the square of the error, and is shown in (1). MSE is a simple evaluation method that can be intuitively understood and has a characteristic that the MSE value increases significantly when the difference between the predicted value and the actual value is large. MAE is a model evaluation method in which the difference between the actual value and the predicted value is converted into an absolute value and averaged. There is no distortion of the value, and intuitive understanding is possible, and is as shown in (2). Lastly, RMSE is an equation that applies a root in the MSE model. It is a model that minimizes the distortion caused by the square of the MSE. Compared to the MAE model, RMSE is less intuitive, but it is an evaluation index that shows strength in singular values. RMSE is the same as (3).
Experiments and Implement
Experimental environment
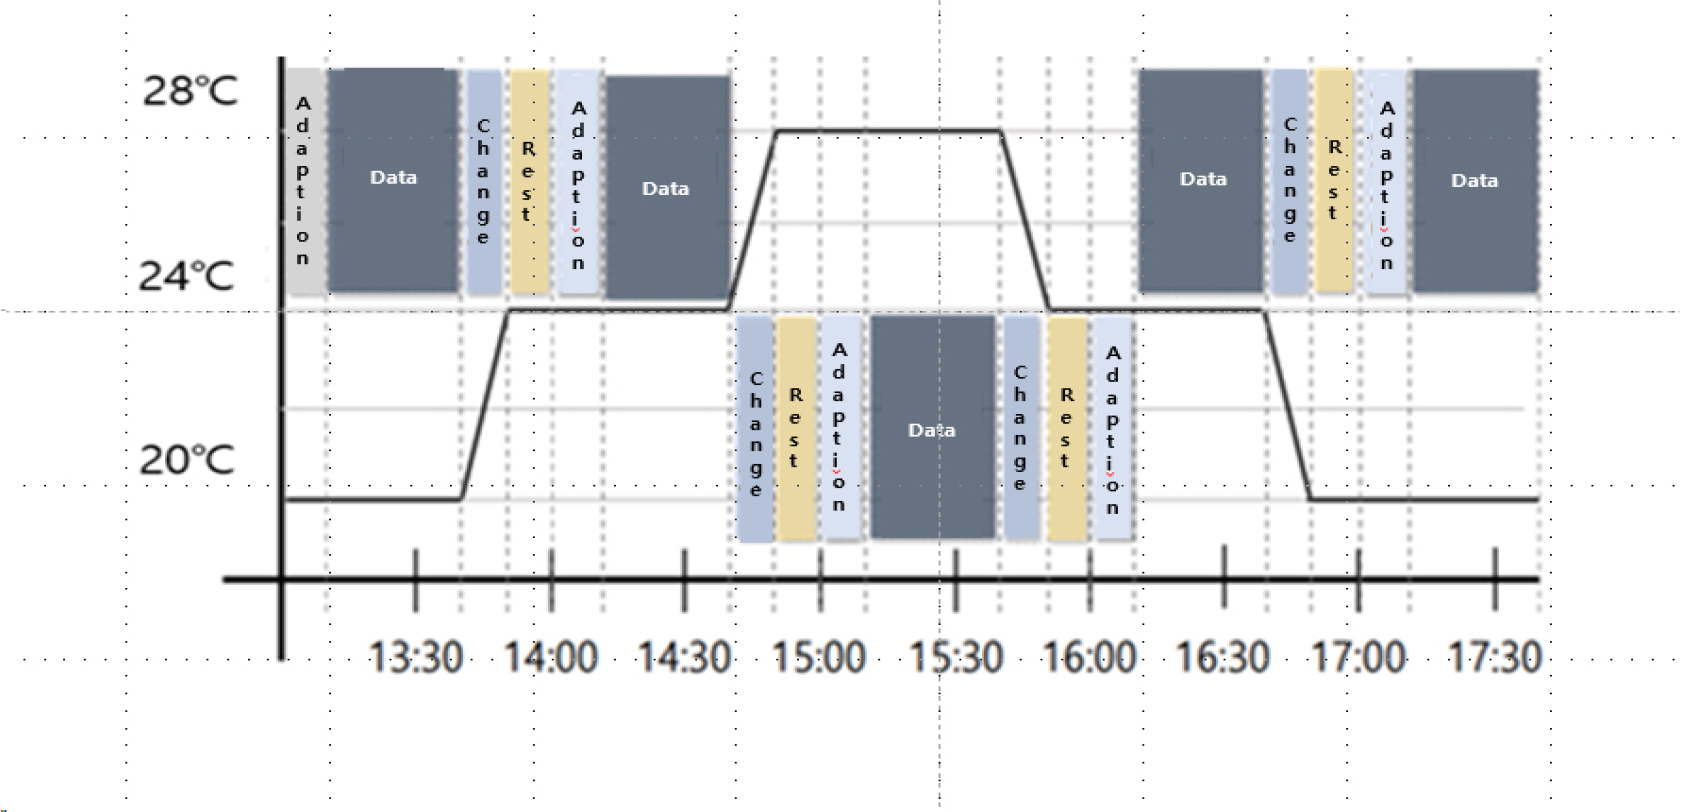
The experiment was conducted on a 22-year old adult, 164cm tall and 60kg in weight. The experiment was conducted for a total of 4 hours and 40 minutes within the temperature range of the laboratory from 20℃ to 28℃ which was shown in Figure 1. The experiment was carried out with the pattern of 10-minute temperature adaptation, 30-minute data collection, 10-minute temperature, and 10-minute rest. The setting of the environmental adaptation stage was set to prevent data noise due to differences from the existing environment by contacting the internal experiment environment from the participant’s external activities. It was set to prevent noise caused by internal environmental differences. In order to maintain constant conditions in the experiment, air circulators and humidifiers were installed to minimize the effects of temperature imbalance and humidity inside the laboratory. Radiant heat from external solar heat was minimized through blind installation.
Data collection
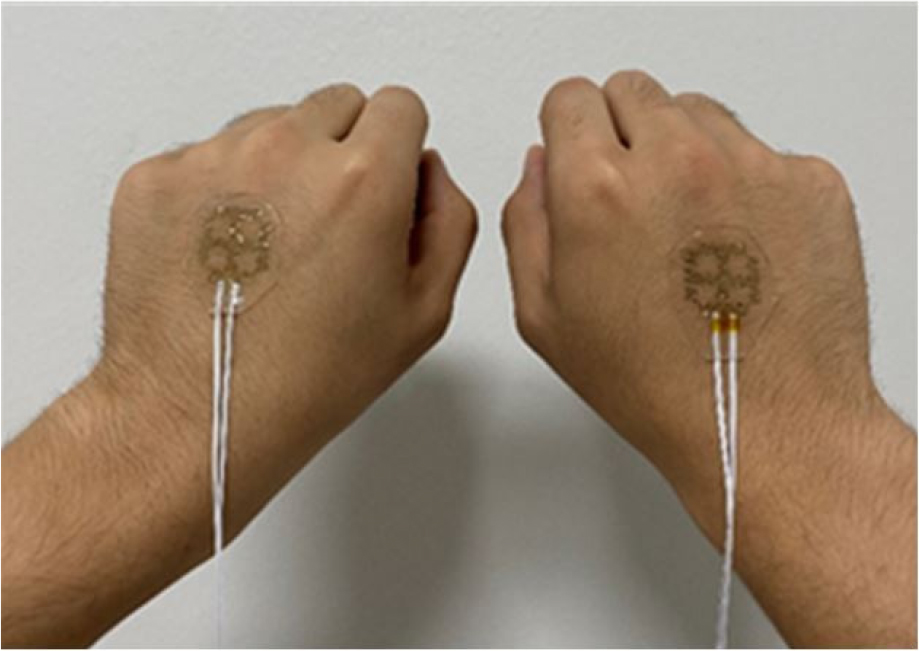
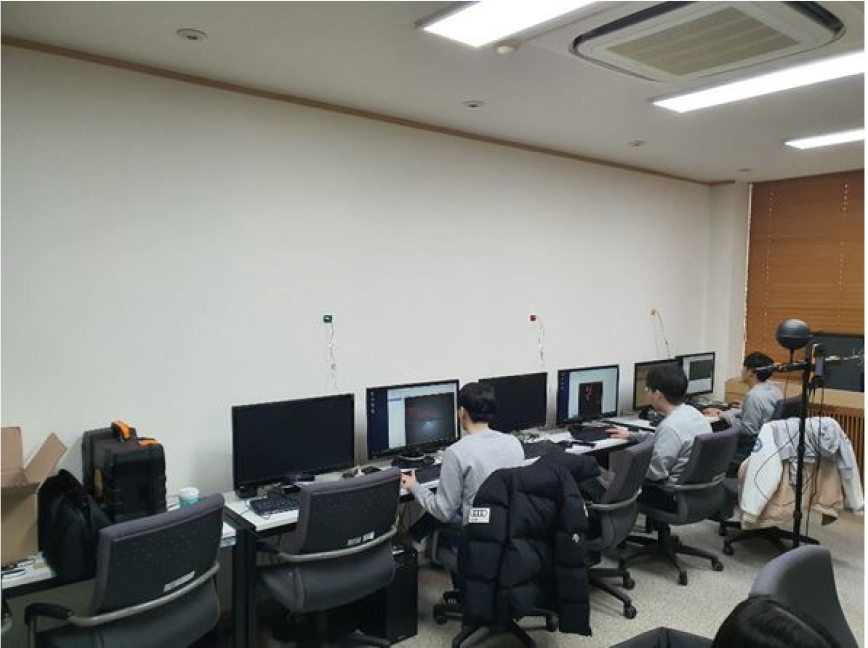
Using a flexible sensor, the temperature and humidity of each participant’s hand skin were measured, and the indoor temperature and humidity were also measured in the same way. In the case of hand skin temperature and humidity, one sensor was attached to each of the participant’s right and left hands, and the room temperature and humidity were measured based on the height of the participant’s face and desk. In addition, in order to know the actual thermal comfort that the participant feels, the thermal comfort that the actual participant’s feel was acquired through the program. First, sensors were attached to the participant’s right hand and left hand as shown in Figure 2, and the participant’s actual thermal comfort was measured and recorded every 5 minutes. The experiment was conducted in the environment shown in Figure 3. The collected temperature and humidity data are stored in a server through a cloud system so that data can be checked in real-time. The missing values of the data obtained based on the acquired data were compensated for the missing data by using the interpolation method.
Data analysis
Figure 4 is a graph of the participant’s day 1 data. There is a participant in the experiment space, and the temperature inside the laboratory was set up to 20℃ due to the participant’s heat, but it was difficult to control the temperature. Humidity tends to be the opposite of the temperature graph. When the temperature rises, the humidity falls, and when the temperature falls, the humidity rises. This is analyzed by the characteristics of the temperature control system inside the laboratory. The humidity of the hand skin is maintained in a certain period, and the phenomenon that the humidity data of the hand skin comes out high due to sweat and evaporation was recorded. In general, the subjective thermal comfort of the participant felt that it was cold for a while in the temperature setting range of 20℃ and warm in the range of 24℃ to 28℃. Finally, I felt comfortable from the 24℃ section to the 20℃ section. When comparing this with the temperature graph of the laboratory and the hand skin temperature graph, it is possible to confirm a situation in which the temperature is kept constant for some degree because the temperature is lower only in the first 20°C section and the temperature gradually rises in the rest section.
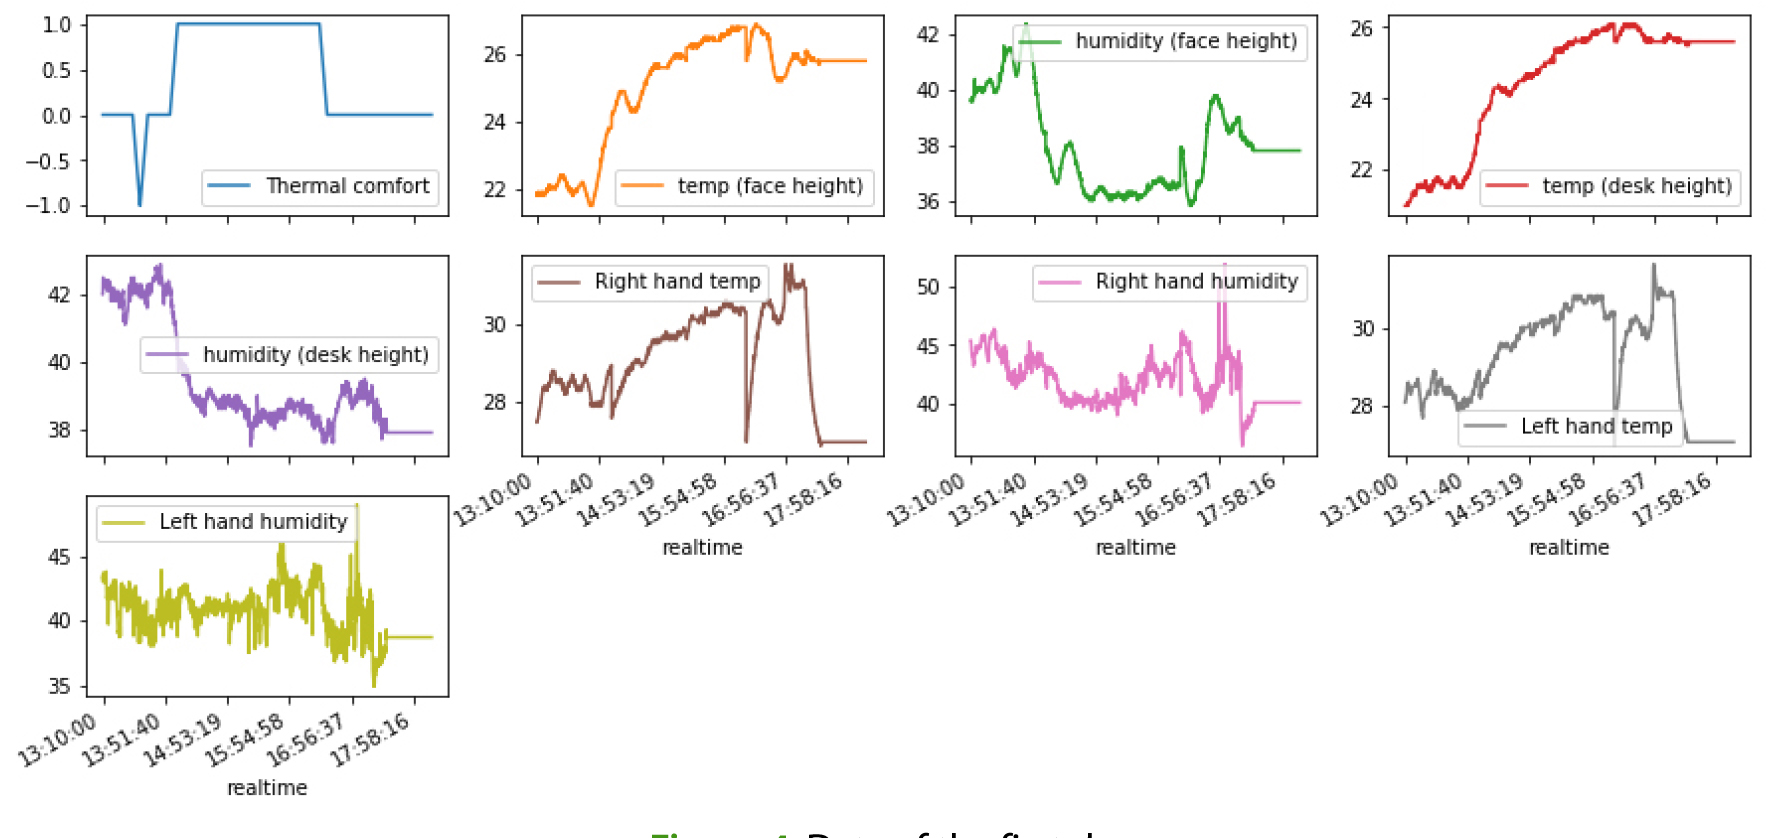
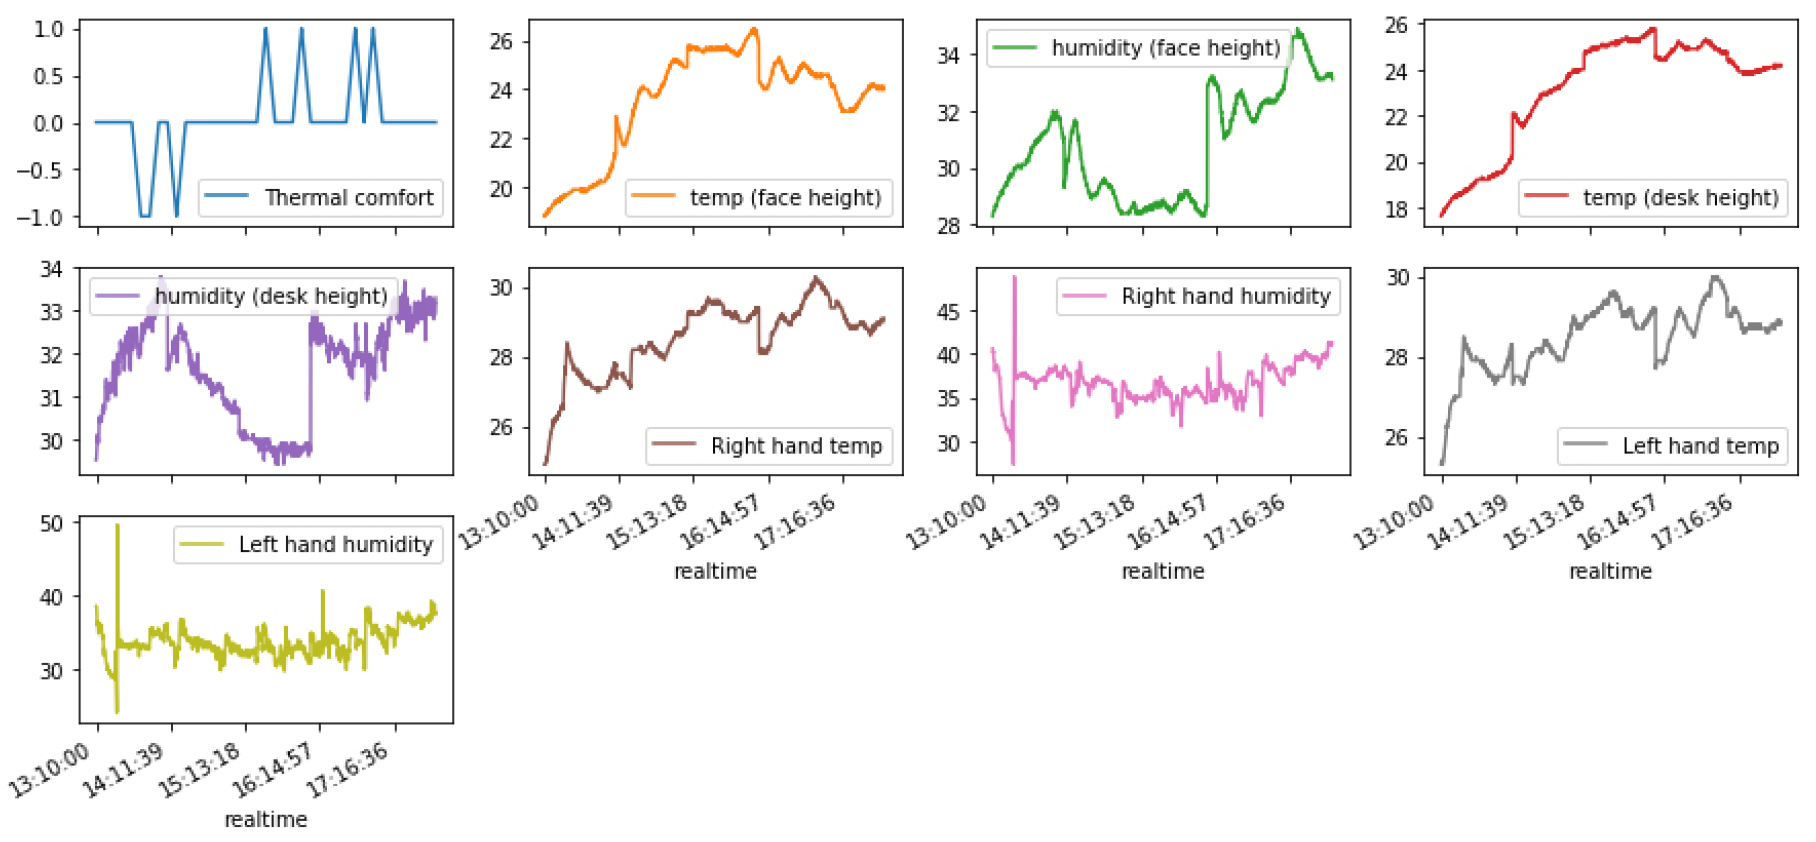
Figure 5 shows the participant’s data of the second day. First, the temperature changed inside the laboratory was changed from 20℃ to 28℃, but the participant’s thermal comfort felt cool in the first cold section (20℃) and the last cold section (20℃) and the participant first 24℃. The warmth was felt only in the hot section (28℃). Comparing this with the ambient temperature graph and the hand skin temperature graph, the ambient temperature first rose, and after that, it is maintained within a certain range, and the hand skin temperature was formed with an upward trend. The peculiarity here is that the temperature of the hand skin was formed higher than the other parts at the end of the experiment, but the actual tester’s thermal comfort felt cool. In this section, the temperature was high, but there is a part where the temperature gradually drops, so the participant’s thermal comfort was felt cool. It is analyzed that this not only affects the temperature increase or decrease but also the trend of temperature change.
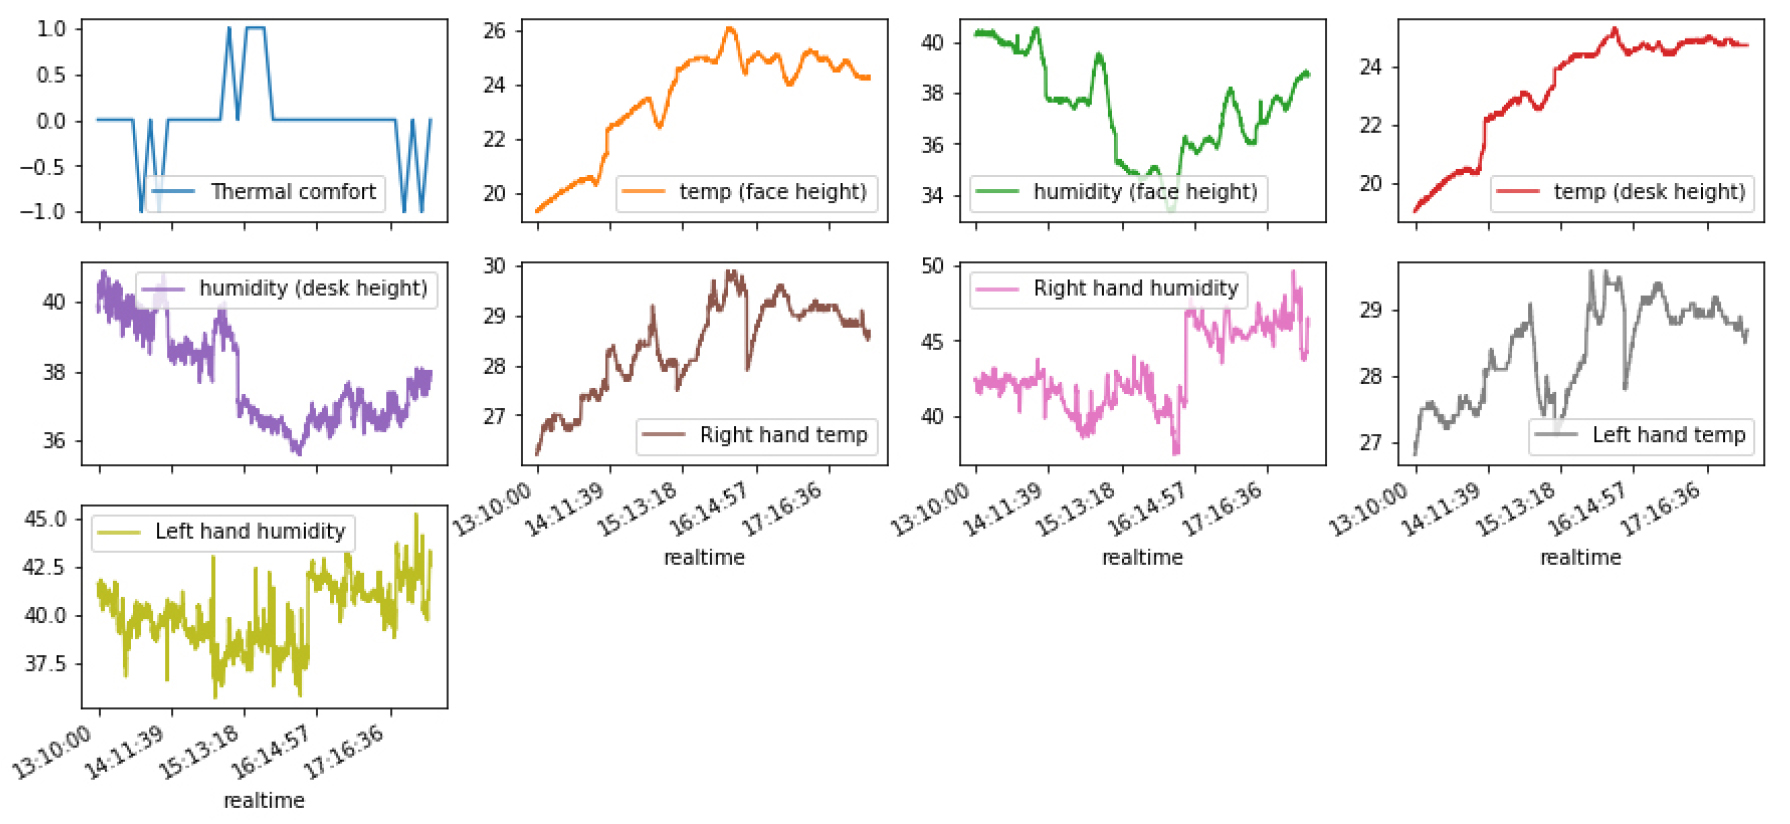
Figure 6 shows the participant’s data of the second day, which was cool in the first cold section (20℃) and warmth in the subsequent section. When analyzed in light of the trend of the hand skin temperature, the participant’s early hand skin temperature tended to rise, but the ambient temperature and the hand skin temperature are relatively low, so participant felt cold. The rest of the section also felt that the thermal comfort was warm according to the temperature rise and trend, and in the last part, participant felt cool according to the decreasing trend of temperature.
According to the result of the research and the great influence of temperature on the human thermal comfort, the study concluded that not only the absolute value of temperature, but also the trend of temperature created the thermal comfort affects. In this research, 70% of the data set was used to train the model, and the other 30% was employed as the testing data. Input data was learned from skin temperature, humidity data, ambient temperature, and humidity data of both hands, and the target was set as the actual thermal comfort of the participant. The LSTM model was used to predict the thermal comfort value of occupants. In the learning process, Min-Max was used for data normalization, and the corresponding equation is (4).
The LSTM model was implemented through the torch and learned with a computer with Intel Core i7-9700KF and RTX2080TI specifications and was conducted in CUDA version V10.0.130 and CUDNN version 7.6.5 environment.
Among the results of experiments with different hyper parameters set, 10 experimental models with a small loss value based on MSE (Mean Squared Error) were deduced, and the MAE (Mean Absolute Error), RMSE (Root Mean Squared Error), and MASE (Mean Absolute Squared Error) value. Was used to compare the model’s performance.
Results
Referring to the model performance table in Table 1, for the five models, the error in the predicted value of the actual thermal comfort and thermal comfort in the MAE index is within the range of 0.25 ~ 0.28 on average. The reason is the range of error in the result calculated by dividing the thermal comfort index from -3 to +3 by a 7-point scale is 0.25 to 0.28. Thus, the difference between the predicted result through the LSTM model and the actual result is very small. In addition, in the MSE index, there is no significant difference between the predicted value of 0.13 and the actual result. Lastly, in the RMSE index, the average error is within the range of 0.36 to 0.37, so the difference between the predicted result value and the actual result value based on the 7-point scale is very small.
Table 1.
LSTM model performance
| MSE | MAE | RMSE | |
| Model_1 | 0.130876 | 0.255245 | 0.361767 |
| Model_2 | 0.131156 | 0.275663 | 0.362155 |
| Model_3 | 0.131544 | 0.258739 | 0.36269 |
| Model_4 | 0.131693 | 0.27409 | 0.362895 |
| Model_5 | 0.131902 | 0.270286 | 0.363183 |
In the case of LSTM model, the Hyper Parameter is shown in the following Table 2.
Conclusion
In this study, a prediction method was studied using the LSTM model to predict the thermal comfort of occupants. As a result of this study, the prediction of thermal comfort using the LSTM model was very small, with values of 0.13, 0.22, and 0.36 based on the lowest MSE, MAE, and RMSE indicators. When explained based on the MAE index, the difference between the actual value and the predicted value shows a difference of about 0.22. It can be seen that the difference between the thermal comfort of the occupants on a 7-point scale from -3 to +3 is very small.
Ultimately, it aims to realize a pleasant HVAC system by fusion of the air conditioning system and automation technology for predicting the thermal comfort of the occupants. In addition, if the technology is equipped with the convergence technology of the relevant technology and IoT technology in the future, it is thought that it will be possible to secure technological prowess above the enrolled level and to improve the economic capacity of the industry. However, there are many factors besides temperature and humidity that affect the thermal comfort of occupants. So it is necessary to collect additional data on the relevant elements, and it is considered that more accurate result values can be derived if learning is progressed, and it is still difficult to generalize through the data of one participant. Therefore, it is assumed that the generalization based on experimental results requires the study of the corresponding factors, and that more experiments require the collection of data from various environments.
