


Introduction: Science, Environment, and Advanced Energy Materials
Methodology
Materials and Their Properties
Procedure for X-ray Phase Analysis
Recognition of Phase
Thermogravimetric Analysis (TGA)
Measurement of Electrical Conductivity and Seebeck Coefficient
Debugging Procedure
Results and Discussion
Synthesis and Crystal Structure of La2-xBaxNiO4±δ (x=0.2, 0.6, 0.9, 1, 1.2)
Oxygen Non-Stoichiometry
Electrical Conductivity and Seebeck Coefficient
Thermal expansion
Conclusion
Introduction: Science, Environment, and Advanced Energy Materials
The 21st century is confronted with important global challenges including environmental degradation, climate change and the rising need for clean, decentralized energy solutions in the building sector [1]. Advanced functional materials are the key to enable durable, high efficiency energy conversion devices for sustainable building and infrastructure systems [2]. Among these technologies, solid oxide fuel cells (SOFCs) present an attractive approach for low carbon, building integrated energy systems that can use conventional or renewable fuels [3, 4]. Nevertheless, the long-term durability and thermal compatibility of cathode materials remain the main obstacles to broader application.
SOFCs are highly efficient and low emission devices that directly convert chemical energy of fuels such as hydrogen, biogas or ammonia into electricity [5]. They are also suited to distributed and off-grid power systems, making them attractive for resilient energy applications [6, 7].
SOFCs performance depends greatly on cathode materials with high conductivity, stability and compatibility at intermediate temperatures (500–800°C) [8].
In this respect, Ruddlesden–Popper nickelates, e.g. La2NiO4 and its derivatives, have attracted much attention [9]. These layered oxides have mixed electronic-ionic conductivity that is important for the oxygen reduction reaction at the cathode [10]. Moreover, Ba or Sr doping can be exploited to tune their structural and defect properties making them promising advanced cathode materials [11].
Methodology
The methodology to prepare and characterize La2-xBaxNiO4±δ complex oxides includes careful preparation, phase characterization, thermogravimetric characterization, and transport studies employing sophisticated analytical techniques and judiciously chosen materials.
Materials and Their Properties
The Table 1 below presents all these materials employed in the preparation of La2-xBaxNiO4±δ samples with their corresponding chemical as well as physical properties:
Table 1.
shows all materials that were used with their chemical and physical properties as La2-xBaxNiO4±δ samples
Sample Synthesis Procedure
All samples of La2-xBaxNiO4±δ (x = 0.2, 0.6, 1.0, 1.2) were synthesized via the citrate-nitrate route, employing stoichiometric proportions of La2O3, BaCO3, Ni-acetate, and citric acid, dissolved and homogenized in water with added nitric acid.
Pre-treatment of Barium Carbonate
The BaCO3 was pre-treated for 5 hours at 400°C to remove adsorption gases and moisture in order to achieve purity in subsequent reactions.
Stoichiometry and Weighing
All precursors were weighed according to stoichiometry from the following formula.
where mj – mass of the reagent; Mj – molecular mass of the reagent; mox – mass of the complex oxide La2-xBaxNiO4±δMox – molecular mass of the complex oxide La2-xBaxNiO4±δ and iox – indices of this element in the formula of the original component j and in the formula of the synthesized complex oxide.
Simulation-based
where each value is stoichiometric coefficients and molar masses of separate reagents as well as for the end complex oxide.
Procedure for X-ray Phase Analysis
X-ray phase analysis (XPA) was performed to identify and refine the phases present in synthesized samples using powder X-ray diffractometers (Equinox 3000, XRD-7000 Maxima) employing Cu-Kα radiation (λ = 1.5414 Å), with diffraction patterns recorded over 10°–90° 2θ.
Recognition of Phase
Sample analyses were carried out using ‘Match!’ with ICDD PDF-2 and the COD databases, thereafter structure refinement by Le Bail or Rietveld method depending on phase purity.
Thermogravimetric Analysis (TGA)
The TGA was carried out employing a NETZSCH STA 409 PC Luxx thermoanalyzer, and was restricted to samples with x =0.6 and x=0.9 to quantify oxygen non-stoichiometry (δ) as well as its temperature dependence from 25 to 1100°C in air.
For TGA Preparation the Alumina crucibles contained calcined powders. These were heated to 1.5°C/ min to 1100°C, then held for 12 hours at every 100°C interval to provide equilibrium.
Then the samples were reduced directly in the hydrogen stream at 1100°C through relevant reduction reactions given for each composition (x = 0.6, x = 0.9), with stoichiometric removal of oxygen reflected in mass loss. Estimation of Non-stoichiometry of Oxygen: The absolute value of δ is estimated as:
where mi is the mass value at a given temperature, mв is the mass value of the reduced oxide, Мо is the mass of one mole of oxygen atoms, Мв is the sum of the molar masses of the reduction products taking into account the stoichiometric coefficients in formula wherein the variables are reduced masses, molar masses, and reduction product coefficients.
Measurement of Electrical Conductivity and Seebeck Coefficient
The transport properties were obtained from total electrical conductivity measurement and the Seebeck coefficient (S) of the sintered and sectioned blocks through the use of four-probe direct current technique and the differential method for the Seebeck coefficient in the temperature gradient created by the furnace.
Debugging Procedure
The samples were initially equilibrated in 950°C, brought down to room temperature in 50°C stages, with sufficient dwell time in each temperature to obtain stabilized conductivity values.
where l is the distance between potential contacts, Sc is the cross-sectional area of the sample, and R is the specific resistance of the sample between the contacts.
where 𝑈0 is the measured value of the thermo-emf, 𝐸0 is the voltage on the cell at zero temperature gradient, 𝛥𝑇 is the temperature difference between the upper and lower potential contacts, 𝑆Pt(𝑇cp) is the thermo-emf coefficient of the receiving platinum contacts at an average temperature value 𝑇cp.
Results and Discussion
Synthesis and Crystal Structure of La2-xBaxNiO4±δ (x=0.2, 0.6, 0.9, 1, 1.2)
The synthesis of La2-xBaxNiO4±δ (x=0.2, 0.6, 0.9,1.2) was carried out w using the citrate-nitrate technology. The Rietveld refined patterns are presented in Figure 1.
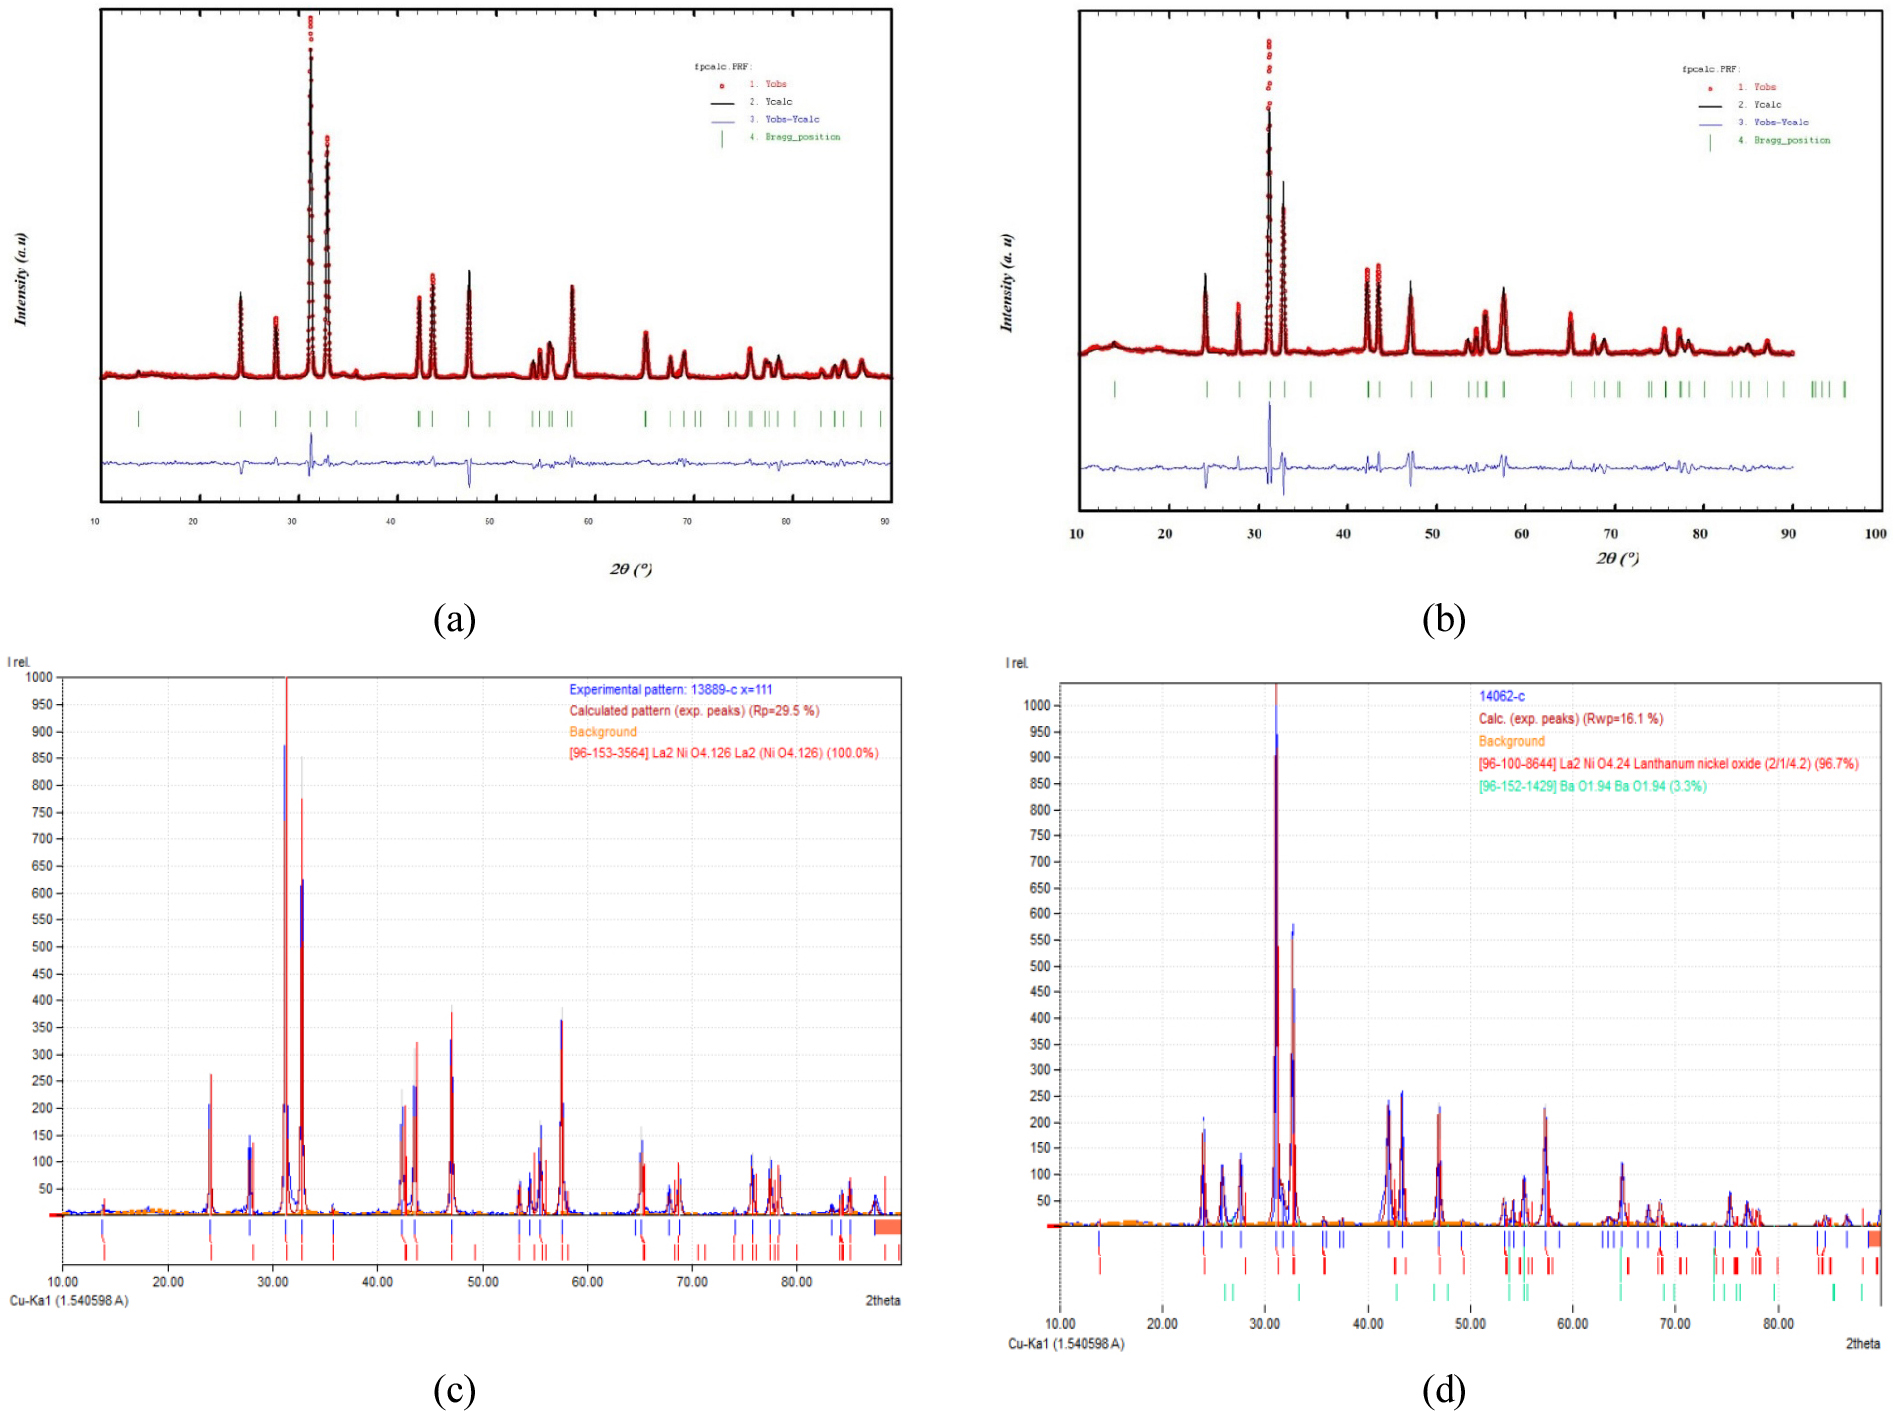
The results of the X-ray diffraction examination showed that the complex La2-xBaxNiO4±δ (x=0.2, 0.6, 0.9,) oxides were obtained as a single phase and have tetragonal structure of the K2NiF4 type (space group I4/mmm).
But for higher Ba concentration such as La0.8 Ba1.2NiO4±δ X-ray diffraction showed a multi-phase oxide (see Figure 1) which is described as follow.
Main phase La2NiO4.2 with 96.7%, that contains orthorhombic crystal system, and “Fmmm” space group.
Secondary phase: BaO1.94 with 3.3%. it contains tetragonal crystal system with “space group I4/mmm”
To study the crystal structure of the obtained compounds the diffraction patterns of complex oxides were processed using the Rietveld method. Tables 1, 2, and 3 present the refined parameters of the crystal structure, as well as the R-factors.
The data in all three Tables (Tables 2, 3, and 4) determined from the Rietveld refinement confirm that the La/Ba-O and Ni-O bond lengths show an increase with increasing Ba content, indicating the structural changes induced by Ba substitution. These changes in structural parameters have a direct relationship with the electrical conductivity of the material and its sensitivity to oxygen vacancies. According to the analyzed data, moderate Ba doping (x = 0.2–0.6) allows for an optimum balance between structural strength and functional behavior, making these compositions beneficial for high-temperature applications requiring efficient ionic and electronic conductivity.
Table 2.
Structural parameters of La1.8Ba0.2NiO4±δ, refined by the Rietveld method, sp. gr. I4/mmm (139)
Table 3.
Structural parameters of La1.4Ba0.6NiO4±δ, refined by the Rietveld method, sp. gr. I4/mmm (139)
Table 4.
Structural parameters of La1.1Ba0.9NiO4±δ, refined by the Rietveld method, sp. gr. I4/mmm (139)
The La1.4Ba0.6NiO4±δ composition displays a decreased a=b lattice parameter with an expanded c-axis, which is shown in Figure 2, which signifies the existence of improved oxygen transport pathways. Additionally, its higher microstrain and larger crystallite size will promote better electrical conductivity and mechanical stability.
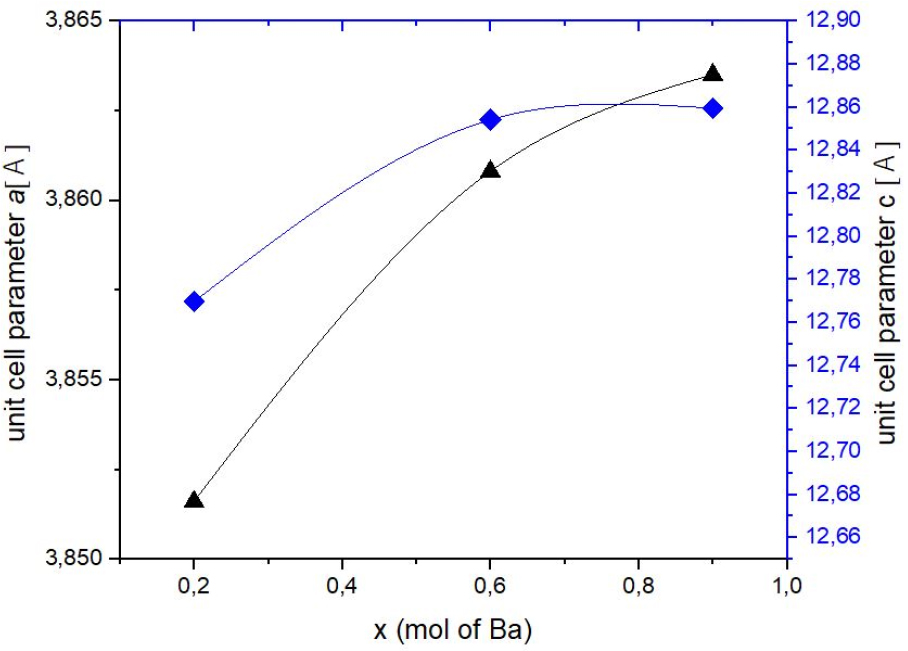
This plot illustrates how the lattice parameters a and c changed in La2-xBaxNiO4±δ as a function of the barium content (x). Indicating structural changes, the lattice parameter a constantly increases for x > 0.6. Moreover, the lattice parameter c shows an increase for x ≤0.6 but maintain almost constant for higher barium concentration (x > 0.6). This behavior can be explained by the size factor: ionic radius of the Ba²+ ion (1.47 Å) is greater than that of the La³+ ion (1.36 Å) that is in accordance with [12].
Oxygen Non-Stoichiometry
The oxygen non-stoichiometry of the studied samples was investigated using the TGA method. Figure 3 exemplifies the variations in the mass of La1.4Ba0.6NiO4±δ and La1.1Ba0.9NiO4±δ under hydrogen conditions. The variation in mass of La1.4Ba0.6NiO4±δ with hydrogen (H2) as a function of temperature is presented in the graph (a). Initially, the mass achieves a constant value up to 400°C and indicates very little reduction activity. With an increase in temperature from 400°C to 800°C, the mass drops considerably and corresponds with the reduction of the material and the ejection of oxygen out of its composition. Upon 800°C, the mass flattens out and indicates that reduction has ceased. The final composition after reduction is described as a mixture of 0.7 La2O3, 0.6 BaO, Ni. This means after reduction, the sample has converted into a non-single-phase state.
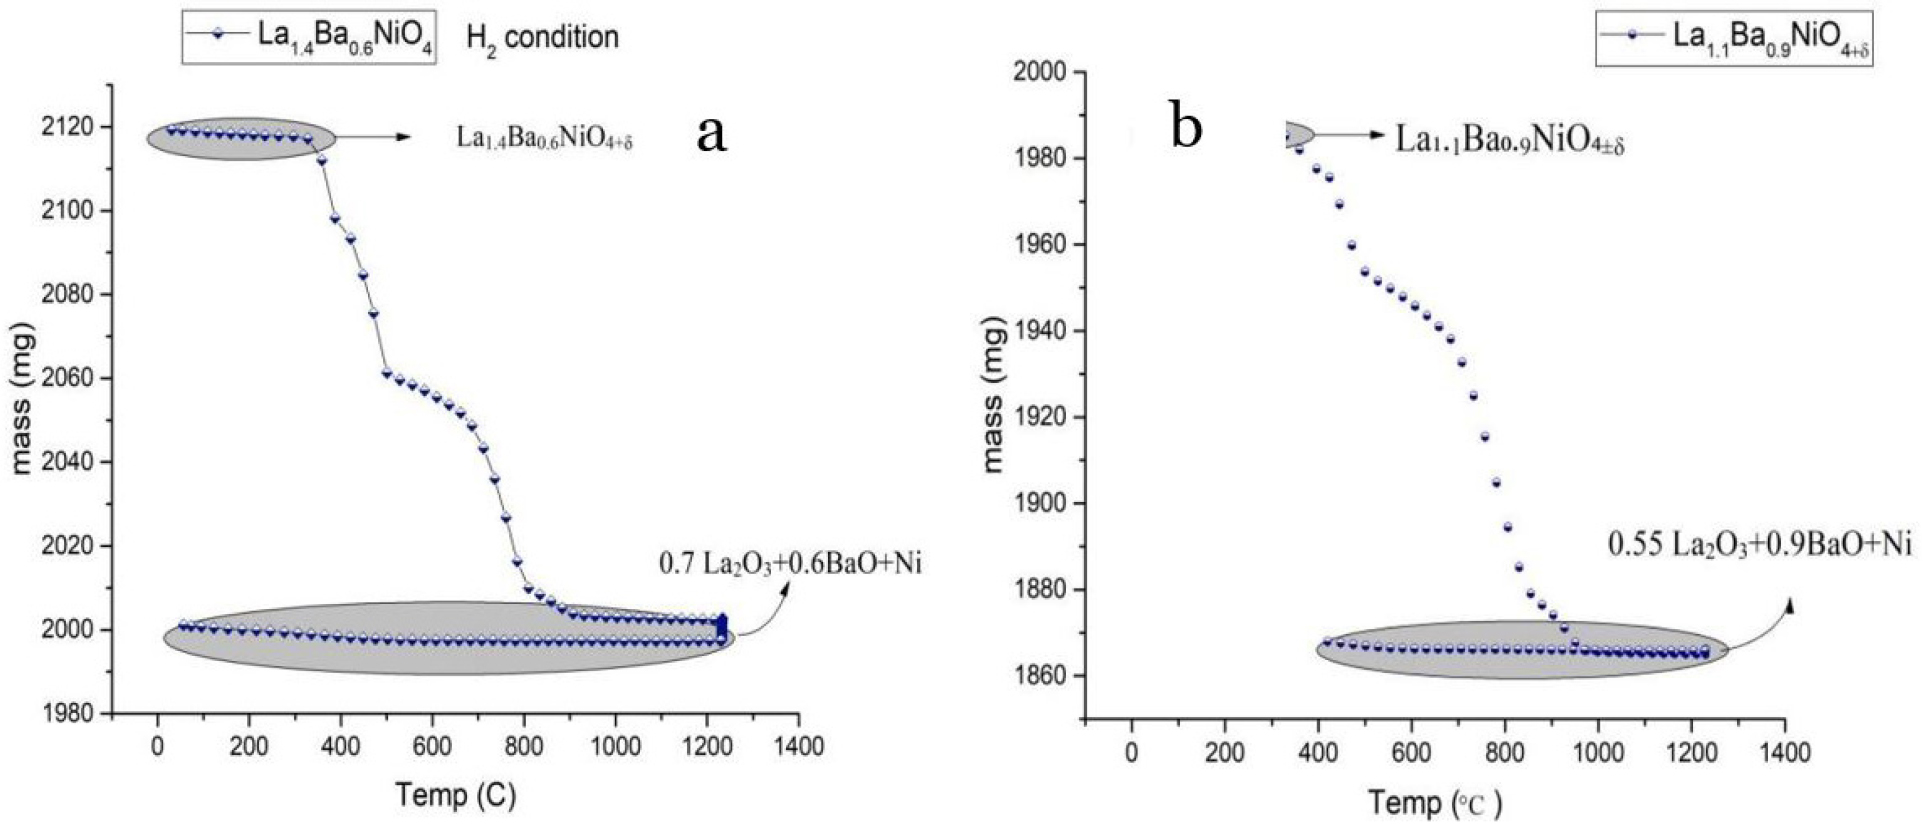
The right graph (b) shows the change in mass of La1.1Ba0.9NiO4±δ with temperature under hydrogen (H2) conditions. The sample retains a constant mass at low temperatures, signifying the stable phase of La1.1 Ba0.9NiO4±δ. The steep mass decrease with increasing temperature in the 400°C to 800°C temperature range signifies the reduction of the material and the evaporation of oxygen from its crystal matrix. The reduction reaction is important in establishing the total oxygen content (4 +δ) in the sample. The steep reduction in mass signifies the degradation of the original phase and the production of water as a result of the reaction between oxygen and hydrogen.
At high temperatures, the mass achieves an equilibrium state, indicating the end of the reduction process. The chemical composition of the resulting product has been described as a composite of 0.55 La2O3, 0.9 BaO, Ni, thereby indicating the non-monolithic character of the sample after reduction.
The mass loss and temperature dependencies for La2-xBaxNiO4±δ ( x = 0.6,x=0.9) are presented in Figure 4 under air conditions.
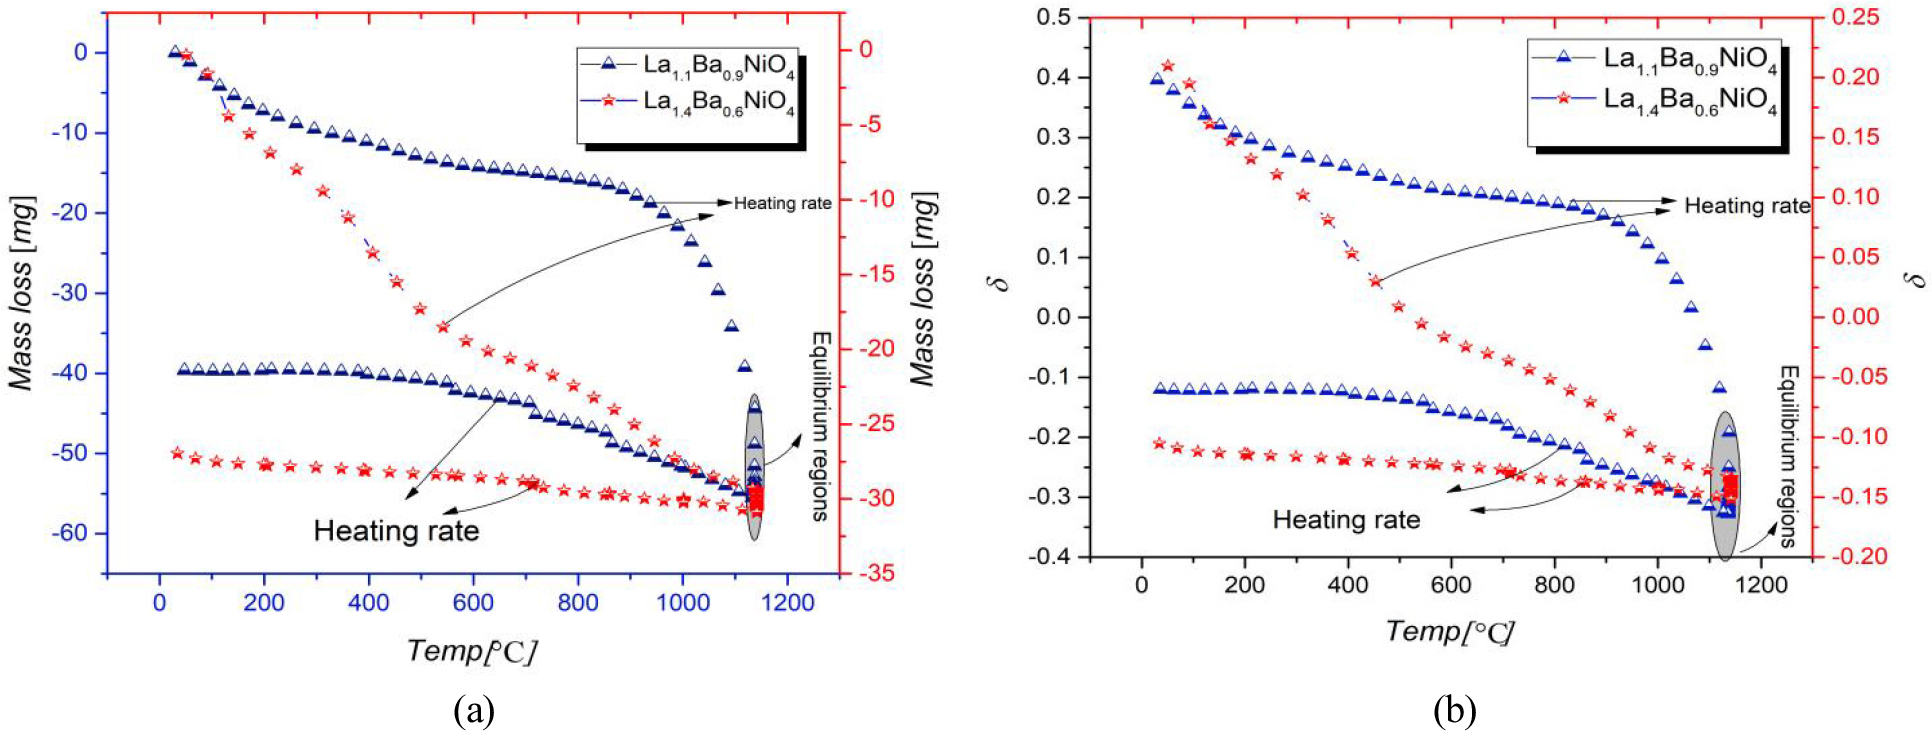
For the TGA of powders in air (a), La1.1Ba0.9NiO4±δ and La1.4Ba0.6NiO4±δ show large weight losses, mostly from room temperature up to ∼1000°C, indicative of removal of volatile groups and decomposition reactions. The La1.1Ba0.9NiO4±δ sample shows larger weight losses over the entire range than La1.4Ba0.6NiO4±δ .
At around 1000°C, both compositions reach stable regimes where supplementary weight loss stops, marking the achievement of thermally stable phases as well as the end of pronounced reactions. The difference in total weight loss emphasizes the greater stability of La1.4Ba0.6NiO4±δ under such surroundings.
The oxygen non-stoichiometry with temperature dependencies for La2-xBaxNiO4±δ ( x = 0.6, x=0.9) are presented in Figure 5 in air condition. The graphed data indicates in Figure 4(b) that for both La1.1Ba0.9 NiO4±δ and La1.4Ba0.6NiO4±δ, the δ parameter drops significantly as temperature increases, with the largest values of change occurring up to around 1000°C. Both compositions show a large decrease in δ upon heating—indicating large losses of oxygen and stoichiometry shifts—after which stabilization occurs at the higher temperature range where δ achieves an equilibrium magnitude, showing that gross shifts of the oxygen content are finished and thermally stable structure is attained. Notice that La1.4Ba0.6NiO4±δ always achieves a lower δ than La1.1Ba0.9NiO4±δ, indicative of compositional shifts of oxygen retention and heat response over the whole procedure.
Electrical Conductivity and Seebeck Coefficient
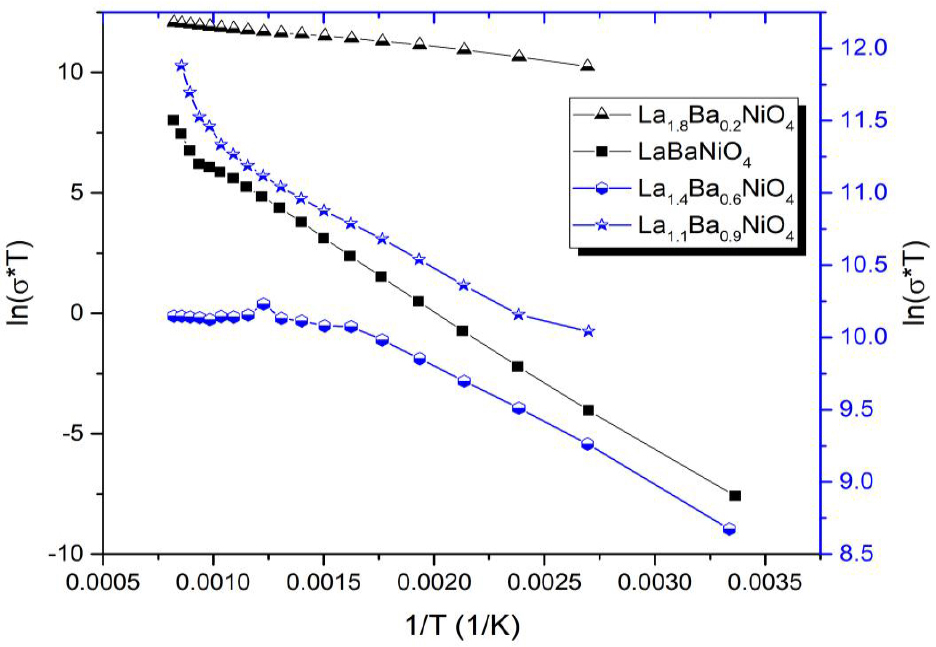
The overall electrical conductivity and Seebeck coefficients for the samples were measured using a four-probe method with direct current and a differential method in a natural temperature gradient of the furnace (5-15°C/cm), respectively, in the temperature range of 25-1000°C in air. This method is necessary to use for La2NiO4+d and its derivatives, as they have a relatively high overall electrical conductivity [13, 14]. The experimental dependencies of electrical conductivity (σ) is shown in Figure 5 as functions of temperature in air.
The graph illustrates temperature dependence on electrical conductivity of four unique compositions of La2-xBaxNiO4 as a function of reciprocal temperature, 1/T. The maximum and virtually horizontal conductivity in the measurement range is demonstrated by La1.8Ba0.2NiO4, while lower conductivity and higher temperature dependence are demonstrated by LaBaNiO4, La1.4Ba0.6NiO4, and La1.1Ba0.9NiO4, decreasing as a function of increasing content of barium. This trend indicates lower carrier concentration or mobility due to greater Ba substitution, and highlights compositional tuning as being a vital ingredient in optimizing such electrical properties in such a type of nickelate material when in high-temperature applications.
The Seebeck coefficient, also referred to as thermopower, is a quantification of the thermoelectric voltage produced by a temperature difference along an element. It is described as the ratio of voltage to temperature difference (Δ V / Δ T) and is usually stated in units of microvolts per kelvin (μV/K) [15]. The sign of the Seebeck coefficient is representative of the character of the charge carrier, being positive for p-type semiconductors (holes) and negative for n-type semiconductors (electrons) [16]. The Seebeck coefficient is significant for thermoelectric application since a high value for materials indicates increased efficiency in converting heat to electricity and vice versa [17].
The Seebeck coefficient (S) is a measure of the thermoelectric voltage generated in response to a temperature gradient across a material. For mixed oxygen ionic electronic conductors, where the electronic (electron or electrons holes) contribution much greater than ionic, thermos-power coefficient can by expressed by the following formula [18]:
where α– the Seebeck coefficient,
R is the universal gas constant R = 8.314, J/(mol·K),
F is the Faraday’s constant F = 96485, C/mol,
p = 2δ+x denotes concentration of electron holes per formular unit
La2-xBaxO4+δ,
Q* is the heat of transfer,
𝛽 is spin degeneracy factor,
T is an absolute temperature in Kelvin.
This formula is often used in the context of materials with ionic or mixed ionic-electronic conductivity, such as La2-xBaxNiO4±δ, The formula for the Seebeck coefficient explains the trends observed in the plots by linking the thermopower to the material’s defect chemistry, oxygen non-stoichiometry, and temperature.
The experimental dependencies of Seebeck coefficient (S) with reciprocal temperature are shown in Figure 6 as functions of temperature in air.
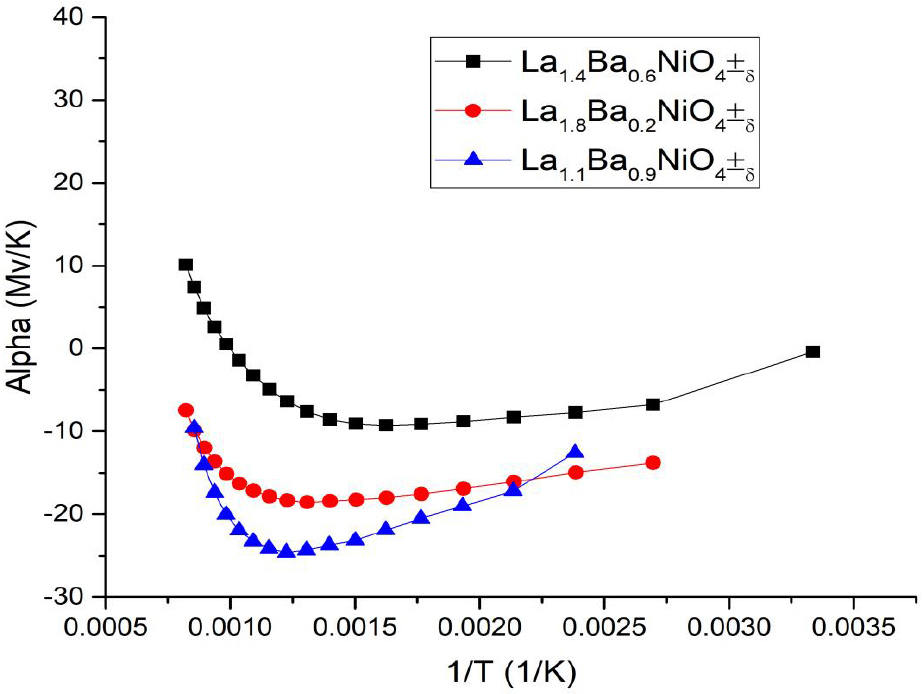
The graph shows how temperature is correlated to the Seebeck coefficient (α) for samples of La2-xBax NiO4±δ with different barium levels (x = 0.2, 0.6, 0.9). All of the observed compositions have been found to have negative Seebeck coefficients, which indicates a dominance of n-type conduction. The highest absolute values are demonstrated by La1.4Ba0.6NiO4, particularly at lower temperatures, which indicates enhanced electron transport or carrier concentration compared to the other samples. With increasing temperatures (and decreasing 1/T), the absolute value of α usually decreases, reflecting a relative decrease in thermoelectric efficiency. The observed spike at lower temperatures (lower 1/T) for La1.4Ba0.6NiO4 could reflect changes in carrier scattering or mobility. These trends highlight how crucial the level of barium and temperature are in determining how well samples of La2-xBaxNiO4±δ perform thermoelectronically, a fact that is fundamental in optimizing their use in energy conversion technology.
Thermal expansion
The behavior of thermal expansion of La2-xBaxNiO4±δ for x = 0.2, 0.6, 0.9 and 1 were investigated in dry air for a temperature range of 20-1000°C. Knowing thermal expansion behavior is important for getting insight into structural stability and possible practical applications in high-temperature applications, the thermal expansion of the complex oxides La2-xBaxNiO4±δ for x = 0.2, 0.6, 0.9 and 1 were investigated in this work, the obtained results are presented in Table 5 According to the calculated data which were shown in Table 5, the thermal expansion behavior of the four compositions, LaBaNiO4±δ, La1.4Ba0.6NiO4±δ, La1.8Ba0.2NiO4±δ, and La1.1Ba0.9NiO4±δ is found to be linearly dependent from temperature. Of all compositions, relative elongation is highest for La1.1Ba0.9NiO4±δ at about 0.020 for a temperature of 1200°C, followed by LaBaNiO4±δ with 𝛥L/L0=0.017, La1.4Ba0.6NiO4±δ 𝛥L/L0=0.015 and lowest for La1.8Ba0.2NiO4±δ 𝛥L/L0=0.013. Such a trend suggests an increase in thermal expansion with an increase in proportion of Ba, which could be explained by an increase in ionic radius of Ba²+, which could result in additional expansion of the lattice. The obtained TEC values are close to the values for known electrolytes (LSGM, SDC, La28-zW4+zO54+1.5z (LWO) [19, 20, 21, 22, 23, 24, 25, 26], which may indicate their compatibility.
Table 5.
Values of thermal expansion coefficients La2-xBaxNiO4±δ for (x = 0.2, 0.6, 0.9, 1)
In Figure 7, the general behavior of thermal expansion measurement as a function of temperature was presented for three different compositions.
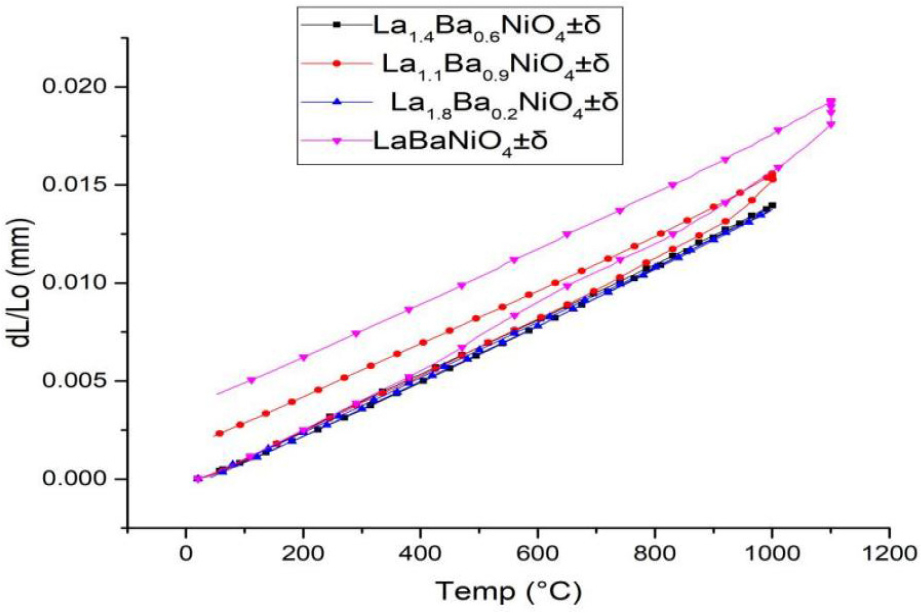
The graph shows thermal expansion (ΔL/L₀) for La2-xBaxNiO4±δ samples to 1200°C, demonstrating that expansion rises with increasing temperature and barium content based on Ba²+’s larger ionic size and oxygen vacancy creation. Expansion is greatest in LaBaNiO4±δ, decreasing in samples to a minimum in La1.4Ba0.6NiO4±δ. With increasing temperature, samples transition from a linear to a greater expansion, indicating chemical transformations and lattice dynamic motion. The order, in terms of greatest to lowest expansion, is as follows: LaBaNiO4±δ > La1.1Ba0.9NiO4±δ > La1.8Ba0.2NiO4±δ.
Conclusion
The results of the study demonstrated that La2-xBax NiO4±δ nickelates would experience significant differences in structural characteristics, defect chemistry, transport properties, and thermal expansion properties when they are doped with Ba and used in an intermediate temperature (IT) solid oxide fuel cells (SOFC) as cathodes.
•The composition of the single-phase nickelate materials produced successfully with a tetragonal K2NiF4 structure (x = 0.2, 0.6, 0.9). The results of the structural analysis indicated that as the amount of Ba in the NiO4±δ structure increases, both the length of the La/Ba-O and Ni-O bonds increase resulting in the slight expansion of the unit cell, thus allowing for greater lattice geometry changes and improved formation and transport of oxygen vacancies with Ba substitution for La within the lattice structure of the nickelates.
•The non-stoichiometric behavior of the oxygen revealed that La1.1Ba0.9NiO4±δ exhibits greater oxygen-loss potential and higher mobility of defects than La1.4Ba0.6NiO4±δ. This indicated that the introduction of higher amounts of Ba increases the redox activity of the nickelates although they are also more prone to changes of structure under high temperatures. Conversely, La1.4Ba0.6NiO4±δ exhibits greater structural stability and loses less oxygen than La1.1Ba0.9NiO4±δ; therefore, it was found to have longer-term consistent performance. The electrical measurement results indicated that at 950° C, La1.1Ba0.9NiO4±δ had the highest conductivity, at 151.6 S/cm, which provides further corroborating evidence that moderate levels of Ba can enhance the carrier mobility and overall charge transport of the nickelate materials.
•The addition of Ba content to La1.1Ba0.9NiO4±δ leads to the greatest thermal expansion and also shows that the dopant concentration will influence the thermal-mechanical compatibility between the materials and the electrolytes. There is an optimal amount of barium dopant that must be used in order to achieve electrical conductivity and to produce oxygen vacancies while keeping the thermal expansion as low as possible. Based on this work, La1.4Ba0.6NiO4±δ has a reasonable balance between structural stability and functional performance. La1.1Ba0.9NiO4±δ has the highest electrical conductivity when used in a cathode.

