

Introduction
The Building Description and Conditions for the Energy Simulation
Building Description
Correlation between the Density and Specific Heat
Cases for the Energy Simulation
Analysis Result
Indoor Temperature by Different Densities
Interior Insulation Finishing System: Indoor Temperature by Different Densities
Exterior Insulation Finishing System: Indoor Temperature by Different Densities
Heating and Cooling Load Comparison by Different Values of the Density and Specific Heat
Discussion & Conclusion
Introduction
As with great concern for global warming, the Korean Government has announced that Korea will achieve carbon neutrality by 2050. Regarding this, Green New Deal projects were initiated by investing about $65.4 billion US dollars and creating 659,000 career opportunities with eco-friendly policies [1]. In line with Green New Deal projects, the “Green Remodeling” project was chosen in the area of the building sector, which aimed to enhance building energy efficiency for existing buildings as well as improve indoor environmental quality targeting carbon neutrality and greenhouse gas reduction [2]. To achieve this, it requires an analysis tool to assess the energy performance of net-zero energy buildings or buildings involved with the green remodeling project quantitatively.
A representative energy simulation tool in South Korea is ECO2, which provides monthly energy consumption data such as heating, cooling, lighting, DHW(Domestic hot water), and ventilation based on ISO 13790 and DIN V18599 [3, 4, 5]. However, it is difficult to use for sophisticated energy load analysis due to its simplicity. Specifically, the existing energy simulation tool calculates thermal transmittance considering only thermal conductivity and thickness of building materials. To analyze building energy use more accurately, it requires additional information such as density, specific heat, and so on. Therefore, there is a need to develop another energy simulation tool that can analyze building energy-efficient designs considering the abovementioned building material information. In addition, there have been few studies about the difference of indoor temperature and energy demand by differing the values of density and specific heat of building materials. Regarding this matter, EnergyPlus has been generally used, which calculates the heat transfer in buildings considering building thickness, thermal conductivity, transmittance, density, specific heat, etc. [6]. When conducting the simulation program, numerous inputs are generally required and most of those are assumed [7, 8]. For this reason, the gap between the simulated and actual performance of building such as energy demands, thermal behaviors and so on could become significant differences in predicted values as well as lead unreliable results [9, 10]. In the case of the building energy consumption, it has significantly been influenced by building envelope systems specifically energy storage capacity of building materials [11, 12, 13, 14]. To calculate building energy demand accurately, it requires specific information of building materials.
Among building material information, the present study investigates the thermal and energy performance in an office building by varying the values of density and specific heat. The outcomes of the study are expected to provide information for a better understanding of building materials’ characteristics.
The present study aims to investigate an impact on thermal and energy performance by varying the values of density and specific heat of building materials. For this analysis, a 3rd-floor office building was chosen. By using the EnergyPlus simulation tool, indoor temperature, and heating and cooling load in the perimeter zone facing the South façade were analyzed by varying the values of density and specific heat of building materials.
The Building Description and Conditions for the Energy Simulation
Building Description
As shown in Figures 1 and 2, a 3-floor office building as a reference building provided by EnergyPlus was selected and applied building materials used for domestic office buildings in South Korea. The detail of the building was presented in Table 1.
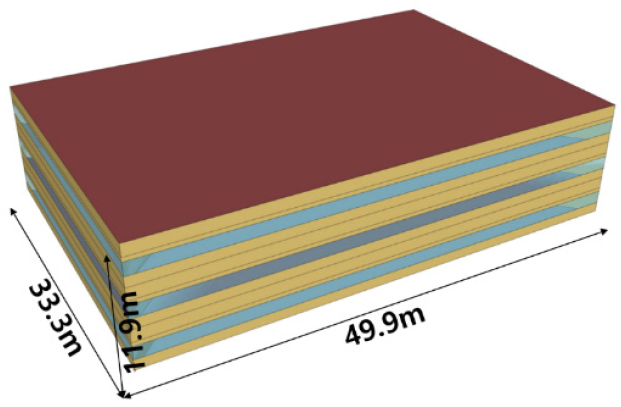
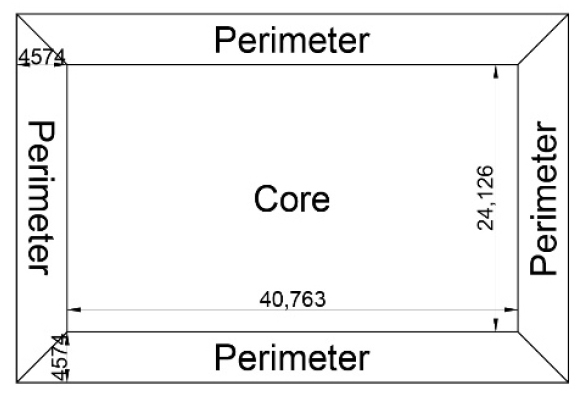
Table 1.
Specific condition
Table 2 shows the thermal properties of building materials for the energy simulation. In addition, the thermal transmittances of the selected building are presented in Table 3.
Table 2.
Thermal properties of building materials
Table 3.
Thermal transmittance of the selected building
| Component | Thermal transmittance (W/m2K) | SHGC |
| Wall | 0.240 | |
| Roof | 0.150 | |
| Floor | 0.290 | |
| Windows | 1.5 | 0.583 |
Correlation between the Density and Specific Heat
Eq. 1 presents the correlation between density and specific heat.
where T is the temperature as a function of position and time and x is the position. t is the time and α is the thermal diffusivity of the layer material which is equal to k / (ρ · cp). In addition, k is the thermal conductivity and ρ is the density. Moreover, cp is the specific heat.
Cases for the Energy Simulation
As shown in Table 4, a total of 11 cases were created for the analysis. For Case 1, the values of the density and specific heat were from the building materials used for the selected building. For Case 2 – 6, 90% - 50% of the density value of Case 1 were set since the specific density values were not available. To find out the impact of the density changes, the indoor temperature difference and the heating and cooling loads were compared for Case 1 to 6.
Table 4.
Cases for the analysis
| Case | 1 | 2 | 3 | 4 | 5 | 6 | 7 | 8 | 9 | 10 | 11 |
| Density (%) | 100 | 90 | 80 | 70 | 60 | 50 | 90 | 80 | 70 | 60 | 50 |
| Specific heat (%) | 100 | 100 | 100 | 100 | 100 | 100 | 90 | 80 | 70 | 60 | 50 |
For Case 7 – 11, the values of both density and specific heat were decreased from the values of Case 1 from 90% to 50%. When both values were decreased, only heating and cooling loads were analyzed.
Analysis Result
Indoor Temperature by Different Densities
For this analysis, indoor temperatures during the winter and summer in the two insulation systems such as the interior and exterior insulation finishing systems by applying several values of the density were presented.
Interior Insulation Finishing System: Indoor Temperature by Different Densities
When the interior insulation finishing system was applied, the indoor temperature changes for Case 2 – 6 based on the value of Case 1 during the winter and summer were presented in a and b in Figure 3.
As shown in a in Figure 3, the indoor temperatures for Case 2 – 6 were distributed lower than the value of Case 1 (i.e. 0°C) during the winter. This can be seen that the indoor temperatures were decreased as with the decrease in the value of the density. In addition, the pattern showed that the indoor temperatures for Case 2 – 6 were lower during 12 AM - 12 PM and higher during 12 PM – 7 PM than the value of Case 1. Among the cases, the largest indoor temperature difference (-2.93°C, 9 AM, Dec 7th, 2020) was observed for Case 6, which had the lowest density. At the same time, the indoor temperatures for Case 1 and 6 were about 17.43°C and 14.5°C, respectively. Thus, building materials with low density can have a significant impact on the indoor temperature in outdoor climates. During the summer (b in Figure 3), the indoor temperatures were higher during the daytime and lower during the nighttime than the values of Case 1. Similar to the result during the winter, the largest temperature difference was observed for Case 6 compared to Case 1. Specifically, the temperature difference was about 2.1°C higher and 3.53°C lower than the values of Case 1 on Jun 7th and Jul 3rd, 2021, respectively.
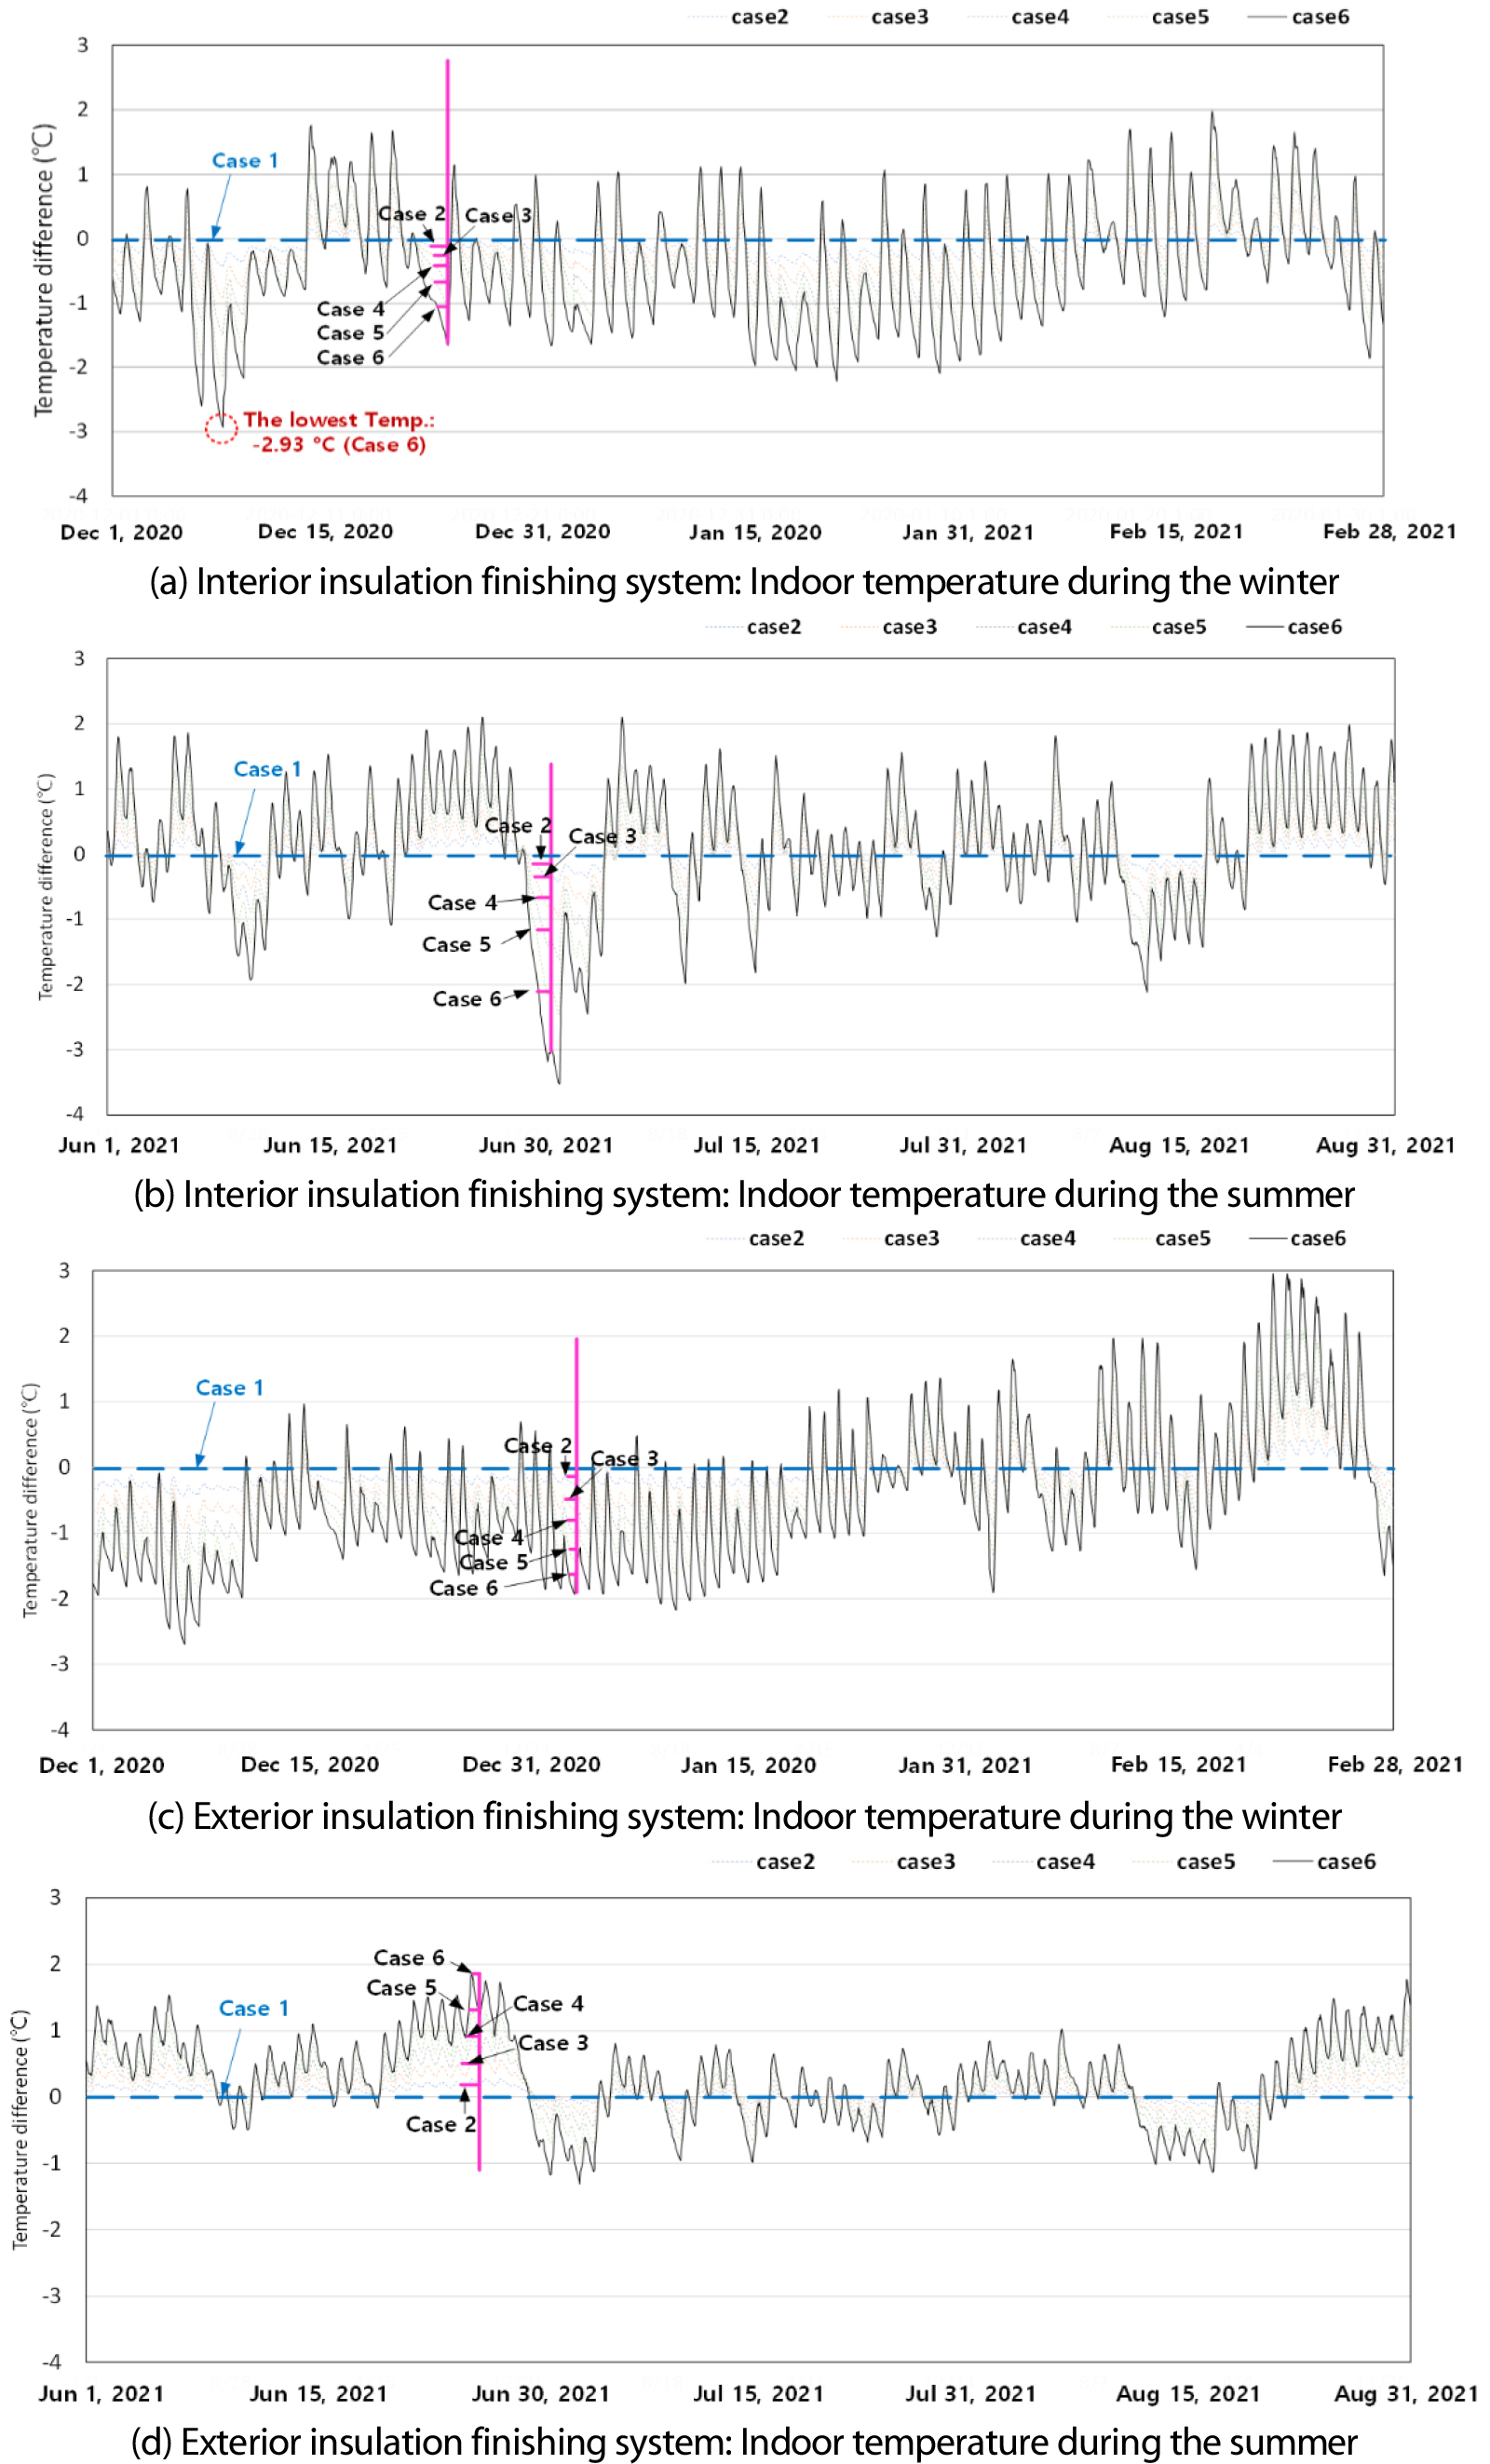
Exterior Insulation Finishing System: Indoor Temperature by Different Densities
When the exterior insulation finishing system was applied, the indoor temperatures for cases during the winter and summer were presented in c and d in Figure 3. During the winter, the indoor temperatures for Case 2 – 6 were distributed lower than that of Case 1. Thus, it can cause large heating loads. At 9 AM on Dec 7th, the indoor temperature for Case 6 was about 2.7°C lower than that of Case 1 In addition, the indoor temperatures for Case 2 – 6 were higher than that of Case 1 around the end of Feb 2021. At 4 PM on Feb 25th, 2021, the indoor temperature for Case 6 was about 2.95°C higher than that of Case 1.
During the summer, the indoor temperatures for Case 2 – 6 were higher than that of Case 1. Then, it can cause large cooling loads. However, the indoor temperature difference was lower than that in the building with the interior insulation finishing system. The indoor temperature difference comparisons between Case 1 and Case 6 for these two insulation finishing systems are presented in Table 5. While the indoor temperature difference ranges from -1.31°C to 1.86°C during the summer with the exterior insulation finishing system, a larger temperature difference (-3.53°C to 2.10°C) was observed in the building with the interior insulation finishing system.
Table 5.
The indoor temperature difference between Case 1 and 6 for interior and exterior insulation finishing systems
| Winter | Summer | ||||
| Max | Min | Max | Min | ||
| Interior insulation finishing system | +2.94°C | -2.93°C | +2.10°C | -3.53°C | |
| Exterior insulation finishing system | +2.95°C | -2.70°C | +1.86°C | -1.31°C | |
Figure 4 shows the outdoor temperature and indoor temperatures for the cases during which the outdoor temperature was decreased from about 26.1°C at 6 PM on Jun 30th to 18.7°C at 8 AM on Jul 2nd, 2021.
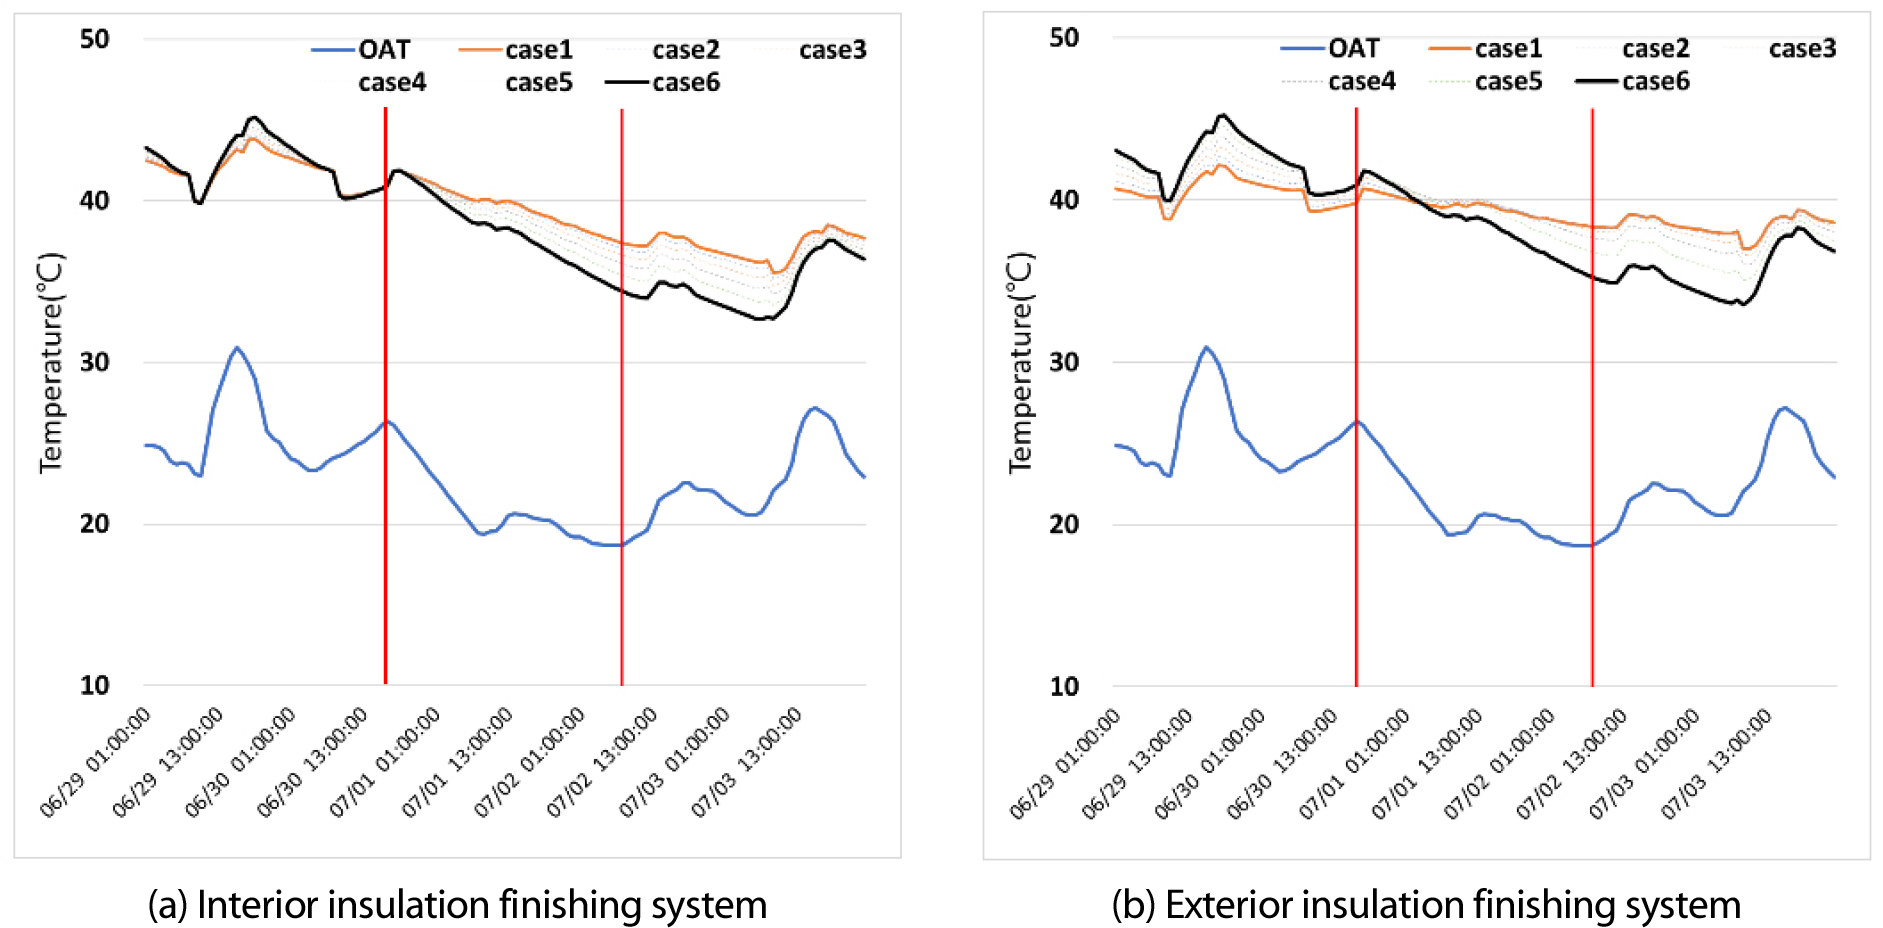
As can be shown in both interior and exterior insulation finishing systems, a time lag of 2 hours was observed. However, the indoor temperatures for Case 1 - 6 in the building with the interior insulation finishing system were decreased more by about 0.9°C - 1.7°C than the values in the building with the exterior insulation finishing system.
Heating and Cooling Load Comparison by Different Values of the Density and Specific Heat
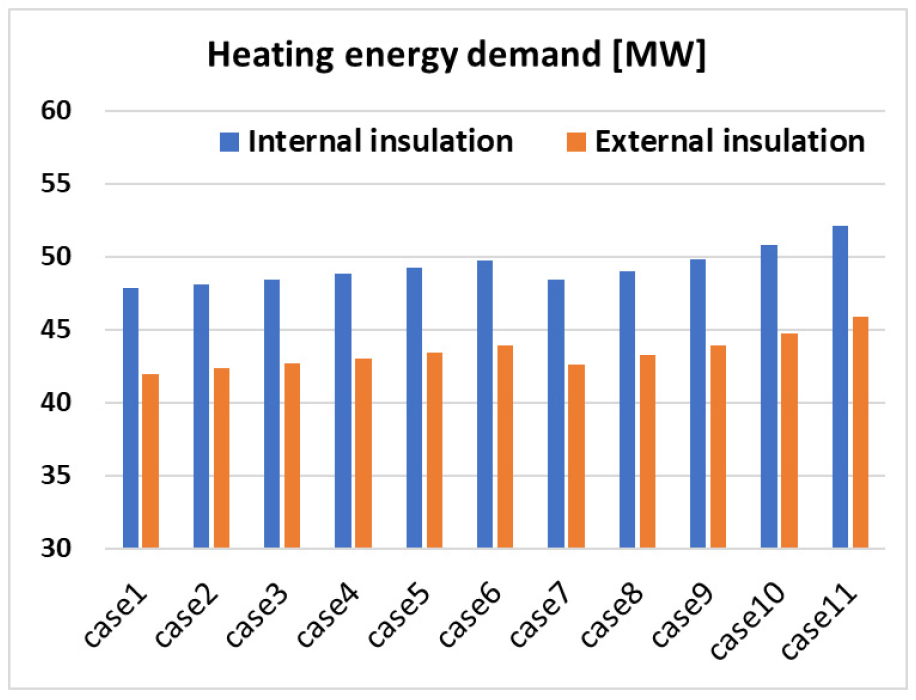
As mentioned above, the indoor temperature was highly influenced by the density values. In this stage, the heating and cooling loads were analyzed by varying only the density (Case 2 – 6) and both values of the density and specific heat (Case 7 – 11). In the case of the heating energy demand (Figure 5), the increase in energy consumption was observed in the building with both interior and exterior insulation finishing systems as the values of the density and specific heat were decreased. Specifically, about 0.6% - 0.7% of the heating load was increased as with 10% of the density decrease. For Case 7 -11, the heating energy demand was about 1.2% - 1.5% increased.
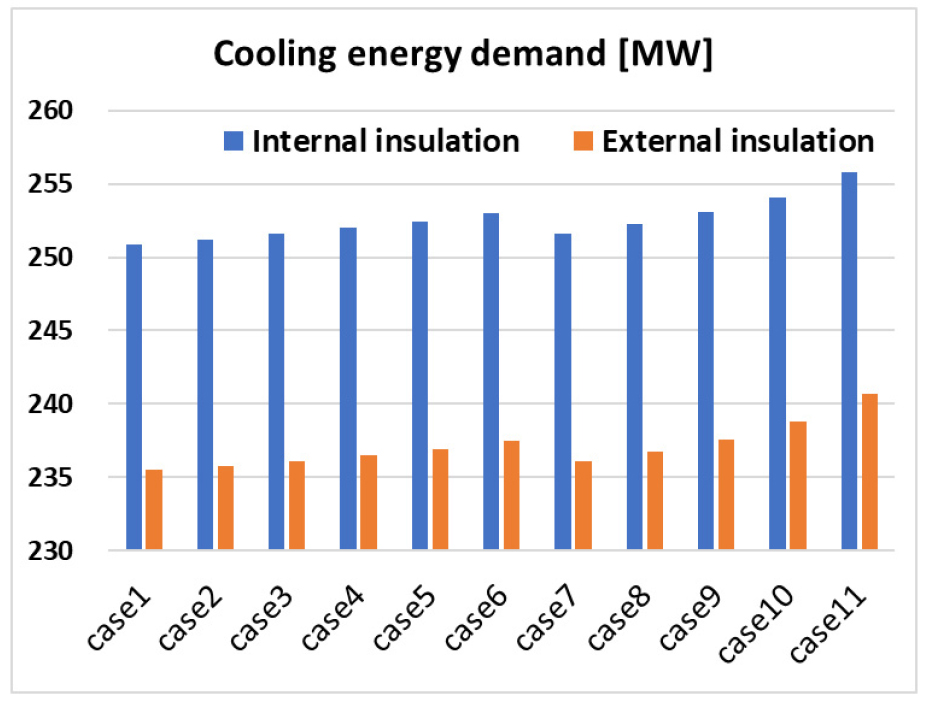
In the case of the cooling load comparison (Figure 6), the cooling load was about 0.15% - 0.2% increased, while 10% of the density was decreased. When both values of the density and specific heat were decreased, about 0.3% - 0.4% of the cooling energy demand was increased (Case 7 – 11). In sum, about 12% and 6% of the heating and cooling energy demands were decreased, respectively, when the exterior insulation finishing system was applied.
Discussion & Conclusion
The present study investigates the thermal and energy performance in an office building by varying the values of density and specific heat of building materials. For the analysis, a 3rd-floor office building was selected. By utilizing EnergyPlus, indoor temperature in the perimeter zone facing the South façade, and heating and cooling load of the building were analyzed by varying the values of density and specific heat.
The findings from the study were as follows:
1.When varying the values of the density and specific heat, the indoor temperatures were highly influenced by the outdoor climates and these were decreased as with the decrease in the value of the density and specific heat during winter.
2.The indoor temperatures were varied with the exterior and interior insulation finishing systems. As a comparison result, a larger temperature difference was observed in the building with the interior insulation finishing system compared to the result with the exterior insulation finishing system.
3.For both interior and exterior insulation finishing systems, a time lag of 2 hours was observed. The indoor temperatures in the building with the interior insulation system were highly influenced by outdoor climates.
4.For the analysis of the heating and cooling loads, both energies were highly demanded as the values of the density and specific heat were decreased. These large cooling and heating demand was observed in the building with both interior and exterior insulation finishing systems. When the exterior insulation finishing system was applied, an additional 12 % and 6 % of the heating and cooling energy demands were decreased respectively.
As can be shown, it is important to analyze the building energy demand by considering thermal storage capacity of building materials for buildings with both interior and exterior insulation finishing systems. As the building energy demand and indoor temperatures are highly influenced by the values of density and specific heat of building materials, it requires to apply accurate values of building materials for the energy simulation. Therefore, there is a need to develop a energy simulation program considering the thermal storage capacity such as density and specific heat of building materials not by simply applying building material thickness and thermal conductivity. In addition, building stakeholders need to consider the values of density and specific heat of building materials for calculating the building energy demand. For a further study, the difference in thermal loads and temperature distributions in buildings by applying different values of density and specific heat of building materials under unsteady state conditions will be analyzed.
