Introduction
Experimental Setup for Data Collection
Gas Sensor
Data Collection
Results and Discussion
Confusion Matrices (CM)
Logistic Regression (LR) Classifier
Decision Tree (DT) Classifier
Random Forest (RF) Classifier
K-Nearest Neighbour (KNN) Classifier
Naïve Bayes (NB) Classifier
Ada Boost (Adaptive Boosting) Classifier
Multilayer Perceptron (MLP) Classifier
Support Vector Machine (SVM) Classifier
Conclusion
Introduction
Mosquitoes are notorious for transmitting various diseases such as the Zika virus, dengue fever, and malaria. Therefore, it is crucial to develop and effectively utilize insect repellents to protect people from mosquito-borne illnesses. An increasing number of individuals are exploring the application of learning algorithms to categorize and evaluate the efficiency of different insect repellents, as discussed in references [1, 2]. These algorithms employ labeled datasets to classify mosquito repellents based on their effectiveness, discerning patterns and predicting the efficacy of each repellent by analyzing features like chemical composition, concentration, duration of protection, and environmental conditions [3]. Many researchers use these parameters to classify and quantify repellents, as summarized in references [4, 5, 6].
Burning indoor mosquito coils is a common practice in numerous households across Asia, Africa, and South America for repelling mosquitoes effectively. However, the smoke produced by these coils may contain harmful pollutants [7]. An experiment was conducted to analyze emissions from two popular Malaysian brands and four Chinese brands of mosquito coils. The researchers used mass balance equations to calculate emission rates of fine particles (PM2.5), polycyclic aromatic hydrocarbons, aldehydes, and ketones. They applied these emission rates to predict indoor pollutant concentrations under realistic room conditions and found that burning mosquito coils could lead to pollutant concentrations exceeding air quality limits. Notably, Malaysian mosquito coils produced more pollutants than their Chinese counterparts under the same combustion conditions. To repel mosquitoes and purify the air, one researcher proposes an innovative method in which a sensor detects mosquito presence and adjusts the release of herbal fumes accordingly. This approach outperformed other commercial mosquito repellents in terms of effectiveness [8]. In reference [9], authors developed a system that uses an Arduino UNO powered by a rechargeable 12V battery and a solar panel to control a mosquito-repelling device in a 125 square meter area. It is essential to consider the safety of chemical disinfectants, as they can pose risks to humans and the environment when misused [10, 11].
Climate change has had a significant impact on the environment, affecting flora and fauna, as discussed in reference [12]. Successful gas and odor classification and quantification methods have been deployed, as detailed in the reference [13]. Additionally, a real-time monitoring system is needed to ensure the quality and presence of disinfection agents in public sterilization chambers [14]. Analog outputs obtained from these chambers are recorded in an Excel sheet and analyzed using various machine learning (ML) techniques. Support Vector Machine (SVM) algorithms have shown the highest accuracy, sensitivity, and specificity, with values of 91.5%, 91.08%, and 90.90%, respectively [15]. To address fast detection, reference [16] suggests an attention-based gated recurrent unit (AGRU) and thoroughly explains the mechanism. The study evaluates the model’s performance using metrics such as accuracy, root mean square error (RMSE), model parameters, and floating-point operations (FLOPs). This approach is also applied to compare the performance of mosquito repellents [17]. For monitoring hazardous gases, insight monitoring is discussed in references [18, 19]. Greenhouse gas emissions from penetration resist agents are assessed, with carbon dioxide emissions found to be the most significant contributor [20]. In the context of bridge cycle maintenance, environmental impact prediction employs greenhouse gas emission analysis and a database, as noted in references [21, 22].
In classification tasks for real-time systems with limited hardware resources, researchers often prioritize classifiers that are easy to implement and quick to execute, as explained in references [4, 23]. A key focus of their work is the comparison of two straightforward and fast classifiers, namely the Naive Bayes classifier and the Cogent confabulation-based classifier [3]. The ultimate goal of ML and pattern recognition (PR) is to create classification terms that are easily comprehensible to humans. Reference [24] proposes the use of the Microwave and K* Algorithm to estimate the alcohol content of liquids. Here is a summary of the contributions made by this article:
1.We designed a gas sensor-array system using an E-Nose for data collection purposes.
2.We conducted comparisons and testing of different ML algorithms to assess their performance accuracy.
3.We also evaluated the performance of error metrics and examined confusion matrices for comparison.
The remainder of this paper is organized as follows: Section 2 provides details about the experimental setup, data collection procedures, the design of the E-Nose system, and the subsequent data analysis. Section 3 presents the analysis results of different ML algorithms, including accuracy, confusion matrix, and other model performance parameters. It also discusses data categorization using various ML classification algorithms and the data acquisition process using a sensor module. Finally, Section 4 summarizes the conclusions. This study focuses on the utilization of an E-Nose-based Sensor system and the development of multiple machine-learning algorithms to collect data from eight MQ sensors and one Digital Temperature Humidity sensor (DHT22). Subsequently, the study involves the categorization of gases/odors.
Experimental Setup for Data Collection
The E-Nose system incorporates a gas sensor array containing anywhere from four to sixteen sensors. As detailed in references [13, 25], essential components of every E-Nose system include data pre-processing, classification, and pattern recognition (PR). In a comparative analysis with a single electronic nose, single electronic tongue, and combined electronic nose and tongue systems, the synaesthesia model yielded the highest accuracy, Kappa coefficients, and F1 scores for identifying beer and apple samples [26, 27].
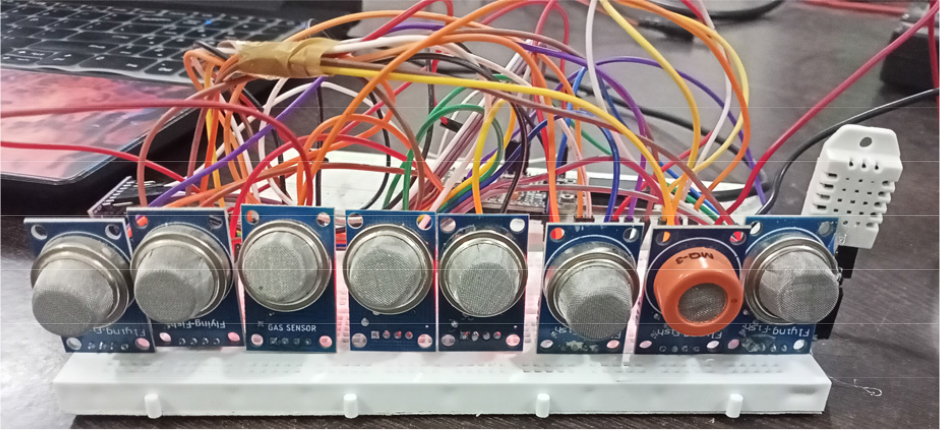
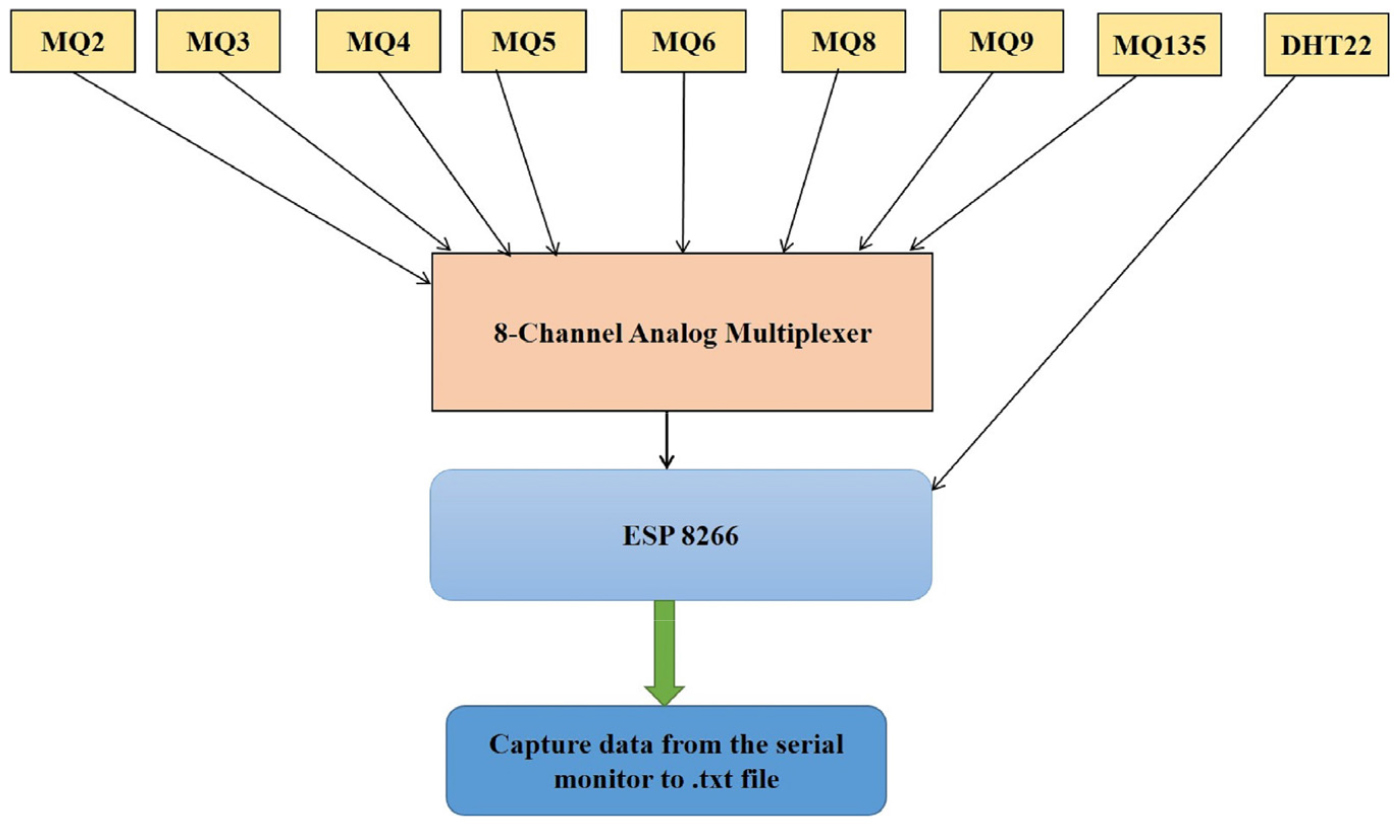
The E-Nose system used for data collection consists of an ESP8266 module, eight metal-oxide gas-detecting sensors, and a temperature and humidity sensor. The ESP8266 is favored for its cost-effectiveness and Wi-Fi connectivity capabilities, making it a popular choice for Internet of Things (IoT) projects. It is a highly integrated system-on-a-chip (SoC) that combines a microcontroller unit (MCU) with Wi-Fi functionality, enabling seamless device-to-internet connections and facilitating Wi-Fi-based project development. The dataset is gathered using eight metal-oxide gas-detecting sensors along with temperature and humidity measurements, as illustrated in Figure 1. The data collection setup includes a DHT22 sensor, as well as the sensors MQ2, MQ3, MQ4, MQ5, MQ6, MQ8, MQ9, and MQ135. We designed and constructed the experimental setup ourselves, as depicted in Figure 1.
We employed an eight-channel analog multiplexer to collect input from all eight gas sensors and connected it to the ESP8266 module. Additionally, we directly interfaced the temperature and humidity (DHT22) sensor with the ESP module, as illustrated in Figure 2. In our research, we simultaneously gathered a dataset using both Temperature and Humidity sensors (DHT-22) and eight MQ gas sensors. Figure 2 provides visual representations of the DHT-22 and the other sensors, aiding the reader in better understanding the sensors utilized in this study. The utilization of an 8-channel multiplexer in our system offers increased input flexibility, reduced hardware complexity, cost-efficiency, enhanced signal integrity, scalability, efficient data acquisition, compatibility, and energy efficiency, making it a favourable component in systems requiring multiple input selections and getting desired data.
Gas Sensor
To generate electrical signals, gas sensors differentiate between the presence of various gases. When it comes to gas sensors, those utilizing Metal Oxide Semiconductor (MQ) technology stand out as the optimal choice due to their compact size, cost-effectiveness, rapid responsiveness, and extended lifespan. The selectivity of the sensor is provided in Table 1. We used only the MQ Sensor of different versions like MQ2, MQ3, MQ5, etc. Numerous experiments have been conducted using these sensors, exploring their sensitivity as detailed in references [28, 29].
Table 1.
Sensor and specific gas
In the realm of gas analysis, a recent development is the Multimodal Gas Data, which consists of concurrent data samples acquired using a thermal imaging camera in conjunction with seven distinct MQ gas-detecting sensors, as elaborated in [30]. The sensor array facilitates real-time monitoring and analysis of dynamic systems or environments. It provides continuous data streams that can be analysed instantly, enabling prompt decision-making. Different sensors in an array capture various parameters that lead to better gas/ odor classification. This diversity in data collection enables comprehensive monitoring, capturing multiple facets of the monitored environment or system simultaneously. The responses of these gas sensors have been systematically characterized by several researchers, with select findings presented in references [31, 32, 33, 35].
Data Collection
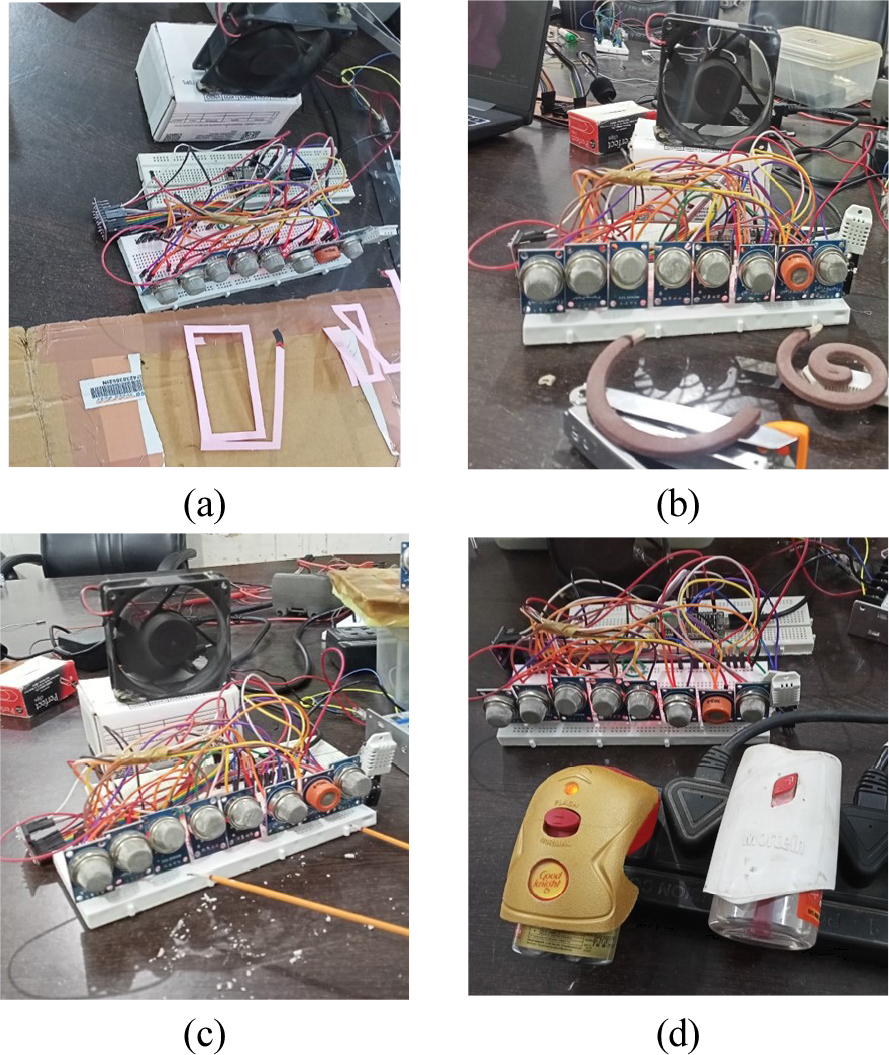
In this study, we utilized a variety of commercially available insect repellents, such as coils, sprays, incense sticks, and liquids, to assemble our dataset. During the experiment, multiple gas sensors were positioned 1 mm apart from each other and exposed to various compounds. The system was operated for 25 minutes, allowing it to be exposed to these substances, resulting in the collection of data for all the different classes. In this experiment, we used four mosquito repellents to create four classes and one class is for air. Good Knight fast card, Hit mosquito repellent, incense sticks, and mosquito coil.
To begin, we obtained baseline data by running the machine in a fresh-air environment. Subsequently, we collected data for Good Knight fast card, Hit mosquito repellent, incense sticks, and mosquito coil in a manner similar to that used for Fast Card. For instance, data for Good Knight Fast Card was acquired by burning it in close proximity to the sensors, while data for Hit Mosquito Repellent was obtained by spraying it at regular intervals toward the sensor array. We partitioned the gas dataset into two sets, with 70% of the data reserved for model training and the remaining 30% for model testing. Figure 3 provides a comprehensive depiction of all the data collection procedures and methods.
A. Data Standardization
Due to variations in sensitivity among the sensors, they produced outputs within different ranges, despite all having an output range of 0 to 1023. To address this variability, we standardized the features by transforming the mean to zero and the variance to one. The calculation of the standard score is outlined in Equation 1.
B. Building Model for Classification
To construct the model, we first partitioned our dataset into training and testing subsets, opting for a 70:30 ratio. Prior to this division, we ensured the dataset was thoroughly shuffled, guaranteeing that both the training and testing sets would contain a well-balanced representation of all data types. For training purposes, we partitioned the dataset into two sets, with 70% of the data reserved for model training and the remaining 30% for model testing. Only 70% of the data were used for training purposes and rest for the testing.
Results and Discussion
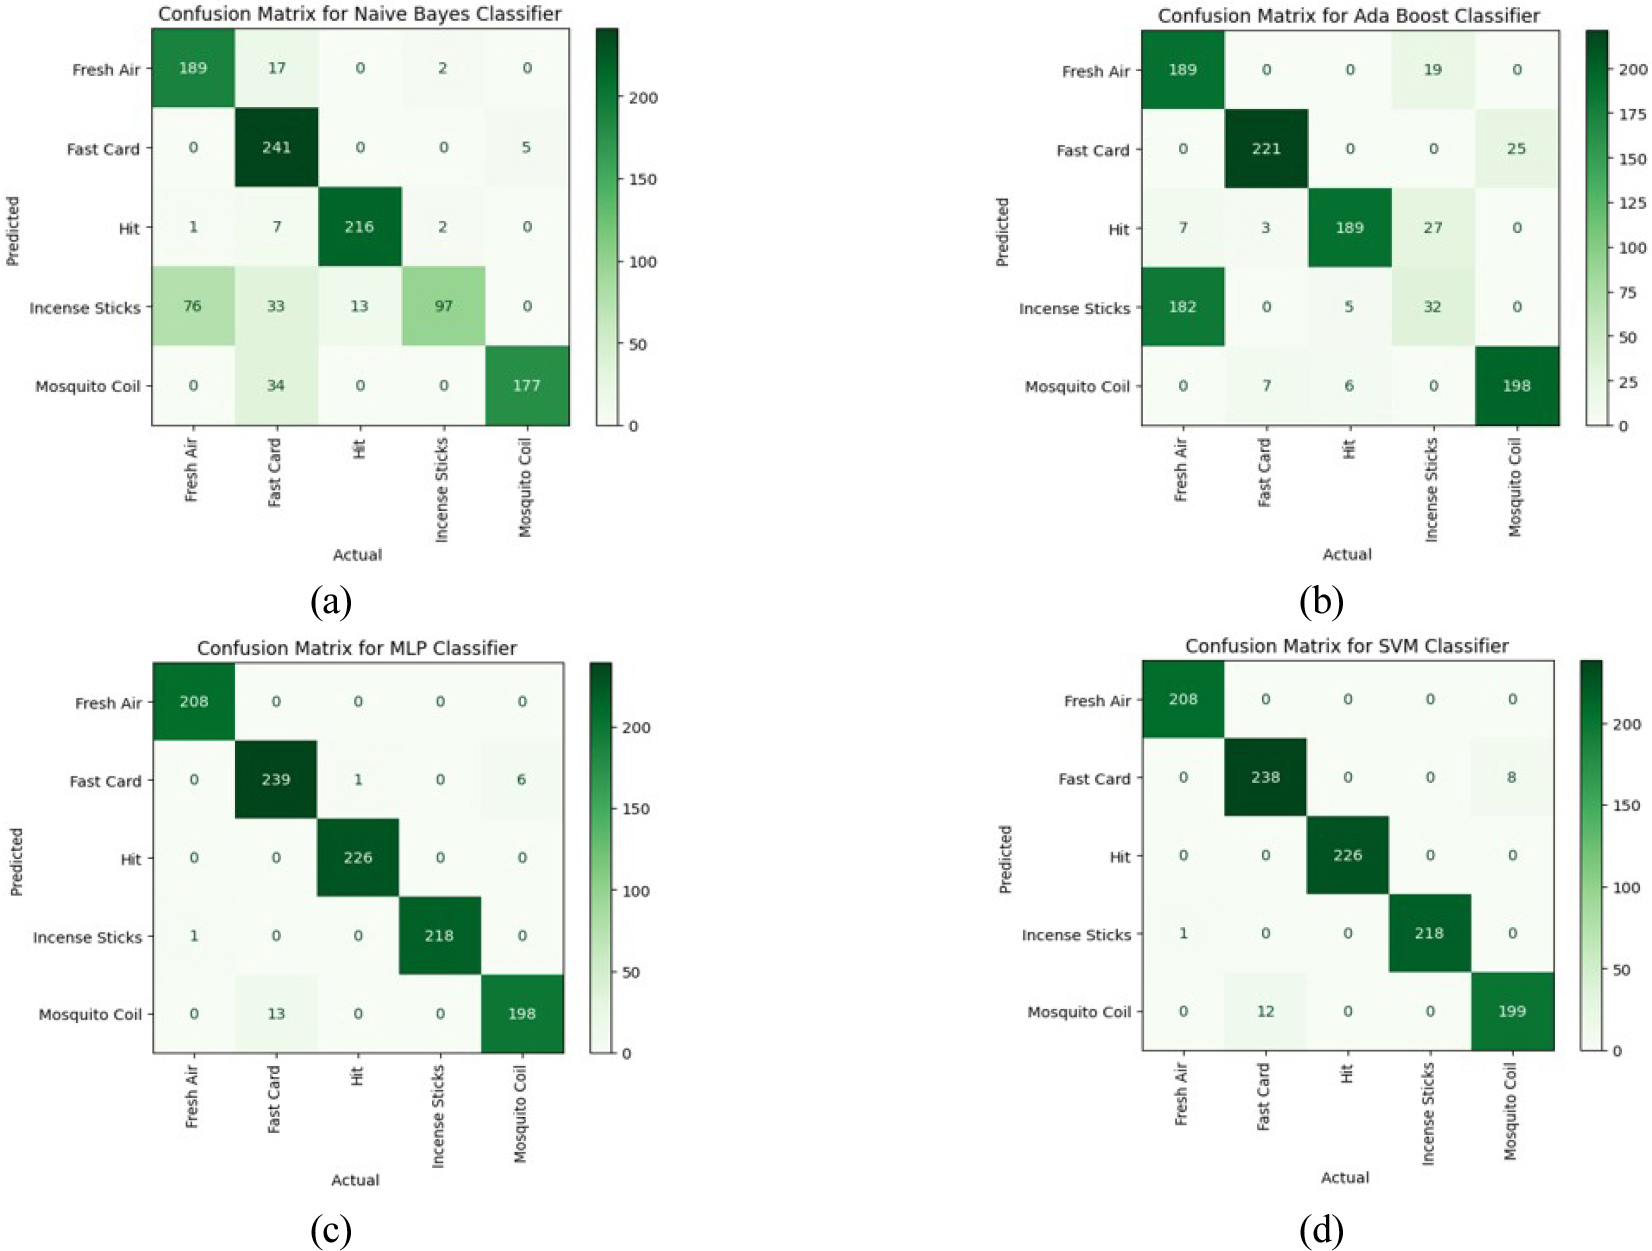
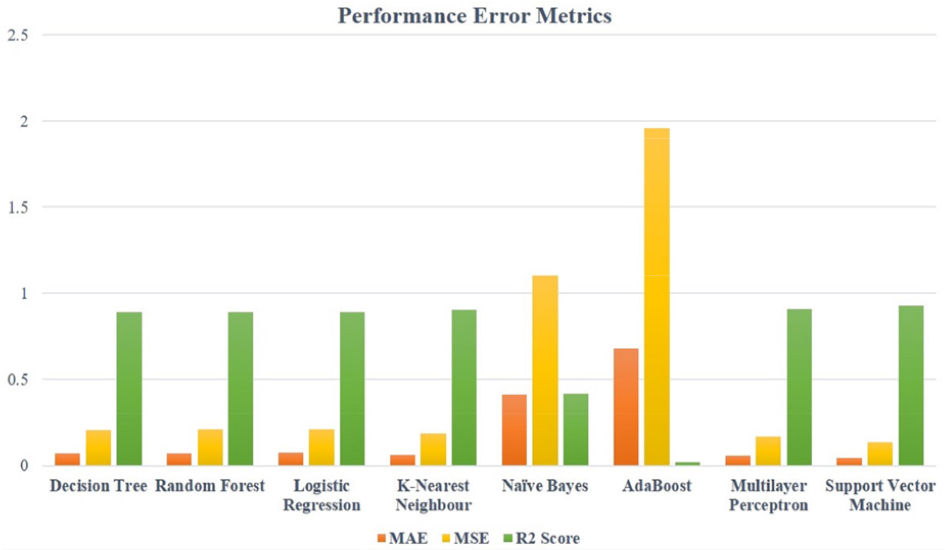
We evaluated the performance of eight different ML algorithms on our training set by comparing their Mean Absolute Error (MAE), Mean Squared Error (MSE), and R2 Score. Among these eight algorithms, the MLP and SVM algorithms demonstrated the lowest error, making them the most suitable choices for our classification problem. Additionally, both the MLP and SVM achieved high accuracy scores of 98.10 and 98.01, respectively. We also examined the Confusion Matrix for each classifier.
Our dataset consists of responses from eight MQ sensors in an E-Nose, recording the reactions of these sensors. Figure 4 illustrates the sample responses obtained from the considered sensors (using histogram plot). This dataset includes 3700 examples of averaged sensor responses, collected from various tin oxide gas sensors placed in a room. The target values range from 0 to 4, corresponding to different sensor outputs. The dataset comprises 3700 entries, numbered from 0 to 3700, and has 10 data columns.
The E-Nose used in this study incorporates multiple non-selective MQ sensors connected in series. The data was collected using our custom-developed DMS (Data Measurement System) designed exclusively for this research. The entire programming and model-building process was carried out on an ML platform, where we imported the sci-kit-learn (sklearn) module for linear regression (LR), decision tree (DT), random forest (RF), k-nearest neighbors (KNN), Naive Bayes (NB), AdaBoost (AB), MLP, and SVM. We calculated various performance metrics to assess the classifiers’ performance.
Confusion Matrices (CM)
A Confusion Matrix (CM) is a square matrix that compiles the model’s anticipated and real classifications when applied to a test dataset. This matrix offers valuable insights into the model’s performance by breaking down the various types of correct and incorrect predictions it makes. In the context of a specific study on predicting energy efficiency for CO2 performance in a building [34], the CM serves as a straightforward tool to evaluate the classification algorithm’s effectiveness. Additionally, it plays a pivotal role in determining essential parameters like precision score, recall score, and F1 score, as depicted in equations 2 to 4. Numerous researchers have leveraged smart sensors and machine-learning models for informed decision-making [35, 36, 37, 38, 39]. In [35], the author demonstrated the CM’s utility in appraising the model’s performance.
In classification tasks, the primary function of a CM is to furnish a comprehensive and lucid summary of a classification model’s performance. It assumes the form of a table, aiding in the assessment of a classifier’s accuracy and efficacy by revealing how closely the model’s predictions align with the actual class labels in the dataset. The CM proves particularly beneficial for discerning the types of errors made by a classifier and for gauging its overall performance. Typically, a CM for a binary classification task comprises four primary components, as outlined below:
True Positives (TP):These represent cases where the model made accurate predictions for the positive class. Put simply, the real class was positive, and the model correctly identified it as such.
True Negatives (TN): In these instances, the model accurately predicted the negative class. The actual class was indeed negative, and the model correctly classified it as such.
False Positives (FP):Also known as Type I errors or “false alarms,” these are situations where the model incorrectly classified cases as the positive class when they were actually part of the negative class.
False Negatives (FN):Termed as Type II errors, these are scenarios where the model inaccurately predicted the negative class when, in reality, the cases belonged to the positive class.
The accuracy of the model, encompassing both true positives (TP) and true negatives (TN), can be described as the proportion of accurately predicted instances among all instances. Precision, denoted as TP / (TP + FP), gauges the model’s ability to avoid false positives, offering insight into its accuracy. Recall, also known as sensitivity or true positive rate, is the proportion of true positives to all actual positives (TP / (TP + FN)), indicating the model’s ability to detect all relevant events. The F1-score, a harmonic mean of precision and recall, strikes a balance between these two metrics, particularly valuable when dealing with imbalanced class distributions in the dataset.
Specificity, expressed as the genuine negative rate (TN / (TN + FP)), quantifies the model’s capacity to identify all relevant non-positive instances. On the other hand, the false positive rate (FPR), calculated as FP / (TN + FP), measures the model’s propensity to generate false alarms, specifically in relation to actual negatives.
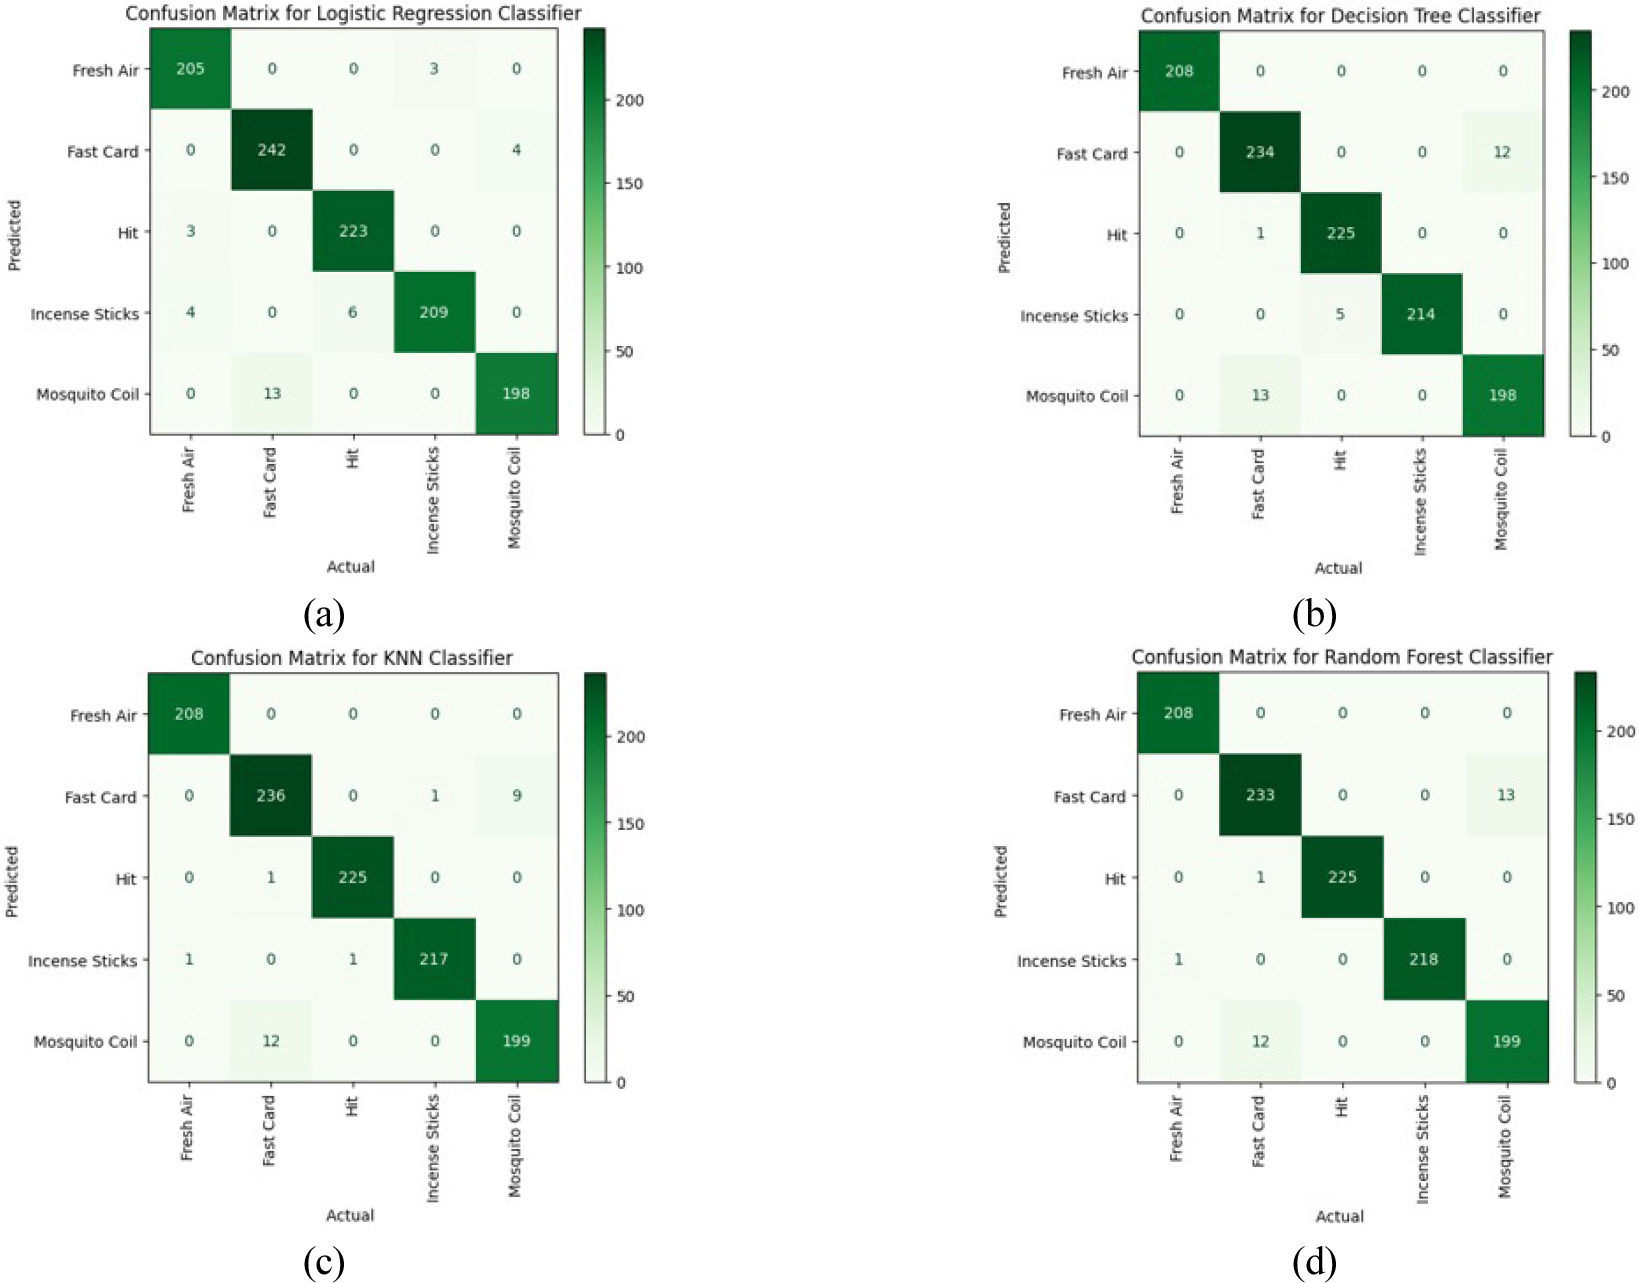
Observations from Figures 5(a), (b), (c), (d), and Figures 6(e), (f), (g), (h) reveal the performance of the classifier employed in this study in terms of its classification accuracy.
Logistic Regression (LR) Classifier
The LR classifier is a widely used statistical model that addresses both classification and regression problems, making it a popular choice for categorization tasks. With the LR classifier, observations can be grouped into two or more distinct classes, resulting in a discrete target variable. These classes can take different forms, including binomial and multinomial.
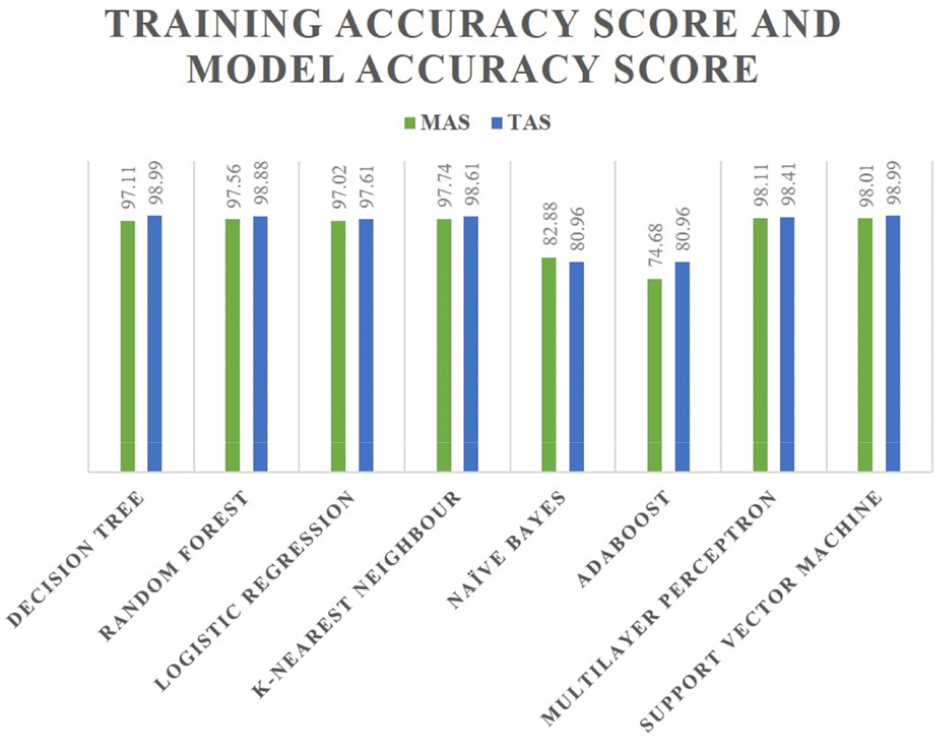
Referring to Table 2, the LR classifier achieved an impressive accuracy of 97% for mosquito-repellent classifications. Additionally, it obtained a Training Accuracy Score (TAS) of 97.60% and a Testing Accuracy of 97.02%. The Testing Accuracy Score is also commonly referred to as the Model Accuracy Score (MAS).
Table 2.
LR Classifier performance
Decision Tree (DT) Classifier
One of the widely used methods in ML for tackling classification and regression tasks is the decision tree (DT) algorithm. This supervised learning approach involves constructing a tree-shaped model, where each internal node corresponds to a feature or attribute, each branch represents a decision rule, and each leaf node signifies the predicted outcome or value.
In Table 3, the assessment of mosquito repellent classifications resulted in a 97% accuracy for the DT classifier, a 98.99% TAS, and a testing/MAS of 97.11%. The proposed technique is expected to offer a passenger mobility assessment system based on intelligent amenities like smart construction and safety [21].
Table 3.
DT Classifier performance
Random Forest (RF) Classifier
Random Forest (RF), an ensemble learning method, leverages multiple decision trees to generate predictions. It enjoys widespread popularity in ML for both classification and regression tasks.
In Table 4, the assessed mosquito repellents achieved impressive results with an RF classifier accuracy of 98%, a TAS of 98.99%, and a testing/MAS of 97.11%. Additionally, a time series dataset was examined to forecast sensor data values in references [40, 41].
Table 4.
RF classifier performance
K-Nearest Neighbour (KNN) Classifier
K-Nearest Neighbours (KNN) stands out as a popular and uncomplicated method in the realm of ML, commonly employed for both classification and regression tasks. This instance-based, non-parametric learning approach makes predictions by gauging the similarity between new data points and labeled examples from the training dataset.
In the context of mosquito repellent classifications, Table 5 reveals that the KNN classifier exhibited an impressive accuracy of 98%, with a TAS of 98.61% and a testing/MAS of 97.74%.
Table 5.
KNN classifier performance
Naïve Bayes (NB) Classifier
A widely employed classification technique, Naive Bayes, leverages the Bayes theorem and assumes feature independence. This uncomplicated yet potent approach is commonly used in tasks such as text categorization, spam filtering, sentiment analysis, and other domains where the input data consists of discrete or categorical components.
In the context of evaluating mosquito repellent classifications, we observed an 83% accuracy for the KNN classifier, a TAS of 80.96%, and a Testing/MAS of 82.88%, all of which are documented in Table 6. Furthermore, the testing/model accuracy score reached 97.74%, the classifier accuracy was 98%, and the TAS achieved 98.61%.
Table 6.
Performance of Naïve Bayes classifier
Ada Boost (Adaptive Boosting) Classifier
AdaBoost, also known as Adaptive Boosting, is a popular ensemble learning method commonly used in classification tasks. It effectively combines multiple weak classifiers into a robust and accurate strong classifier through a boosting process. AdaBoost assigns weights to each data point in the training set, and it iteratively adjusts these weights to emphasize the challenging instances in the classification.
In the context of mosquito-repellent classifications, the AdaBoost classifier achieved an accuracy of 75%. Additionally, it attained a TAS of 80.96% and a testing/MAS of 74.68% (as depicted in Table 7).
Table 7.
Performance of AdaBoost classifier
Multilayer Perceptron (MLP) Classifier
A multilayer perceptron (MLP), a specific type of artificial neural network (ANN), consists of multiple layers of interconnected nodes, also referred to as perceptrons. In a feedforward neural network, information flows from the input layer, passes through one or more hidden layers, and reaches the output layer. MLPs are commonly used in tasks involving classification and regression.
In Table 8, the study reported an MLP classifier’s accuracy of 98%, a TAS of 98.41%, and a testing/ MAS of 98.10% when evaluating various mosquito repellents.
Table 8.
Performance of MLP classifier
Support Vector Machine (SVM) Classifier
Support Vector Machine (SVM), a powerful supervised ML method, finds application in both classification and regression tasks. It demonstrates exceptional performance in managing high-dimensional data and creating a clear separation between different classes.
The results in Table 9 show that the SVM classifier achieved an accuracy of 98%, with a TAS of 97.99% and a Testing/Model Accuracy Score of 98.01% when evaluating various mosquito repellents.
Table 9.
Performance of SVM classifier
Figure 7 and Table 10 present a comparative analysis of eight classifiers that were assessed.
Table 10.
Comparison of MAS and TAS of different classifiers
The findings indicate that the classifiers MLP and SVM exhibited promise in terms of the MAS, while RF and DT produced accurate classification results that showed potential for differentiating among the four types of mosquito repellents and the fresh air response. Mean Absolute Error (MAE), Mean Squared Error (MSE), and R2 Score along with the confusion matrix are used for the performance evaluation metrics. The performance of these classifiers is evaluated using various metrics presented in Figure 8 and Table 11. To assess the classifier’s performance, we employed three distinct metrics: Mean Absolute Error (MAE), Mean Squared Error (MSE), and R2 Score.
Table 11.
Comparison of performance evaluation metrics of considered classifiers
Conclusion
Consequently, we assessed various machine-learning techniques, achieving remarkable accuracy in the process. When applied to the task of classifying insect repellents, ML algorithms have shown promising outcomes. It is viable to gauge the effectiveness of mosquito repellents accurately by leveraging multiple features and training the model on labeled data. It is essential to underscore that the quality and representativeness of the training data play a pivotal role in determining the effectiveness of the classification model. To yield precise classification results, it is imperative to possess a diverse and comprehensive dataset that encompasses various insect repellents, environmental factors, and efficacy measurements. Furthermore, the latest research and advancements in ML methodologies offer opportunities to enhance the precision and efficacy of classification models for mosquito-repellent products. By combining state-of-the-art algorithms, feature selection techniques, and ensemble methods, these models can be enhanced to produce even more accurate predictions. As a result, our proposed approach exemplifies an advanced and cost-effective system for monitoring mosquito repellents in both residential and workplace settings. Through the utilization of our suggested E-Nose, we have demonstrated the attainability of accurate mosquito repellent classification. This system is not only affordable and straightforward but also IoT-capable. Consequently, it can be integrated into pandemic prevention initiatives and smart city scenarios. The establishment of an IoT network for simultaneous monitoring over a broader area is also within the realm of possibility. In summary, the utilization of ML algorithms for the categorization of insect repellents proves to be a valuable approach, aiding individuals in making informed decisions about practical mosquito protection. By harnessing the potential of data and sophisticated algorithms, we can enhance our understanding of mosquito repellent effectiveness, ultimately contributing to the development of more efficient and reliable solutions in the future.


