

Introduction
Literature Review
Material and Methodology
Analysis of Green Building Program Data
Derivation of Required Factors through On- Site Investigation
Derivation of Evaluation Conditions and Thermal Properties
Analysis of Energy Performance in the Green Building Program
Result
Discussion
Conclusions
Introduction
In recent years, the world has experienced record-breaking heat waves, floods, and other extreme weather events, with severe global warming further intensifying the urgency of climate crisis mitigation and the paradigm of carbon neutrality [1]. In particular, carbon reduction in the building sector is of critical importance, as it is where people spend the majority of their daily lives. In South Korea, more than 50% of the national building stock is over 20 years old, indicating a significant prevalence of aging structures [2]. As a government-level strategy to achieve carbon neutrality in the building sector, both the 2050 Carbon Neutral Roadmap for Land and Infrastructure (2021) and the Five-Year National Plan for State Affairs (2025) highlight green remodeling as a key policy instrument [3, 4]. Accordingly, various local governments have been implementing support programs—such as tax incentives and interest subsidies—to improve the energy performance and residential environment of aging buildings [5].
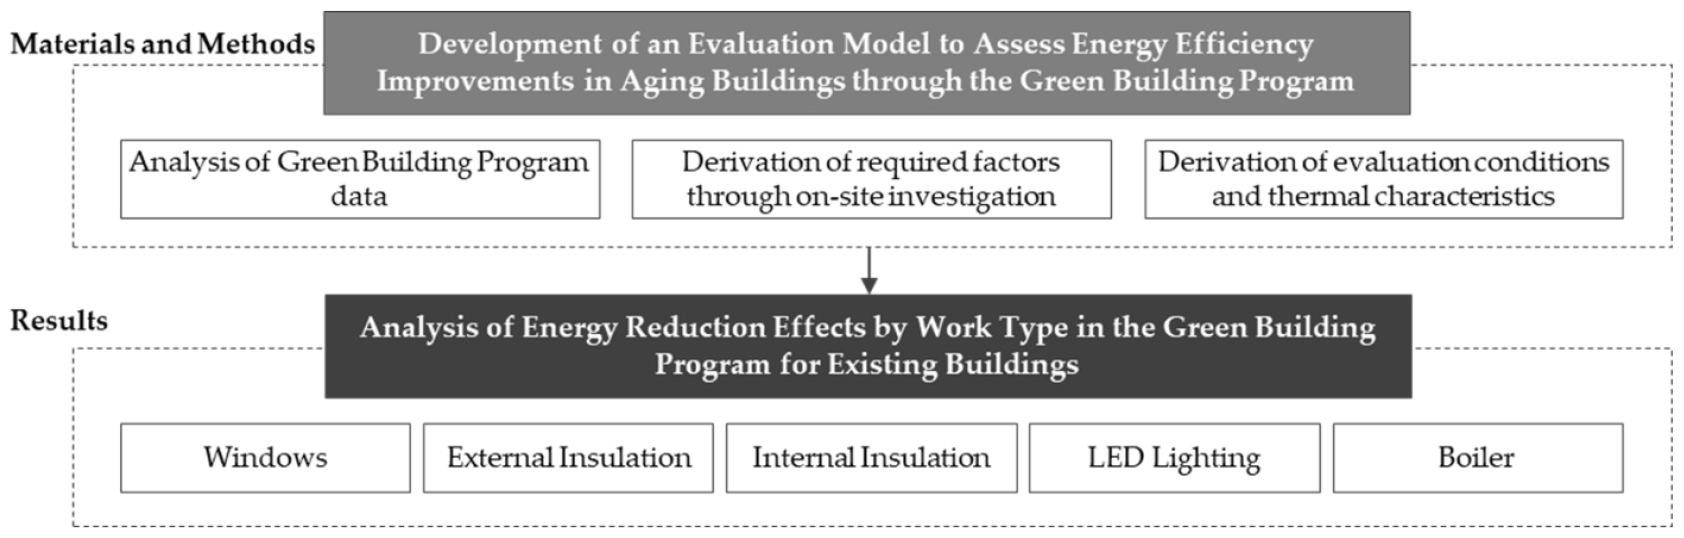
Against this background, the present study aims to analyze the effectiveness of energy performance improvements achieved through green remodeling, focusing on Suwon City’s Green Building Promotion Support Program (hereafter referred to as the Green Building Program), a representative municipal initiative in South Korea. To this end, an evaluation model for energy performance assessment was first developed. This model was constructed by analyzing data from completed Green Building Program projects and conducting field surveys to derive building typologies, year of completion, and thermal properties, with additional factors supplemented through a literature review. Based on this evaluation model, the study examined the energy-saving effects of five supported construction categories—window replacement, external insulation, internal insulation, LED lighting, and boiler replace ment—using the ECO2 simulation tool. The overall research flow is illustrated in Figure 1.
Literature Review
Building energy performance simulation tools are generally classified into static and dynamic categories. Representative examples include TRNSYS and EnergyPlus from the United States, PHPP from Germany, and ECO2 from South Korea [6, 7].
TRNSYS, developed at the University of Wisconsin, is a dynamic simulation tool based on the ASHRAE transfer function method. It provides high accuracy in HVAC system analysis and flexibility for developing new components, but remains complex to operate due to extensive data input requirements. As a result, evaluation periods are prolonged and results can vary depending on the evaluator’s expertise. Despite these limitations, it is widely used by HVAC-focused companies and research institutes [8].
EnergyPlus, developed by the U.S. DOE, is another highly regarded dynamic simulation program capable of calculating heat transfer using the transfer function or finite difference methods. It models energy consumption by accounting for interactions between the building envelope, mechanical systems, and plant components. Its modular, open-source structure enhances flexibility, but the requirement for large data inputs similarly introduces variability in results [6, 7].
The Passive House Planning Package (PHPP), created by the Passive House Institute in Germany, is a static (monthly method) tool based on ISO 13790 and DIN V 18599. Simpler than TRNSYS and EnergyPlus, it is efficient for estimating energy demand in line with global zero-energy initiatives. Operating on Excel, PHPP provides climate data for selected regions in North America and Europe, but lacks coverage for Asia and the detail of dynamic simulations [6, 7].
ECO2, officially recognized in South Korea, is also based on ISO 13790 and DIN V 18599 and distributed by the Korea Energy Agency. It calculates energy demand using monthly weather data, integrating system performance to provide end-use results such as heating, cooling, hot water, lighting, and ventilation [9]. Although less detailed than dynamic tools, ECO2 produces analytical patterns similar to dynamic models, requires fewer inputs, and offers a user-friendly interface. It is applied in national certification schemes, including Zero Energy Building Certifications (ZEB), as well as the Green Remodeling Program for existing buildings [10]. Key features of ECO2 used in this study are summarized in Table 1.
Table 1.
Key Features of the Selected Energy Simulation Software (ECO2)
Material and Methodology
Analysis of Green Building Program Data
Since 2013, Suwon City has annually allocated more than KRW 1 billion, amounting to a cumulative total of approximately KRW 9.6 billion by 2021, to operate the Green Building Program. Between 2016 and 2021, a total of 1,951 projects were supported under this program, covering five categories of improvement works: window replacement, internal insulation, external insulation, LED lighting, and boiler replacement. Among these, detached houses accounted for the largest share, with 1,343 cases (68.84%), which is likely attributable to the relative ease of scheduling and the minimal disruption to neighboring households compared with multi-family dwellings such as apartments and row houses.
Therefore, this study aims to analyze the energy- saving effects of detached houses, which received the largest share of support under the Green Building Program. To this end, Suwon City’s empirical data were examined to identify the key factors influencing building energy performance, and the results are summarized in Table 2[11].
Table 2.
Cases of Suwon City’s Green Building Program, 2016–2021
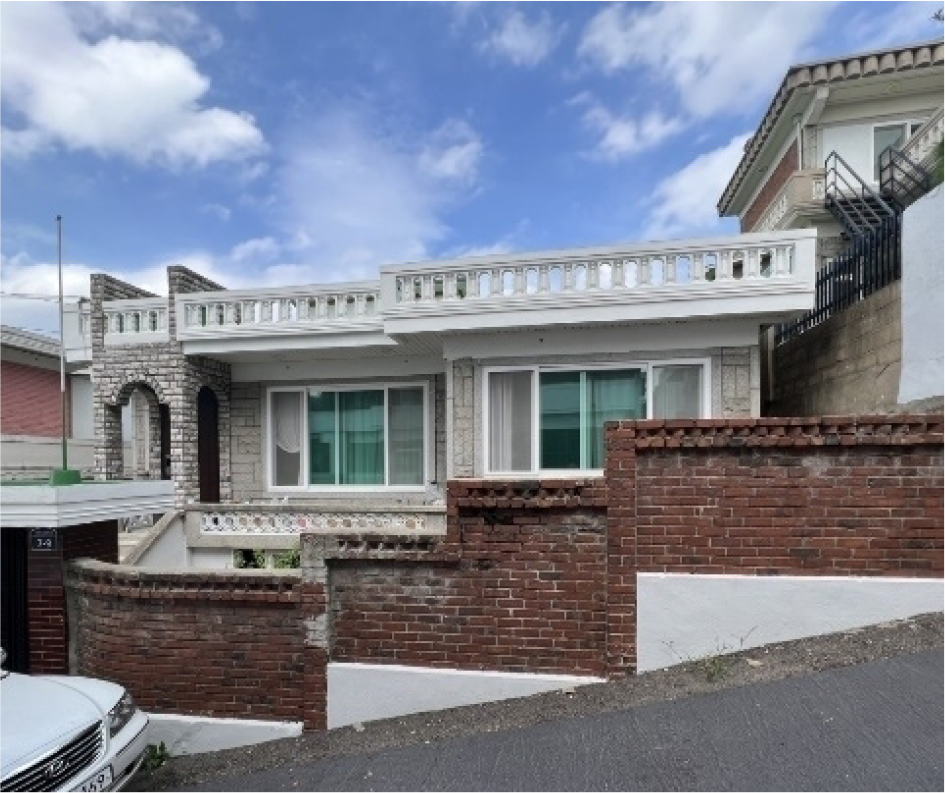
Derivation of Required Factors through On- Site Investigation
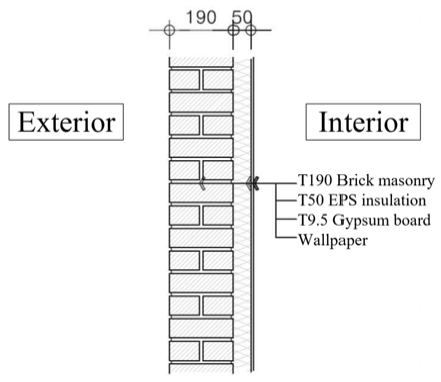
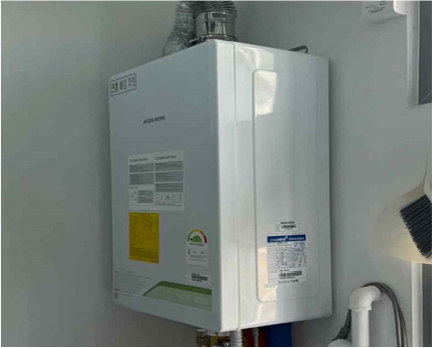
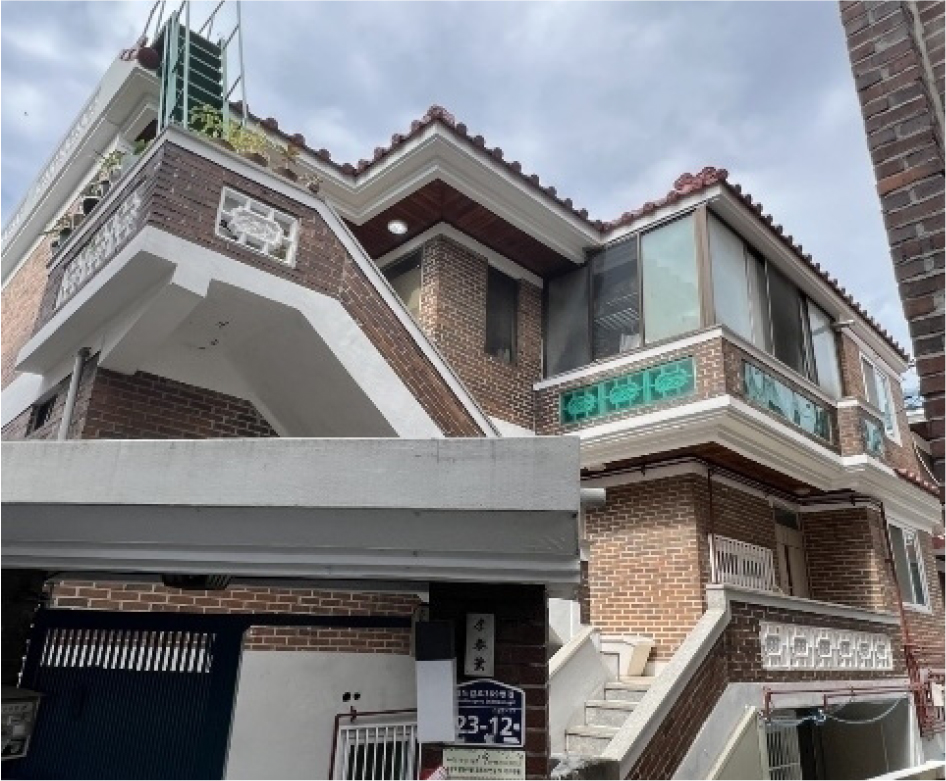
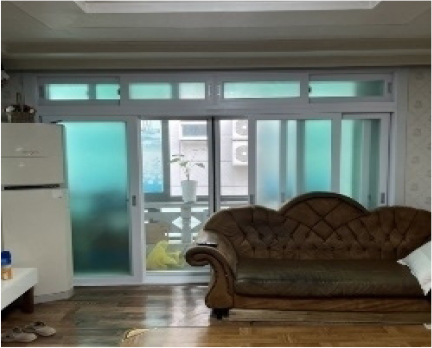
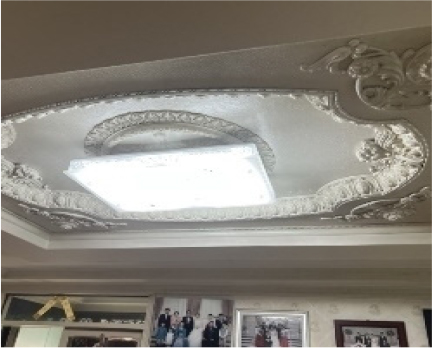
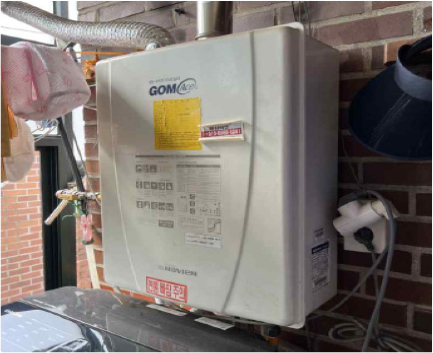
An on-site investigation was conducted on detached houses (including multi-household and single-family dwellings) that benefited from Suwon City’s Green Building Program. According to the survey results categorized by construction type under the Green Building Program, PVC double-glazed windows with 22 mm insulated glazing units were applied for window replacement, and bead-type thermal insulation boards with a thickness of 50 mm (THK50) were applied for thermal insulation work. Regardless of whether they received support from the Green Building Program, many households were found to have replaced lighting fixtures with LEDs and upgraded boilers. Interviews with residents revealed that these replacements were often carried out independently due to aging or malfunction of the existing lighting and boilers. The results of the on-site investigation for buildings supported by Suwon City’s Green Building Program are presented in Table 3.
Table 3.
Case of Green Building Program Application in Detached Houses


Derivation of Evaluation Conditions and Thermal Properties
From 2016 to 2021, Suwon City’s Green Building Program supported a total of 1,951 projects, of which 1,343 (68.84%) were detached houses—the primary focus of this study. Conducting a detailed energy consumption analysis for each dwelling would have required excessive time and human resources. To address these practical constraints, an evaluation model was developed that integrated building typology, thermal properties, and mechanical system specifications to estimate pre- and post-renovation energy consumption. Given the time limitations, restricted resources, and the fact that most target houses were occupied during the evaluation period, simulation- based energy modeling was adopted for the analysis [12].
In this framework, supported buildings were classified by key characteristics, and representative models were established by incorporating building form, thermal performance, and mechanical systems [13]. These models were then used to analyze energy consumption based on statistical data provided by Suwon City [11]. The dataset included the year of support, applicant information, building location, legal use classification, number of floors, structural type, floor area, and year of completion. To ensure representativeness and enable a rational analysis, classification was organized by building use, construction period, and building size [14].
Applicant personal information—irrelevant to energy performance—was excluded, as were structural type variables with only marginal effects. Location data were also omitted since all projects were situated within Suwon and thus subject to identical meteorological conditions. For the energy performance analysis, 1979 was selected as the benchmark year, marking the introduction of South Korea’s Energy Conservation Design Standards. Accordingly, detached houses built before 1979 and those completed in 1980 or later were separately classified [15]. The morphological characteristics and evaluation conditions of the detached house models applied in Suwon City’s Green Building Program are summarized in Table 4.
Table 4.
Evaluation Conditions and Thermal Properties of the Evaluation Model
Analysis of Energy Performance in the Green Building Program
The types of construction materials and equipment used in each project were selected based on the unit cost by work type specified in the Suwon City Green Building Program [11]. The performance of the materials and equipment was assumed to correspond to the average data from the Energy Efficiency Management Equipment database and to comply with KS certification standards. The following presents the thermal properties and evaluation assumptions for each type of construction work.
For window installations, PVC double glazing with T22 insulated glass was applied. The thermal transmittance (U-value) was assumed to be the average U-value of 201 identical window configurations registered in the Energy Efficiency Management Equipment database of the Korea Energy Agency. Additionally, the solar heat gain coefficient (SHGC) for transparent components was set based on the values by glass thickness specified in Annex Form 1 of the “Energy Saving Design Standards for Buildings” issued by the Ministry of Land, Infrastructure, and Transport [13].
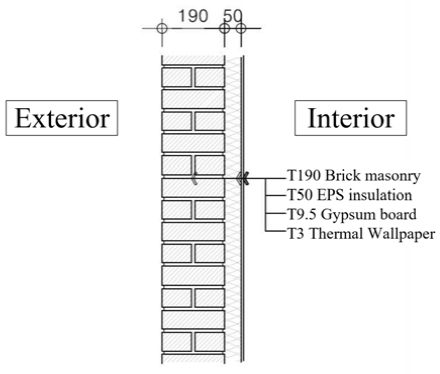
For internal insulation works, Type 1 expanded polystyrene (EPS) board and gypsum board were applied. The insulation installed under the Green Building Program was assumed to meet KS standards, and the thermal conductivity was set at 0.036 W/m·K, in accordance with KS M 3808. For external insulation works, phenolic foam boards (PF boards) were used, and the thermal conductivity was assumed to be 0.020 W/m·K, corresponding to the average level of commercially available phenolic boards [16].
For lighting (LED), it was assumed that the living room’s 36W three-lamp fluorescent fixtures were replaced with 50W LED fixtures, and the bedroom’s 32W two-lamp fluorescent fixtures were replaced with 25W LEDs. For gas boilers, it was assumed that outdated conventional gas boilers were replaced with new units. The changes in thermal properties by work type under the Green Building Program are presented in Table 5.
Table 5.
Improvement rates by construction type through the Green Building Program
As shown in Table 5, the improvement ratios by construction type under the Green Building Program indicate that for detached houses built before 1979, the improvements were 80.7% for external insulation, 74.2% for windows, 62.3% for lighting, 60.7% for internal insulation, and 2.4% for boilers. For detached houses completed in 1980 or later, the corresponding values were 69.8% for external insulation, 69.2% for windows, 62.3% for lighting, 46.0% for internal insulation, and 2.4% for boilers.
When considering only the individual improvement ratios by construction type, the order of effectiveness was external insulation, windows, lighting, internal insulation, and boilers, regardless of construction year. However, when assessed in terms of thermal transmittance (U-value), external insulation achieved the highest relative improvement (0.898 W/m²·K), whereas windows exhibited a significantly larger absolute reduction of 3.71 W/m²·K. This finding highlights the need for building-level energy performance evaluations through simulation, which can incorporate absolute values of thermal transmittance rather than relying solely on relative improvement ratios.
Result
The analysis revealed that window replacement provided by far the most significant energy-saving effects across both construction periods. In detached houses built before 1979, heating energy demand decreased by approximately 31.4% and cooling demand by 20.8%, while in those built after 1980, heating demand was reduced by 24–26% and cooling demand by more than 25%. These reductions are attributable to improvements in thermal transmittance, solar heat gain control, and airtightness of the building envelope, confirming that window performance plays a decisive role in overall energy efficiency.
Insulation measures showed somewhat different effects depending on the construction year. For external insulation, heating energy demand decreased by more than 18% in pre-1979 houses and by more than 12% in post-1980 houses. However, cooling demand increased by approximately 8% and 5%, respectively, due to the heat-retention effect of insulation. Internal insulation yielded reductions of more than 13% in heating demand for older houses and 7–8% for newer houses, while cooling demand rose by about 6% and 3%. Although insulation occasionally increased cooling loads during summer, these increases were outweighed by the larger reductions in winter heating demand, demonstrating its overall benefit for year-round energy performance.
Lighting replacement demonstrated consistent results across both periods. Cooling energy demand decreased by more than 6% and lighting energy consumption by over 62%. Heating demand rose slightly—about 1.5% in pre-1979 houses and 2% in post-1980 houses—because reduced waste heat from LED lighting lowered incidental winter heat gains. Nevertheless, the impact was minimal compared with the overall benefits, indicating that lighting replacement still provided a net positive effect.
Boiler replacement produced modest but measurable benefits. Heating energy demand was reduced by 4–8% and hot water demand by more than 2% in both construction groups. However, primary heating energy demand increased by about 8.3% in both groups, a result of changes in the efficiency characteristics of upgraded boilers. This indicates that while newer boilers reduce direct energy consumption, the calculation of primary energy may reflect different weighting factors or operational characteristics, slightly offsetting improvements observed at the end-use level.
Overall, the ranking of effectiveness was largely consistent across the two construction periods, though with minor variations. In pre-1979 houses, the order was windows, external insulation, internal insulation, boilers, and lighting, while in post-1980 houses, the order was windows, external insulation, boilers, internal insulation, and lighting. Taken together, these results confirm that improvements to the building envelope—particularly window replacement—offer the most substantial and reliable savings, regardless of building age. They also highlight the value of targeted retrofit strategies, where prioritizing durable, high-impact measures can maximize efficiency outcomes. The energy-saving effects of each construction type are summarized in Table 6.
Table 6.
Analysis of Energy-Saving Effects through the Green Building Program
Discussion
As this study focused on the Korean Green Building Program case, the analysis was conducted using the ECO2 program, which is employed in the national Zero Energy Building (ZEB) certification administered by government agencies. However, ECO2 has methodological limitations that must be recognized. As a quasi–steady-state program, it is constrained in capturing dynamic variations in indoor environmental conditions, occupancy schedules, and HVAC system interactions. The reliance on statistical user profiles further limits its ability to reflect diverse operational behaviors, while the absence of hybrid or mixed-mode ventilation modeling narrows its applicability in buildings where natural and mechanical strategies coexist.
To address these structural issues, future research should consider two complementary directions. First, coupling ECO2 with dynamic simulation tools would enhance temporal resolution and provide more accurate modeling under varying conditions. Second, empirical validation through direct comparison of energy consumption before and after improvement works would yield more robust evidence of actual savings. By integrating simulation-based modeling with empirical data, subsequent studies can overcome ECO2’s methodological shortcomings and produce results that are both reliable and internationally comparable.
In addition, Interviews conducted during on-site investigations provided further practical insights. Residents frequently reported that lighting and boilers were replaced independently, as these systems are relatively inexpensive, easy to install, and characterized by short replacement cycles. Consequently, many households replaced them directly when aging or malfunction occurred, regardless of program support. These findings suggest that for a more sustainable and differentiated Green Building Program, policy support should prioritize building envelope components with long durability and high energy- saving potential, such as windows and insulation materials, which are less likely to be voluntarily replaced. Moreover, expanding the program to include additional categories, such as shading devices and renewable energy systems, could further strengthen its impact. Collectively, these insights highlight both the methodological refinements needed for simulation- based evaluations and the policy adjustments required to improve the effectiveness of municipal green building initiatives.
Conclusions
This study aimed to analyze the energy-saving effects of Suwon City’s Green Building Promotion Support Program to contribute to carbon neutrality in the building sector.
1.Between 2016 and 2021, a total of 1,951 projects were implemented, with detached houses accounting for 1,343 cases (68.84%); therefore, the analysis was focused on this building type.
2.An evaluation model for energy performance was developed using empirical program data and on- site investigations. For thermal performance, buildings were classified into those constructed before 1979, when insulation standards were first introduced, and those built thereafter.
3.Analysis of the five supported construction types (windows, internal insulation, external insulation, lighting, and boilers) showed that external insulation and windows had the highest relative improvement, while windows achieved the greatest absolute reduction in thermal transmittance. This highlights the need for building-level simulations that reflect absolute thermal performance.
4.The ECO2 analysis indicated that windows achieved the highest energy savings (19.40%–20. 86%), followed by external insulation (6.40%–12.04%), internal insulation (4.26%–9.13%), lighting (4.48%–6.88%), and boilers (1.56%–1.77%).
5.Except for lighting, all improvements were more effective in houses built before 1979; in contrast, lighting produced lower savings due to reduced internal heat gains from efficient fixtures, which increased winter heating demand.
In summary, prioritizing envelope components—particularly windows and insulation—delivers the most substantial energy savings and provides key insights for strengthening municipal green building programs. Future research should address ECO2’s limitations by linking it with dynamic simulation tools and validating results against actual energy consumption data, thereby enhancing the robustness and international relevance of findings.
