

Introduction
Background
Existing Research
Methods in This Study
Chloride Ingression into Cracked Concrete
Chloride Ingression Model
Service Life Evaluation
Case Studies
Conclusions
Introduction
Background
Chloride-caused corrosion is a major durability problem for marine concrete which causes various unwanted effects on seaside concrete structures, for example reductions within the mix sectional section of steel rebar, reductions in loading resistance, and concrete cover cracking. In addition, because of evitable cracks and climatic change, the rates of chloride ingress and steel corrosion both increase, consequently producing a reduction in the service existence from the concrete structures. Therefore, it is vital for durability style of seaside concrete structures to think about the results of both climatic change and cracks [3,12].
Existing Research
Fundamental studies have been done about chloride ingress of concrete considering cracks. Song et al. [11] pro-posed an integrated model considering chloride ingress, oxygen diffusion, and crack development of structural concrete. One dimensional isotropic crack model was used to describe the influence of crack on oxygen transport. Kwon et al. [8] measured the chloride diffusion coefficient of cracked concrete and regressed the chloride diffu-sivity considering crack width. Bentz et al. [2] analyzed chloride ingress into concrete considering the effect of steel rebar or equal size cracks. Wang and Zhang [16] made two dimensional finite element analysis of chloride ingress into concrete with different crack patterns, such as equal size crack or tapered crack. Zhao and Yun [18] analyzed chloride ingress considering random distribution of corrosion cracking. Karhunen-Loéve (KL) expansion method was used to consider spatial random of cracks. Li et al. [7] made optimal maintenance design of cracked concrete structures in a marine port considering crack control width.
On the other hand, some models were proposed to consider the effect of climate change on chloride ingress. Medeiros-Junior et al. [9] evaluated service life of concrete considering the changing of temperature and relative humidity. The reduction of service life was calculated for different situations. Peng and Stewart [10] predicted the carbonation service life of concrete structures considering geography locations, CO2 concentration, temperature, and relative humidity. Bastidas-Arteaga [1] analyzed the service life of concrete bridge consi-dering cyclic loading under different environmental conditions. After considering cyclic loading, the service life reduces about 7%.
Methods in This Study
Although abundant studies have been performed about chloride ingression considering climate change, the previous studies do not consider the effect of sea level rise on chloride ingress. As sea level rises, the distance bet-ween concrete structures and coastline is shortened, and consequently the surface chloride concentration in-crea-ses. To overcome the weak points of previous studies, this study shows a model for analyzing chloride ingres-sion and service life considering cracks, temperature rise, and sea level rise. The reduction ratio of service life is calculated for different crack characteristics and different mixing proportions.
Chloride Ingression into Cracked Concrete
Chloride Ingression Model
The ingress of chloride into concrete closely relate to chloride diffusion coefficient. The apparent chloride diffu-sion coefficient is regressed based on depth-dependent chloride contents by Fick second law. Life365 program [5] collected the experimental results about apparent chloride diffusion coefficients of various concrete with diffe-rent water to binder ratios, different mineral admixture replacement ratios, and different water contents. Life365 program [5] proposed that the apparent chloride diffusion coefficient of concrete at 28 days Dref can be determined using water to binder ratio W/B of concrete as follows:

As the evolution of binder hydration, the porosity of concrete decreases and the chloride binding capacity increases. Consequently the chloride diffusion coefficient decreases with time as follows:

where m is the exponent to describe the reduction of chloride diffusion coefficient with curing age. Assuming that the initial chloride content is zero and chloride content at the surface, Cs, is constant, chloride concentration at different depth and exposure period can be expressed as follows:
where erf is the error function, Dm is the averaged diffusion coefficient. Dm can be calculated as follows [18]:


where  is the time limit for continuous hydration (
 =25 years).
For cracked concrete, chloride diffusion coefficient relates to sound concrete, crack width, crack interspace, and allowable maximum crack width. The equivalent chloride diffusion coefficient of cracked concrete can be determined as follows [6].
where  is equivalent chloride diffusion coefficient,
  is crack width,
  is crack interspace,
  is allowable crack width,
  is chloride diffusivity at crack zone (
 =200 cm2/year). The value of chloride diffusivity at crack is significantly lower than that in water. This is because the interactions of crack surface and chloride ion or the filling of crack space of hydration products.
The ratio of crack width to crack space can be determined as follows [17]:

where  is distribution coefficient of strain of steel rebar between two neighbor cracks,
  is stress of steel rebar, and
  is elastic modulus of steel rebar.
The effect of temperature rise (on chloride diffusivity can be described using Arrhenius law as follows:
where β is activation energy of chloride diffusion coefficient [12,15]. The value of activation energy is given as β=4300 [12,15].
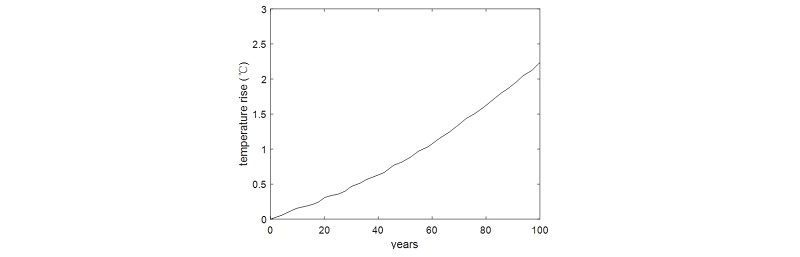
Figure 1 shows temperature rise in future 100 years. This temperature rise scenario is from IS92a climate change scenario [4].
The surface chloride content,  (kg/m3), can be determined as a step functions as follows [13,14]:


where  (km) is distance from the coast.
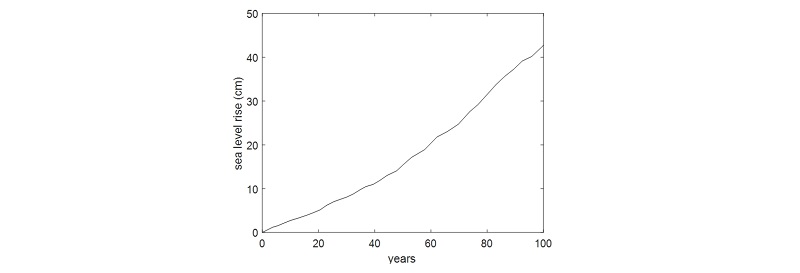
The sea level rise scenario is shown in Figure 2 [4]. As climate changes, sea level will rise. Consequently, the distance between concrete structure and coastline will decrease. The relation between sea level rise and receding of coastline can be describe using Bruun rule (Figure 3). In Figure 3, s is sea level rise, R is receding distance of coastline, B is height of beach, ds is depth of seawater, L is lateral distance from beach to offshore. (B+ds)/ L is slope of beach. The slope of beach generally depends on the geography location. The average slope of beach in the world generally ranges between 1/100 to 1/200. According to Bruun rule, the receding distance can be determined as R=s×L/(B+ds). For example, when the slope of beach and sea level rise are given 1/100 and 50 cm respectively, the receding distance of coastline line is 50 m (50 cm×100=50 m). Because the sea level rise is a function of time, the receding distance of coastline line is dependent on time. Furthermore, as shown in equation 10 to equation 12, the surface chloride concentration depends on time. The average surface chloride concentration can be determined as follows:


Service Life Evaluation
The service life of concrete structure is determined using probability method as follows:


where  is the chloride concentration at the cover depth (
 ) of concrete,
  is threshold chloride content,
  refers to the durability failure criteria, and
  is the failure probability of the chloride ingress durability. The threshold chloride content
  is assumed to 1.2 kg/m3 [5]. The function,
  , refers to the number of chloride ingress durability failures out of a total number of N trials. In the corrosion initiation stage, the service life of concrete is the time of failure probability to reach 10%.
Life 365 program also uses probability method to evaluate the service life of chloride-exposed concrete structures. The main difference between this study and Life365 program is that Life365 program do not consider Bruun effect, and this study considers the influence of Bruun effect on service life.
Case Studies
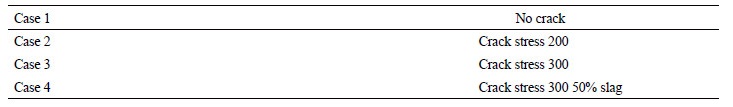
In this study, four cases are analyzed to evaluate the service life of cracked concrete considering temperature rise and sea level rise. These analysis cases are sound concrete, stress of steel rebar 200 MPa ( =200 MPa), stress of steel rebar 300 MPa (
 =300 MPa), stress of steel rebar 300 MPa with 50% slag (
 =300 MPa and 50% slag addition). The distribution coefficient of strain of steel rebar between two neighbor cracks
  is 0.8 [17]. The real crack width is assumed to be allowable crack width (
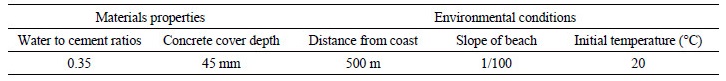
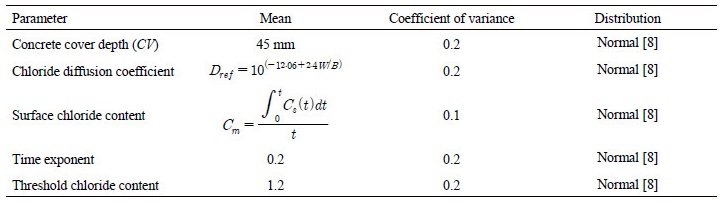
 ). Table 1 summarizes these analysis cases. Table 2 shows listings of parameters about materials properties and environmental properties. The water to binder ratio is 0.35, the cover depth is 45 mm, the initial distance between building and coastline is 500 m, and the slope of beach is 1/100. The probability distribution of variables is shown in Table 3.
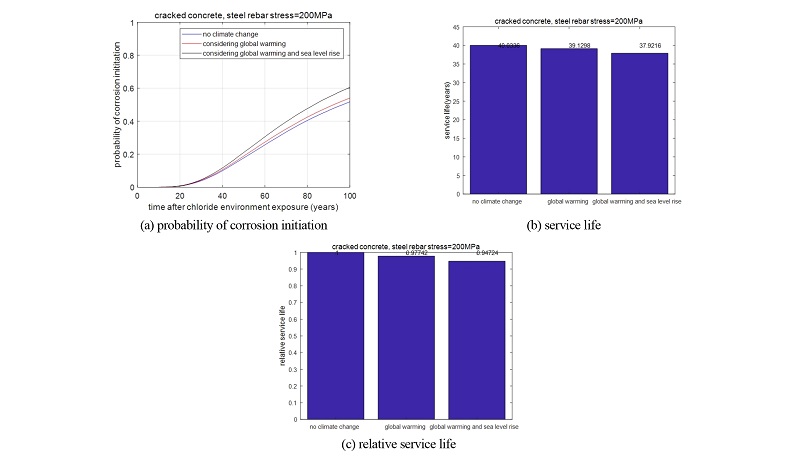
The analysis of probability of corrosion initiation and service life reduction for different cases are shown in Figures 4 to 7. In this study, previous service life is defined as service life without climate change, the revised service life is defined as service life considering climate change, and the relative service life is defined as the ratio of revised service life to previous service life. The units of previous service life and revised service life are years. The relative service life has no unit. In other words, relative service life can be used as an index to measure service life reduction due to temperature rise and sea level rise.
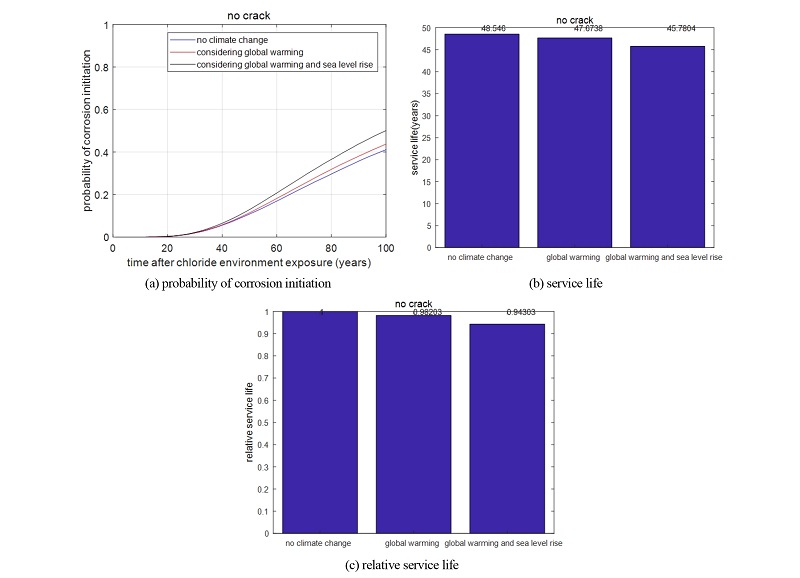
For each analysis cases, we consider three scenarios, i.e. no climate change (scenario 1), only temperature rise (scenario 2), and both temperature rise and sea level rise (scenario 3). The difference between scenario 2 and scenario 1 reflects the influence of temperature rise. The difference between scenario 3 and scenario 2 reflects the influence of sea level rise. The difference between scenario 3 and scenario 1 reflects the influence of temperature rise plus sea level rise.
The probability of corrosion initiation is obtained using Monte Carlo method. The previous service life and revised service life are obtained based on interpolation between probability of corrosion initiation and exposure time (shown in Figures 4a to 7a). Furthermore, the relative service life is calculated using previous service life and revised service life.
 =200 MPa).
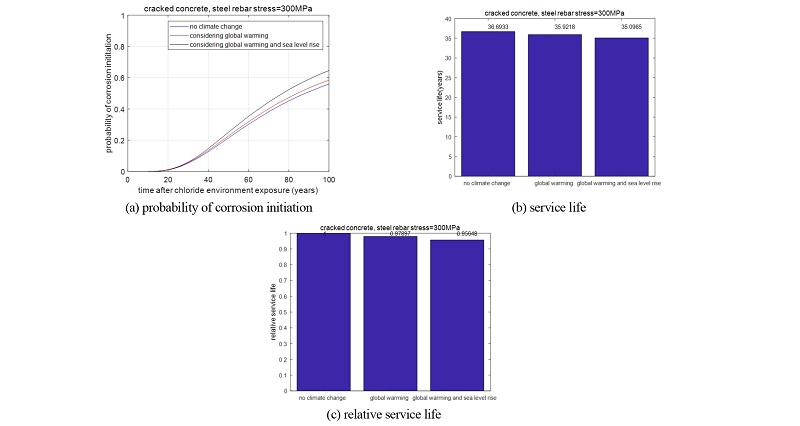
 =300 MPa).
For cases of no crack concrete,  =200 MPa,
  =300 MPa, and
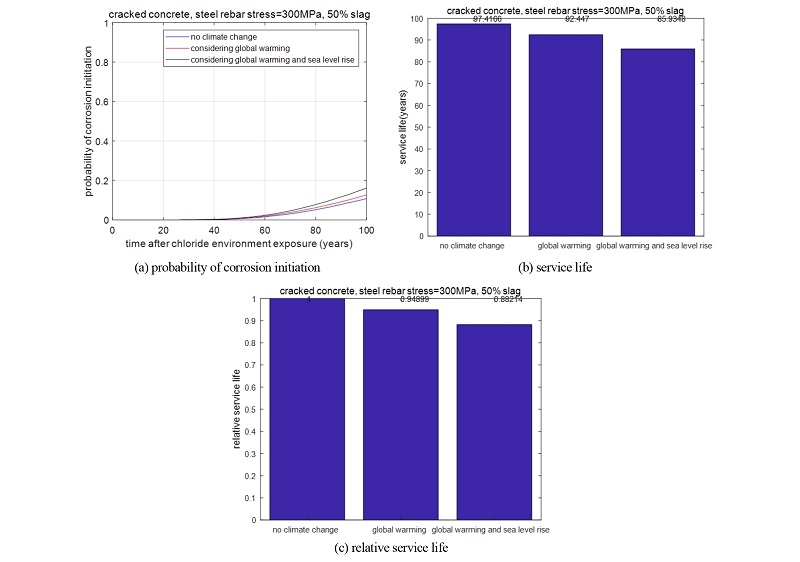
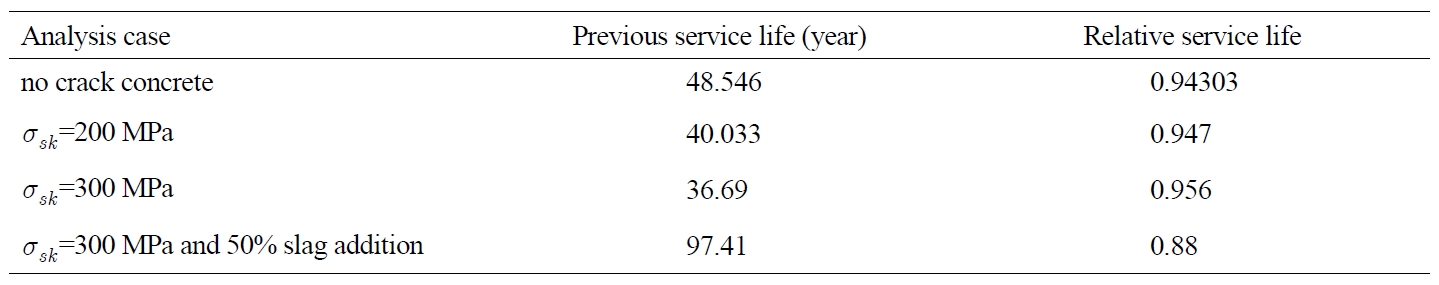
  =300 MPa with 50% slag addition, the previous service life are 48.54 years, 40.03 years, 36.69 years, and 97.41 years respectively (shows in Figures 4b to 7b). The service life of concrete decreases as the stress of steel rebar increases, and the service life increases as slag replaces partial cement. As shown in Figure 4c to 7c, for cases of no crack concrete,
  =200 MPa,
  =300 MPa, and
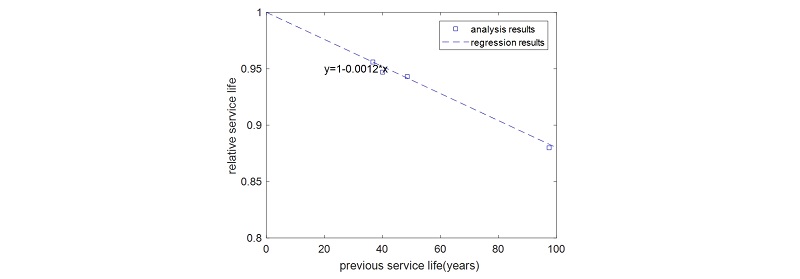
  =300 MPa with 50% slag addition, the relative service life are 0.943, 0.947, 0.956, and 0.882 respectively. As the previous service life increases, the relative service life decreases. It is because the change amount of temperature and sea level increases as time exceeds (shown in Figures 1 and 2). In addition, as shown in Figures 4c to 7c, for each analysis cases, the reduction of relative service life due to sea level rise is comparable to that due to temperature tise. In other words, sea level rise has a significant impact on service life reduction of concrete structure in marine zone.
 =300 MPa and 50% slag addition).
Table 4 shows reduction of service life for each analysis cases. Figure 8 plots the relative service life as a function of previous service life. It is shown that the reduction ratio of service life is almost proportional to previous service life of concrete. When the previous service life is 50 years, after considering temperature rise and sea level rise, the reduction of previous service life is about 6%. In addition, the slope between relative service life and previous service life does not depend on concrete material properties, and only rely on previous service life.
Conclusions
This study presents a numerical procedure to analysis the service life of cracked concrete considering global warming and sea level rise.
First, the equivalent chloride diffusion coefficient of cracked concrete is determined considering sound zone and cracked zone. The equivalent chloride diffusion coefficient considers crack width, crack interspace, and allowable crack width. The ratio of crack width to crack interspace is determined based on steel rebar stress. The effect of sea level rise on surface chloride concentration is described using Bruun rule.
Second, based on probability method, the service life of cracked concrete is predicted. Four analysis cases, i.e. sound concrete, stress in steel rebar 200 MPa, stress in steel rebar 300 MPa, and stress in steel rebar 300 MPa with 50% slag addition, are considered. The analysis results show that the service life of concrete decreases as the stress of steel rebar increases, and the service life increases as slag replaces partial cement. For each analysis cases, the reduction of service life due to sea level rise is comparable to that due to global warming. Sea level rise has a significant impact on service life reduction of concrete structure in marine zone. As the previous service life increases, the relative service life linearly decreases. When the previous service life is 50 years, after considering temperature rise and sea level rise, the reduction of previous service life is about 6%.
