

Introduction
Material and Methodology
Basic assumptions
Description of the measured environment and measuring technique
Method of measurement
Theoretical basis of calculations and assessments
Result and Discussions
Data analysis
Influence of workers
Indoor air quality
Summary
Conclusions
Introduction
Ventilation of buildings is a basic prerequisite for maintaining the required quality of the indoor environment in terms of permissible CO2 concentration. Many studies have shown that CO2 concentrations in the indoor environment of buildings should be below 800 parts per million (ppm) in order to avoid the negative impact of increased concentrations on the health of users [1, 2, 3]. To ensure maximum cognitive ability of users, the concentration should be below 600 ppm, while at higher concentrations a significant decrease in human cognitive functions is evident, at 1400 ppm it is a decrease of 50% [4, 5]. The issue of keeping the concentration of CO2 in the indoor environment within sustainable limits is directly related to the issue of operating the ventilation system of the building. It is known that the costs associated with air conditioning for commercial buildings account for 40% of the total energy consumption of commercial buildings in office buildings [6]. In recent years, a big amount of buildings have been designed with forced ventilation system due to the possibility of centrally treating the air to the required temperature and CO2 concentration and filtering other harmful substances.
Office buildings with a controlled amount of supplied air based on the current CO2 concentration in indoor environments worldwide still represented a lesser extent than if the building designed with a constant supply of air to the office environment, it is appropriate to find ways and space for optimization of the total amount of air supplied to indoor environment in order to reduce the overall operating costs of the building for ventilation and possible future modifications [7, 8, 9].
The aim of the present research is to determine the actual development of CO2 concentration in the office environment based on the current presence of employees. Based on this measurement, other optimization methods can be tested to reduce energy consumption for ventilation of buildings, where the obtained data can provide more conveniently plan for the actual development of CO2 concentration compared to the usual theoretical prediction based on local standardization. The results of this research can be applied both in the micro-region of the Czech Republic and in the global macro-regions.
In this research, the development of CO2 concentration during working hours in the office environment for 5 working days was studied, while the presence of employees, their arrivals and departures from the workplace was monitored. Based on the obtained data, it is possible to determine the characteristic behavior of the development of CO2 concentration within a working day and it is possible to define the period when the office environment is more burdened by CO2 concentration and it is necessary to ventilate it, as well as the period when the concentration is no longer so high and it is enough to supply less air. Finding of new optimization methods for the method of ventilation is directly related to the expected climate change in the country, which is expected to significantly increase the concentration of CO2 in the external environment and thus in the supply air for ventilation [9]. While the average atmospheric CO2 concentration was 414 ppm in 2020 [10], the concentration is expected to be 550 ppm in 2050 and 650 ppm in 2100 [11, 12], a 57% increase over in 2020.
Material and Methodology
Basic assumptions
Due to the ever-increasing concentration of CO2 in the external environment, the question arises whether the current arrangements need building ready to adapt to future requirements in terms of maintaining the quality of the indoor environment. Based on previously performed measurements, it was found that many buildings built before 2000 have problems with maintaining the desired concentration of CO2 in the indoor environment. The crucial question is whether the new administration building may be exposed to the problem of poor indoor air quality. Therefore, was studied an office, located in an office building completed in 2013, which has air-conditioning system for ventilation purposes. Measurements are primarily trying to determine the typical range of CO2 concentrations in the selected office environment depending on the fluctuation of workers and their working habits affecting the resulting current CO2 concentration.
Description of the measured environment and measuring technique
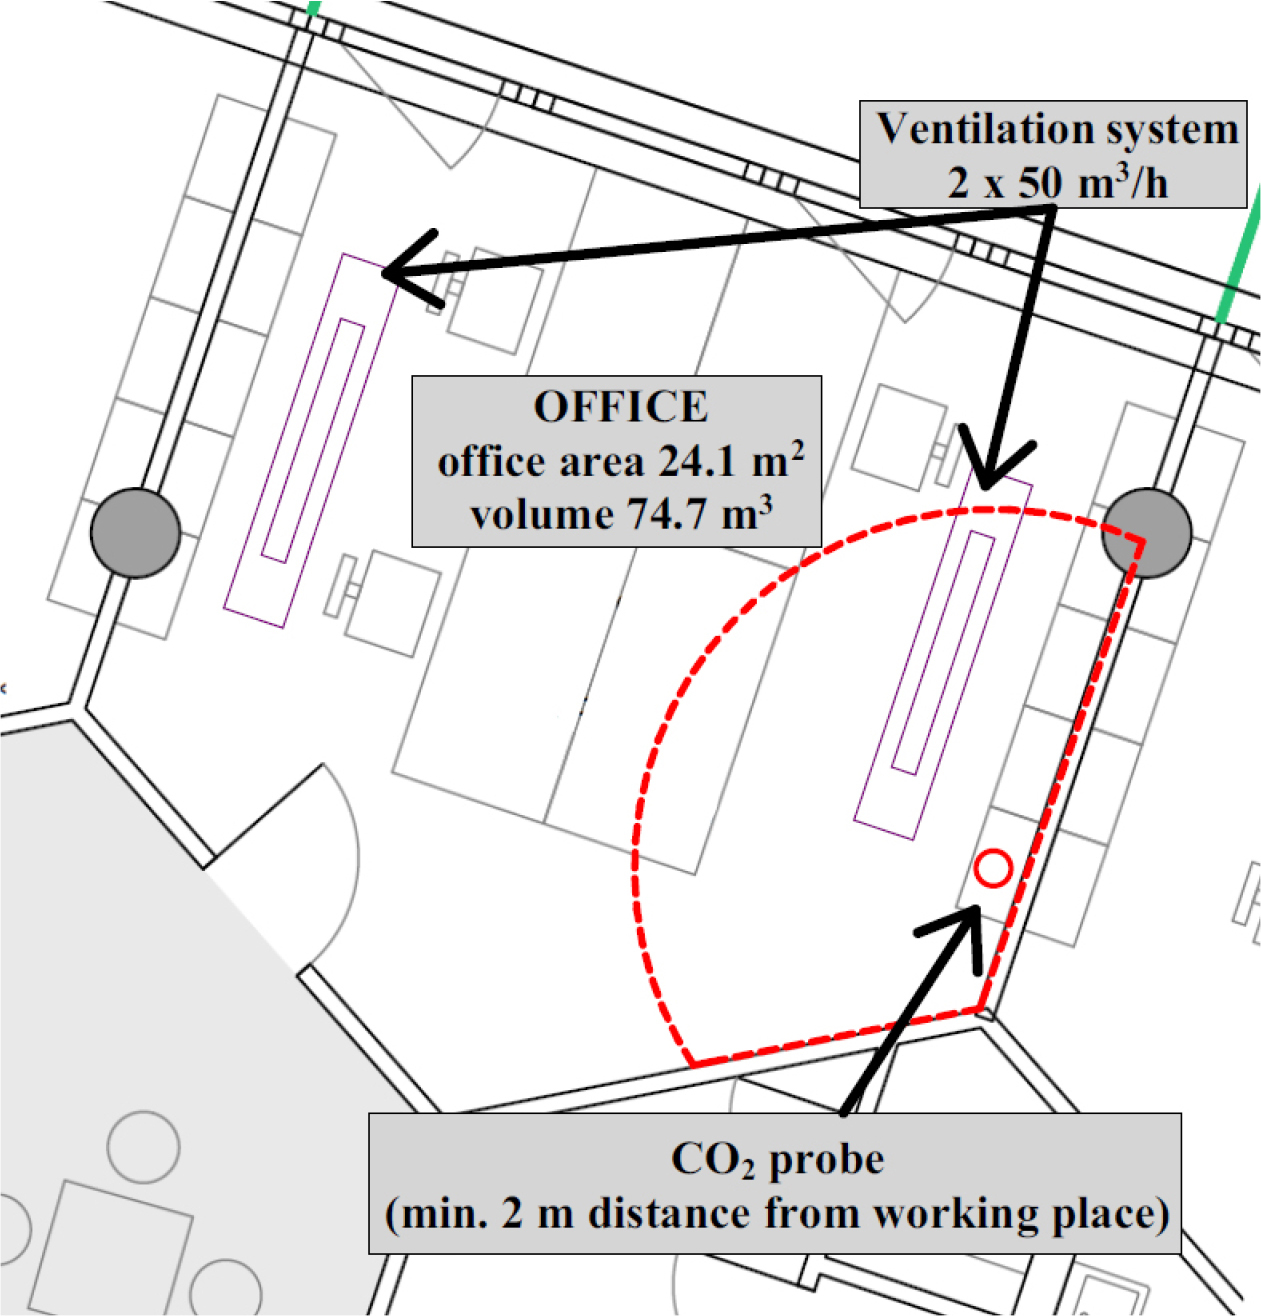
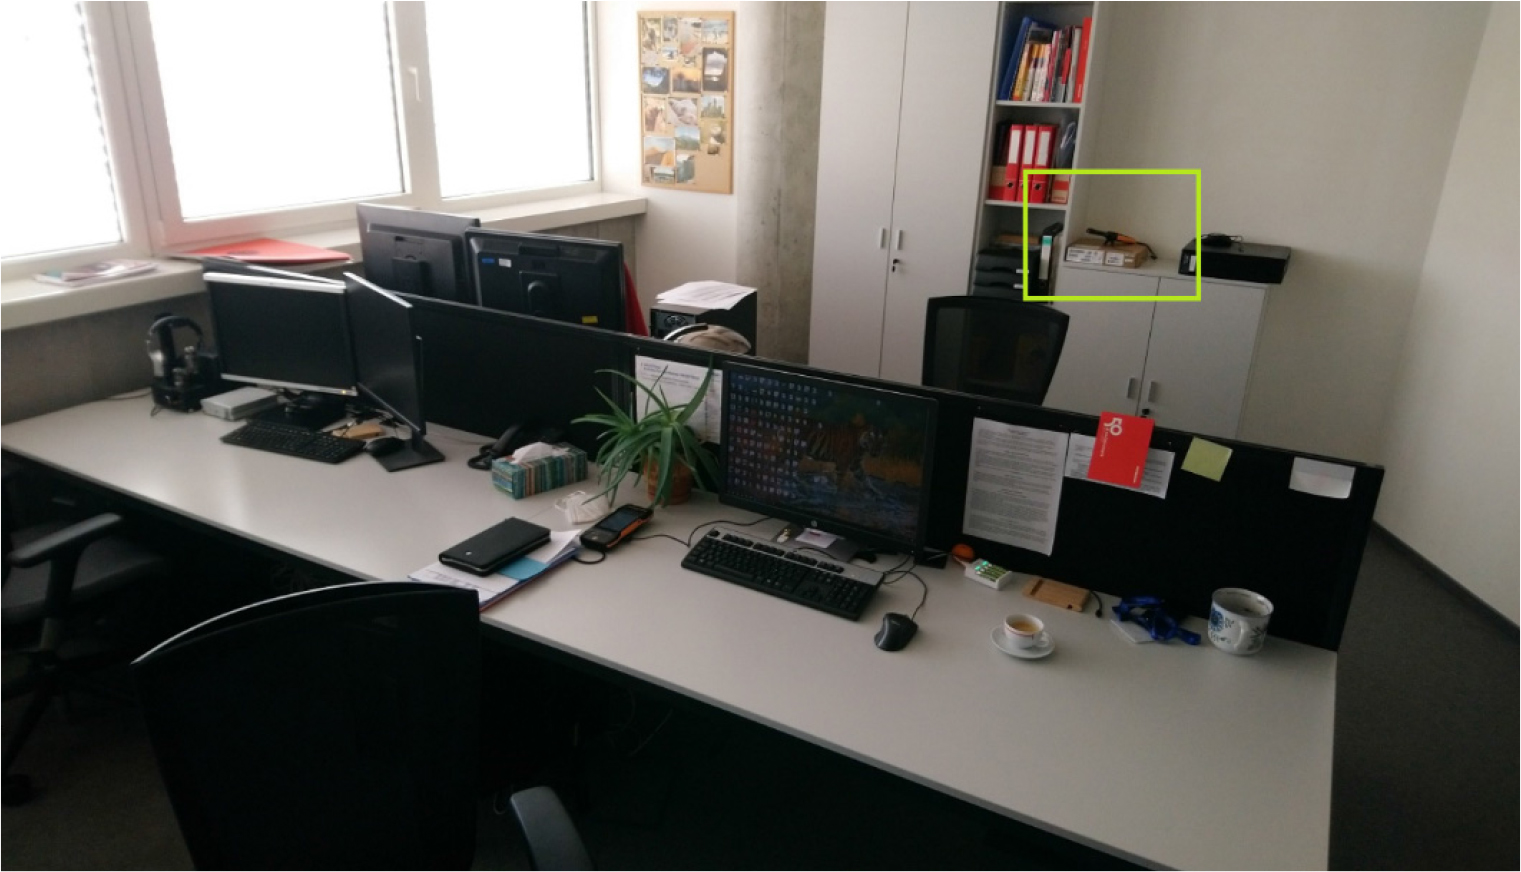
The measurement was provided in an administrative building built in 2013, located in Prague, Czech Republic in the city centre, Voctářova street. The office in which the measurement was performed is located on the 4th floor of an administrative building, the windows are oriented to the north. The office itself is designed for 4 workers, the room is artificially ventilated with a total amount of 100 m3 · h-1, using 2 ventilation beams, this corresponds to 25 m3 · h-1 per 1 worker in the case of full use of the office. Such an amount of supplied air corresponds to the national standardization for 2013 in the Czech Republic, when it was required to supply 25 m3 · h-1 per 1 worker and at the same time maintain the CO2 concentration at a maximum level of 1500 ppm [13]. It is known, the CO2 concentration is often higher than 1500 ppm [1, 14]. In case of user request it is also possible to switch to natural ventilation by opening a window, they are oriented to the north. The total area of the room is 24.1 m2, clear height to the ceiling 3.1 m, total volume 74.7 m3. The Testo 400 - Universal IAQ instrument with Testo CO2 probe (accuracy ± 50 ppm + 3% of measurement) was used to measure the concentration. The probe was placed in an environment away from all workers, air vents, opening windows and doors, at least 2 meters, to ensure sufficient measurement accuracy. The CO2 probe was placed at a height of 1.2 m above the floor. The diagram of the office including the location of the CO2 probe can be seen in Figure 1, Figure 2 shows the measured office including the CO2 probe in back round.
Method of measurement
The measuring device 400 Testo IAQ was set for the formation of CO2 concentration histogram with 15-second cycle of data storage. The presence of staff was recorded manually, each arrival and departure were recorded in writing. Information on possible door opening longer than 180 seconds was also recorded, as well as information on possible window ventilation. The time interval of the monitored development of CO2 concentration in the office was from 08:15 to 16:15, working hours of employees are in this interval. The measurement took place during 1 working week from Monday to Friday.
Theoretical basis of calculations and assessments
According to the latest studies, the indoor environment can be considered harmless if the CO2 concentration in the office is below 800 ppm [1, 2]. In case, if it is a concentrated a critical activity (e.g. strategic decision-makers, dispatchers, etc.) or it is required to have full cognitive functions of employees, the concentration should be below 600 ppm [4]. Based on this finding, the time when the concentration is outside these permissible limits in the real environment of the studied office space was researched and the percentage of time was determined. When it is possible to perform critical activity in the investigated environment with the requirement of CO2 concentration below 600 ppm, and what percentage of the time can be characterized by the investigated office as harmless, i.e. with CO2 concentration below 800 ppm.
Theoretically, the development of concentration is possible to calculate by equation (1):
Where Cin is the CO2 concentration in the indoor environment, Cs is the CO2 concentration in the air supplied to the indoor environment, S ‧ V-1 generated amount of CO2 in the indoor environment per unit volume of air, av the air change rate equal to the outside air flow rate divided by the indoor volume, ∑aother the sum of all other indoor pollutant removal rates. The production of CO2 by humans during administrative activities can be considered at 31.5 g · h-1 [15].
Theoretical modeling is generally captures the habits of office workers in a building and cannot be completely followed. Such habits include, for example, going to lunch at a certain hour, absence from the office due to meetings, business trips, etc. For this reason, it is appropriate to perform measurements directly in a practical environment, which is significantly greater predictive value than pure theoretical proposition.
Result and Discussions
Data analysis
Based on measurements performed on 22 March 2021 to 26 March 2021, very variable levels of CO2 concentration in the office environment were found during the day. Especially due to the different number of employees on individual days and in individual hours. The measured values can be seen in Figure 3, Figure 4, Figure 5, Figure 6, Figure 7.
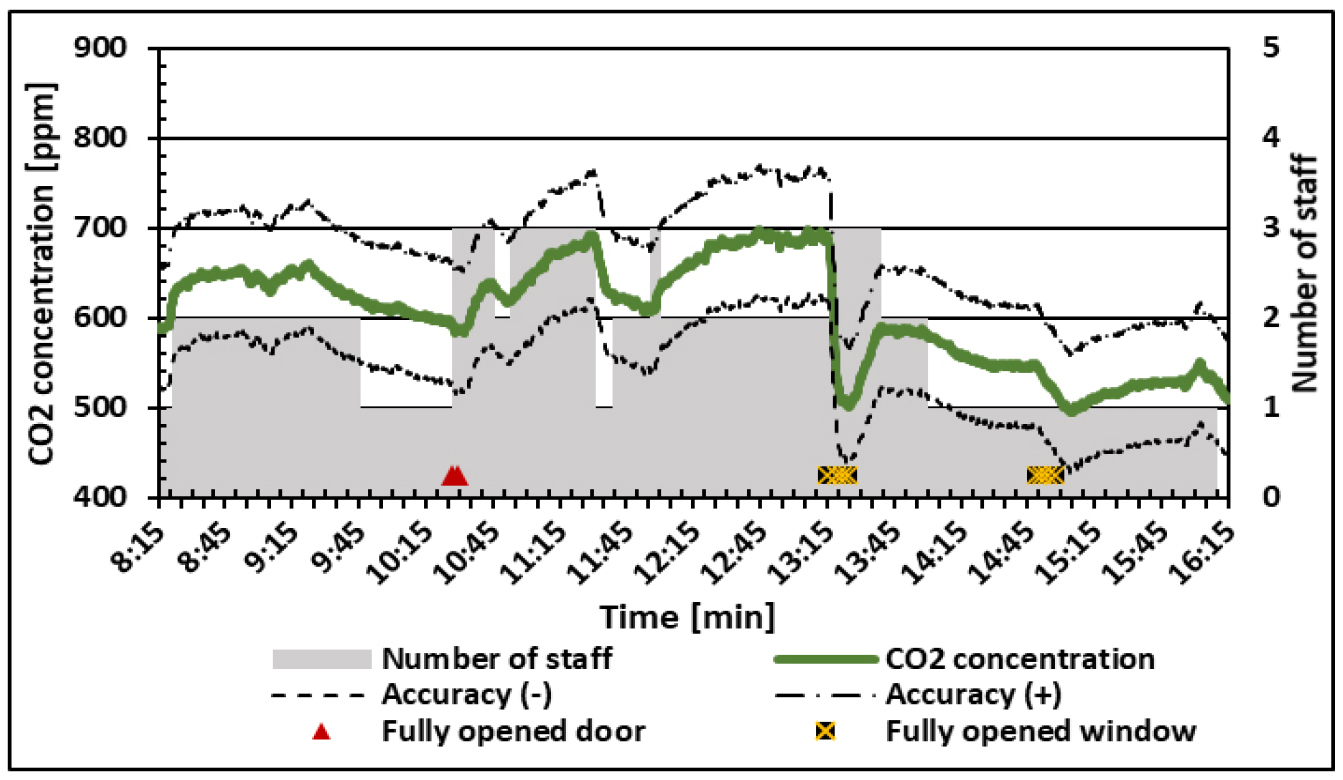
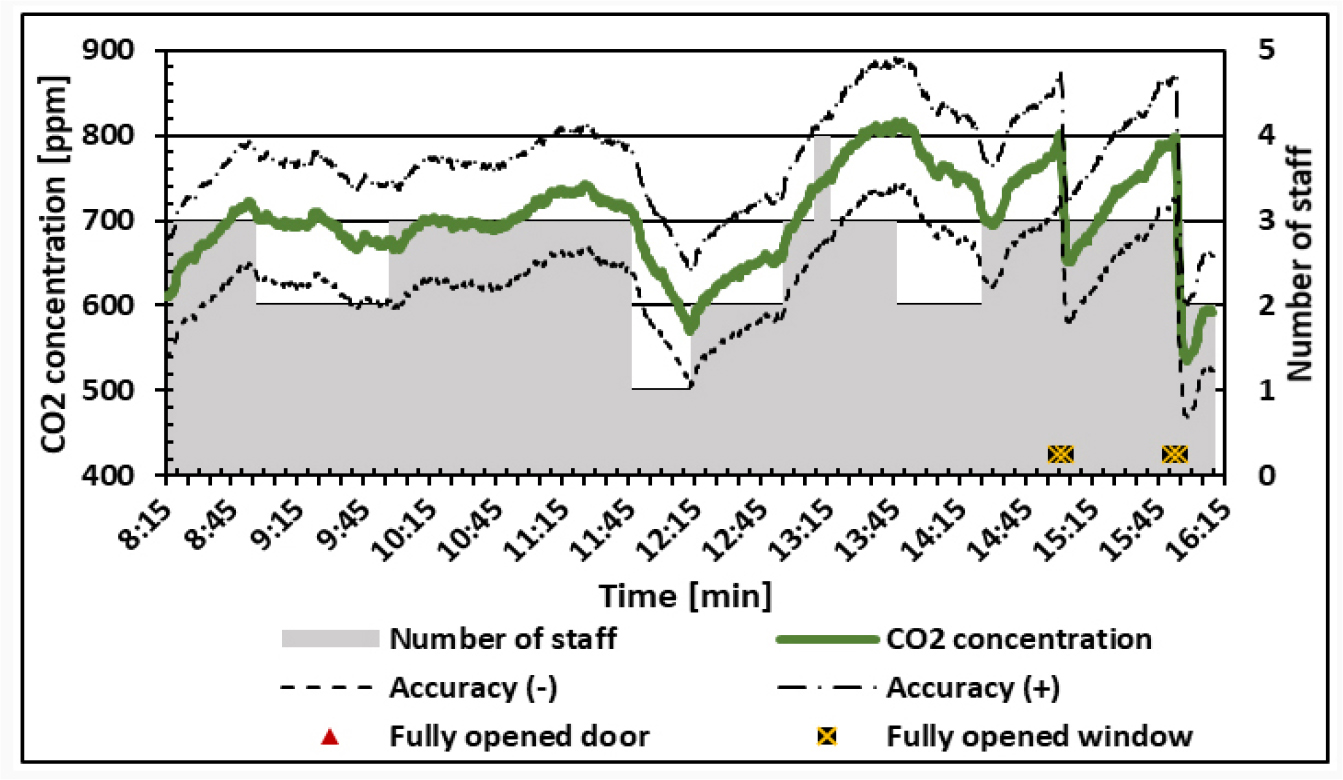
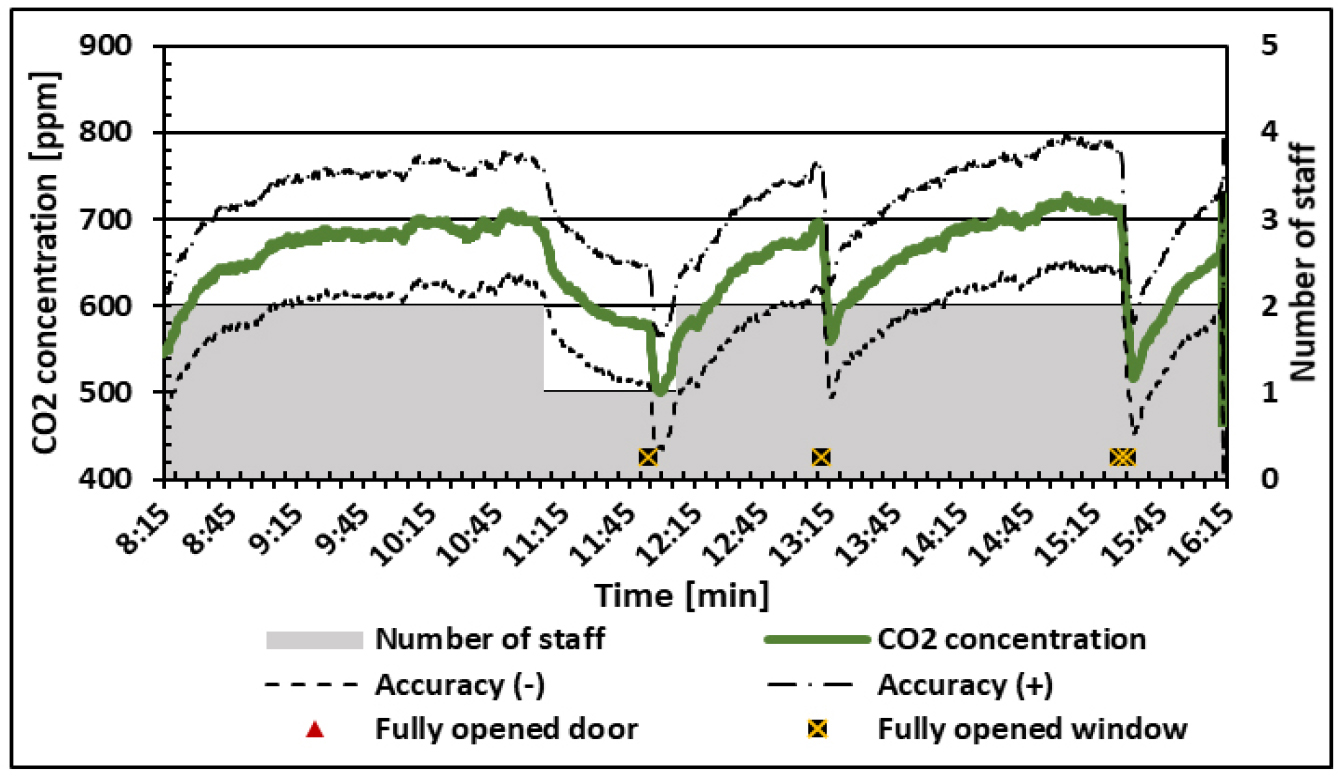
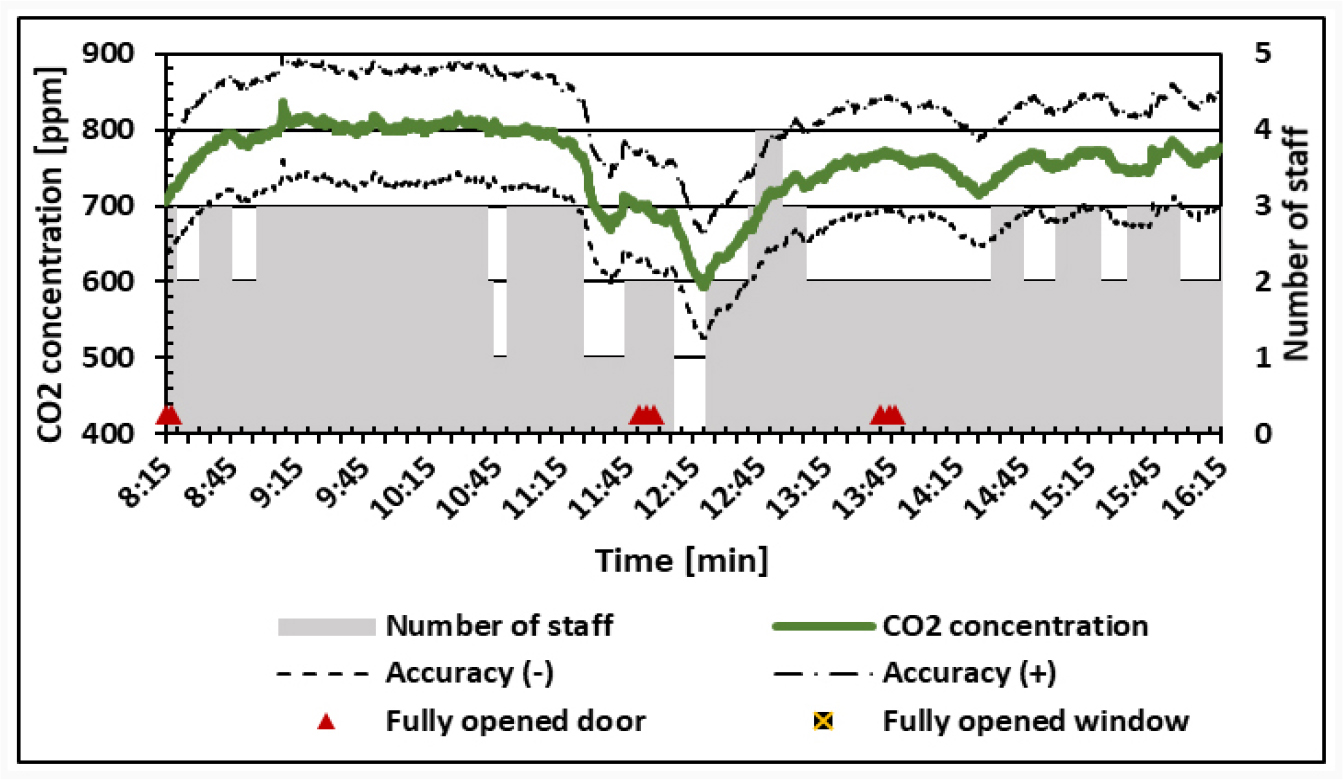
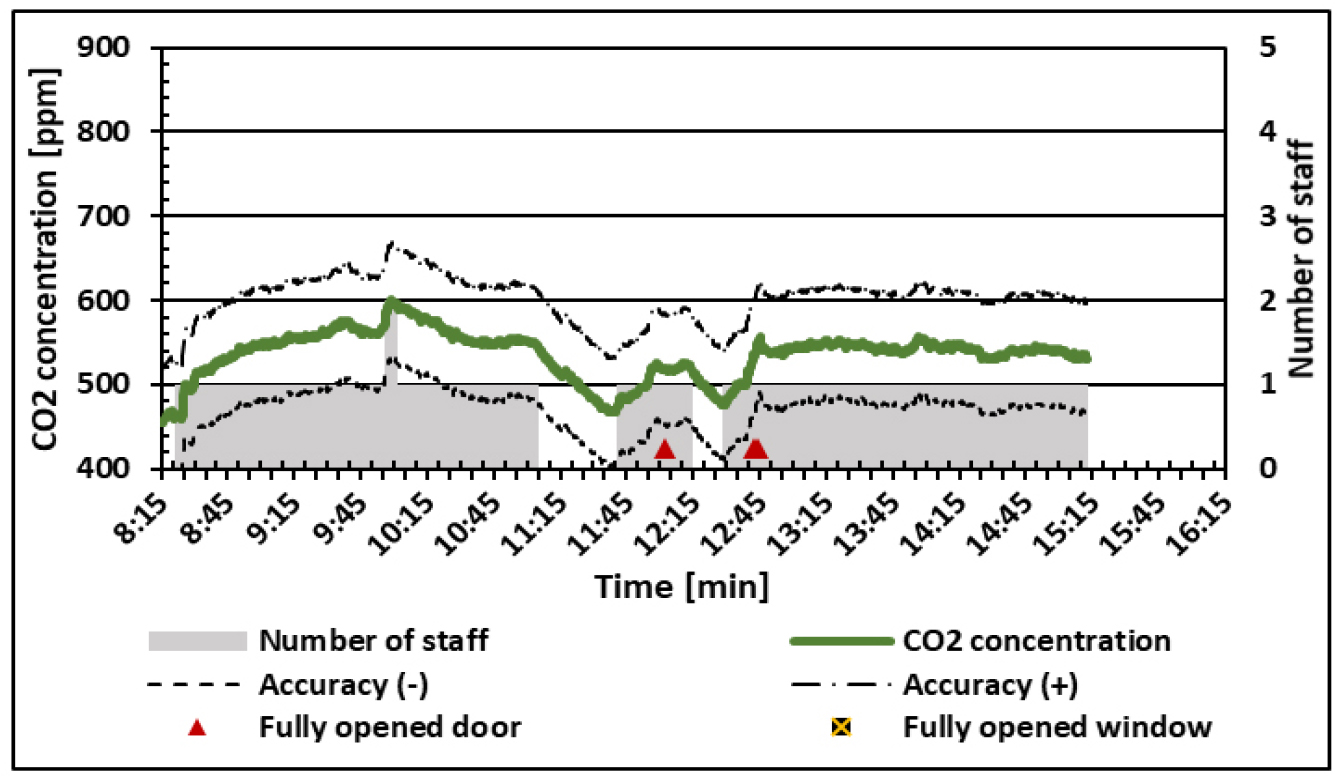
Figure 3 to Figure 7 show the presence of workers during working hours 8:15 - 16:15, while the presence of workers is very variable both within individual days of the week and within hours during one working day. It can be conveniently observed that while when 3 workers are present, the concentration is stabilized around 800 ppm (see Figure 6), if they are present most of the time, the CO2 concentration is stabilized around 700 ppm (see Figure 5).
The measurement also captured a situation where there was only 1 worker in the workplace during most working hours, while the CO2 concentration was stabilized at around 550 ppm (see Figure 7). With frequent changes in the presence of workers, the CO2 concentration cannot be considered stable and there are obvious significant differences in working hours (see Figure 3, Figure 4). From the above measurements, it is appropriate to note the effect of an open door to the office and the effect of temporary ventilation in a natural way by opening a window. While when the door to the office is fully opened from the corridor, there is no significant impact on the change in CO2 concentration in the office (see Figure 3, Figure 6, Figure 7), full opening of the window for a few minutes office (see Figure 4, Figure 5), when the CO2 concentration drops sharply and approaches the outside air concentration. From this measurement it is also possible to trace the tendency of workers in the office to ventilate in the afternoon (see Figure 3, Figure 4, Figure 5), while the window was opened mainly at concentrations higher than 700 ppm, except in one case where the window was opened even at a concentration of around 550 ppm, but it should be mentioned here that this window opening was also preceded by significant window ventilation, which was started at a concentration of around 700 ppm (see Figure 3).
Influence of workers
In the measured environment, 3 working places were active during the measurement process, while the fourth place was permanently unused, during the measurement there was a situation where there were 4 people in the office (see Figure 4 and Figure 6), but it was not a stationary worker. Despite the fact that 3 working places are proposed, the presence of all 3 workers was less frequent, as can be seen from Table 1.
Table 1.
Overview of the percentage of the number of employees by working day
From Table 1 it is clear that even though the researched office area is designed for 4 employees, the most common situation is the presence of 2 employees 40.9% of the total time studied, then the presence of 1 worker 29.5% of the reseached time and the presence of 3 workers 25.2%. An interesting finding is that during the lunch break, the concentration of CO2 in the indoor environment tends to decrease repeatedly due to the reduction in the number of people occupying the office. This phenomenon is clearly seen in Figure 4, Figure 5, Figure 6 and Figure 7.
Indoor air quality
The measurement tried to capture the amount of time when the limits of 600 ppm and 800 ppm will be exceeded in the measured office ventilated by the air-conditioning system.
From Table 2 it is evident that on average 61.5% of the time the concentration of the office was in the range of 600 to 800 ppm, further in 33.3% the concentration was lower than 600 ppm, and this value must take into account the fact that on Friday was mostly in the office only one person (see Table 1).
Table 2.
Overview of the CO2 concentration by working day
Despite the fact that 40.9% of the room had only 2 people, while the office space is conceptually designed for 4 people, it is alarming that in 61.5% the concentration was below 800 ppm. Although this concentration is not yet a significant manifestation of the symptoms of Sick Building Syndrome, it is already a concentration in which cognitive functions begin to be affected and the overall work performance of employees decreases. The percentage of occurrences of a certain amount of CO2 concentration depending on the actual presence of workers in the space is shown in Figure 8.
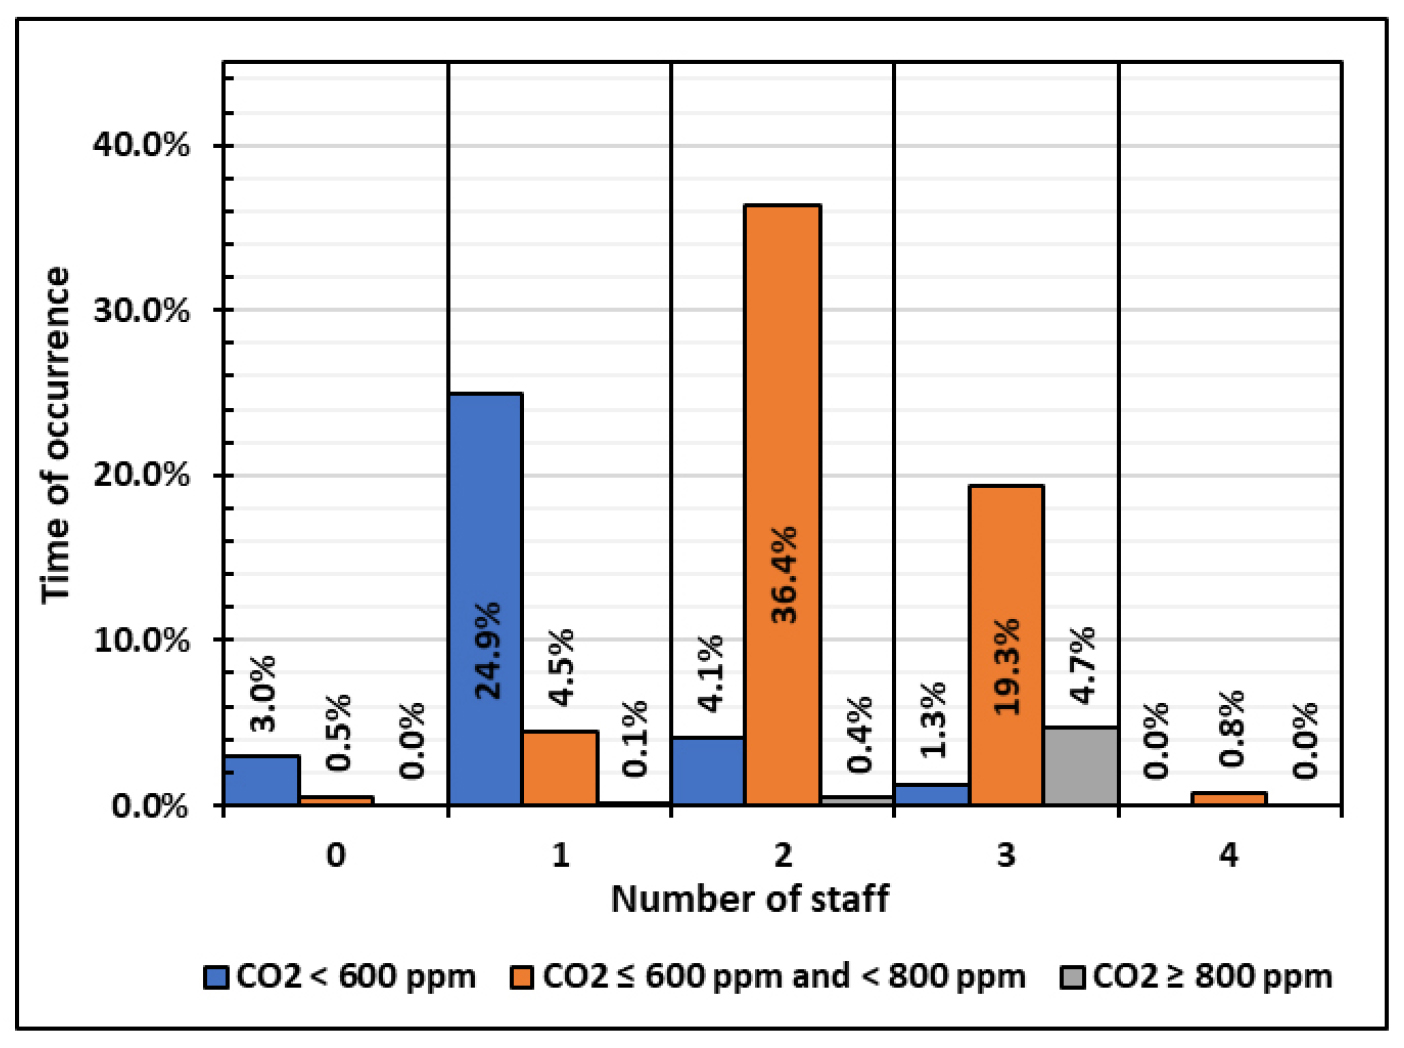
From Figure 8 it is evident that the high quality of the indoor environment, when the concentration is lower than 600 ppm, was achieved in 24.9% in the case when there was only 1 worker in the measured environment and in 4.1% when there were 2 workers in the office. The most frequent occurrence of concentrations in the range of 600 to 800 ppm was recorded from 36.4% in the presence of 2 workers and from 19.3% in the presence of 3 workers. Due to the rare occurrence of 4 workers at the time of measurement (only 0.8%), it is not possible to trace the exact influence of a potential 4 worker from a long-term perspective with sufficient accuracy. From Figure 8, however, the influence of increasing workers in the measured environment on the gradual increase of CO2 concentration is quite obvious - while in the presence of only 1 worker the concentration is lower than 600 ppm, in the case of 2 and 3 workers the occurrence of higher concentrations prevails, i.e. in the range of 600 - 800 ppm.
Summary
The measurement focused on determining the development of CO2 concentration during working hours during 1 working week. Based on the measurements, it can be stated that the quality in the measured space is currently sufficient in terms of design standards in terms of prevention against the symptoms of Sick building syndrome, however, cognitive impairment of workers may already manifest themselves and their overall performance may be impaired. Especially with regard to the development of the concentration of CO2 in the atmosphere, this is a very problematic sustainable state. Given that the measured office was dimensioned according to the regulations of 2013 for 4 people, most of the time during the measurement were present only 2 people, while more than half of the time can be described as an environment with less performance in terms of human cognitive functions, the situation is somewhat worrying and future prospects unclear. It can be stated that if the office is used fully, i.e. according to the proposal by 4 people, it is very likely that the concentration will exceed the limit of 800 ppm and symptoms of Sick building syndrome may begin to appear even though the building is designed in accordance with technical regulations 21st century.
Assuming that the concentration of CO2 in the atmosphere will increase from the current 414 ppm to 650 ppm (an increase of 57% compared to the current state) during this century, there is a risk of a significant deterioration of the ventilation capacity of air conditioning systems if designed to current values. It is generally not clear how individual building operators will approach this problem. It can be stated that if the supply air has a concentration of 650 ppm, it is not possible to ensure a concentration of 600 ppm in the indoor environment of buildings from an operational and economic point of view. Concentrations below 800 ppm can be ensured under considerably higher operating costs for ventilation due to the supply of higher amounts of air to the indoor environment or to find new methods to ensure the elimination of CO2 in the indoor environment and thus overhaul the ventilation concept over the centuries.
Conclusions
Measurements have shown that the concentration of CO2 in the indoor environment can be very variable during the day, depending on the current presence of working people and their behavior in terms of the possibility of using natural ventilation, where the CO2 concentration can fall sharply. It was found that:
1.mechanically ventilated office with a constant amount of air of 100 m3 · h-1 designed according to technical standards from 2013 is expected to have a CO2 concentration in the indoor environment between 600 - 800 ppm only at 75% utilization (3 people) compared to the proposed 4 people.
2. To ensure full cognitive functions, when it is necessary to keep the concentration of indoor air below 600 ppm, it is possible to maintain this office for a long time only under the assumption of 25% utilization (1 person). At the same time, due to the constantly increasing concentration of CO2 in the supply air due to climate change, it can be stated that the situation will gradually deteriorate if the amount of supply air is not adjusted or another CO2 reduction method is found in the indoor environment.
The research also opened a new question from the point of view of the technical solution of buildings to ensure the sustainable condition of buildings and their adaptation to the future environment from the point of view of the current development of CO2 concentration in the atmosphere. It was found that the office environment dimensioned according to the regulations of the 21st century tends to comply with the prevention of Sick building syndrome, and in case of incomplete use of office space, it is possible to keep the concentration below 800 ppm. The issue of how to achieve higher quality, namely 600 ppm, to maintain full cognitive functions of workers is already apparent.
To ensure the future sustainability of existing buildings and to ensure the adaptation of buildings to the new environment, where we assume a significantly higher concentration of CO2 in the supply air, it is necessary to further address the issue and analyze potential conceptual adjustments to the operation of air conditioning equipment.
