

Introduction
Methods and materials
Data source of DWGR and data pre-processing
Applying categorical principal components analysis
Applying SVMR algorithm and hyper-parameters combinations
Model validation
Results
Model performance
Comparison of predictive models
Discussion and Limitation
Conclusions
Introduction
The construction industry accounts for 40% of the world’s energy consumption every year (Kulatunga et al. (2006) [1]). The generated amount of construction & demolition waste (C&DW) is steadily increasing (Wang et al. 2015 [2]), and 70-90% of C&DW generation is reported to be because of demolition waste (DW) (Butera et al. 2014 [3]). Therefore, accurate prediction of the amount of DW is important in terms of information establishment and tools for C&DW management (Fu et al. 2015 [4]).
Waste generation rate (WGR) is a tool that provides useful information for waste management (Hurley, 2003) [5], and it can be used as basic data for predicting the size of waste generation, economic value and cost, and environmental effects (Lu et al., 2011) [6]. In a recent trend, artificial intelligence (AI) technology, such as machine learning (ML) is actively used to estimate accurate WGR. Many researchers have applied various ML algorithms, such as artificial neural networks (ANN), support vector machines (SVM), and linear regression (LR) to develop WGR and waste generation predictive models. For example, Milojkovic et al. (2008) [7] and Noori et al. (2009) [8] developed municipal solid waste (MSW) generation predictive models by applying the ANN algorithm. Abbasi and Hanandeh. (2016) [9], Kumar et al. (2018) [10], and Abunama et al. (2019) [11] applied the SVM algorithm to develop C&DW generation predictive models. Furthermore, Azadi and Karimijashni. (2016) [12] and Chhay et al. (2018) [13] applied LR to develop MSW generation predictive models. Conversely, some researchers, including Abbasi et al. (2013) [14], Shamshiry et al. (2014) [15], Song et al. (2016) [16], and Golbaz et al. (2019) [17] conducted studies on hybrid models for predictive performance improvement of predictive models. Abbasi et al. (2013) [14] improved the performance of an SVM model through a WT-SVM hybrid model using a wavelet denoising method. Shamshiry et al. (2014) [15] combined ANN and genetic algorithm (GA) to conduct a study on the performance improvement of predictive values. Song et al. (2016) [16] developed a gray model (GM) with a low error rate through a gray model-support vector regression (GM-SVR) hybrid model. Golbaz et al. (2019) [17] improved the predictive performance of a predictive model through a least square support vector machine (LSSVM) and fuzzy logic support vector machine (FSVM) hybrid model.
Research on AI-based C&DW generation predictive model development is conducted based on a variety of variable types and data environments, and a series of processes from the selection of algorithms to the data processing and validation affect the research results. Therefore, C&DW generation predictive models using ML require appropriate algorithm selection, data processing, and validation method according to the inherent characteristics and environment of data in the research. In general, AI models are driven based on a large dataset, and insufficient data is a critical obstacle when applying AI systems (Abdallah et al. (2020) [18]) because it is difficult to secure stable predictive performance in AI models developed based on insufficient data. However, many researchers who handle field data have difficulty obtaining sufficient data (Abdallah et al. (2020) [18]), and insufficient data hinder the application of ML algorithms. Therefore, there is a need to discuss ways to develop AI models with excellent predictive performance based on datasets that are not large enough. The idea of researchers who attempted to develop ML predictive models through hybrid model development may be an appropriate solution to the problem caused by data.
In this study, we aimed to improve the predictive performance of DWG predictive models based on a small dataset comprising mainly categorical variables. For this, (1) DW generation information was collected from 784 buildings; (2) pre-processing was conducted to improve the predictive performance of the predictive models; (3) categorical variables were converted into continuous variables through categorical principal components analysis (CATPCA). (4) To improve the predictive performance of the DWG predictive models, the hyper-parameters were adjusted for the support vector machine regression (SVMR) model, and SVMR and CATPCA-SVMR models were developed. (5) As a validation method of the developed DWG predictive models, the leave one out cross-validation (LOOCV) technique was applied, and the performance of the models was determined through statistical metrics. Through the above process, in this study, we applied the data processing method and validation method that can ensure excellent predictive performance for a small dataset consisting mainly of categorical variables and proposed a hybrid DWG predictive model. Furthermore, we discussed the utilization method of the research results and the direction of follow-up studies.
Methods and materials
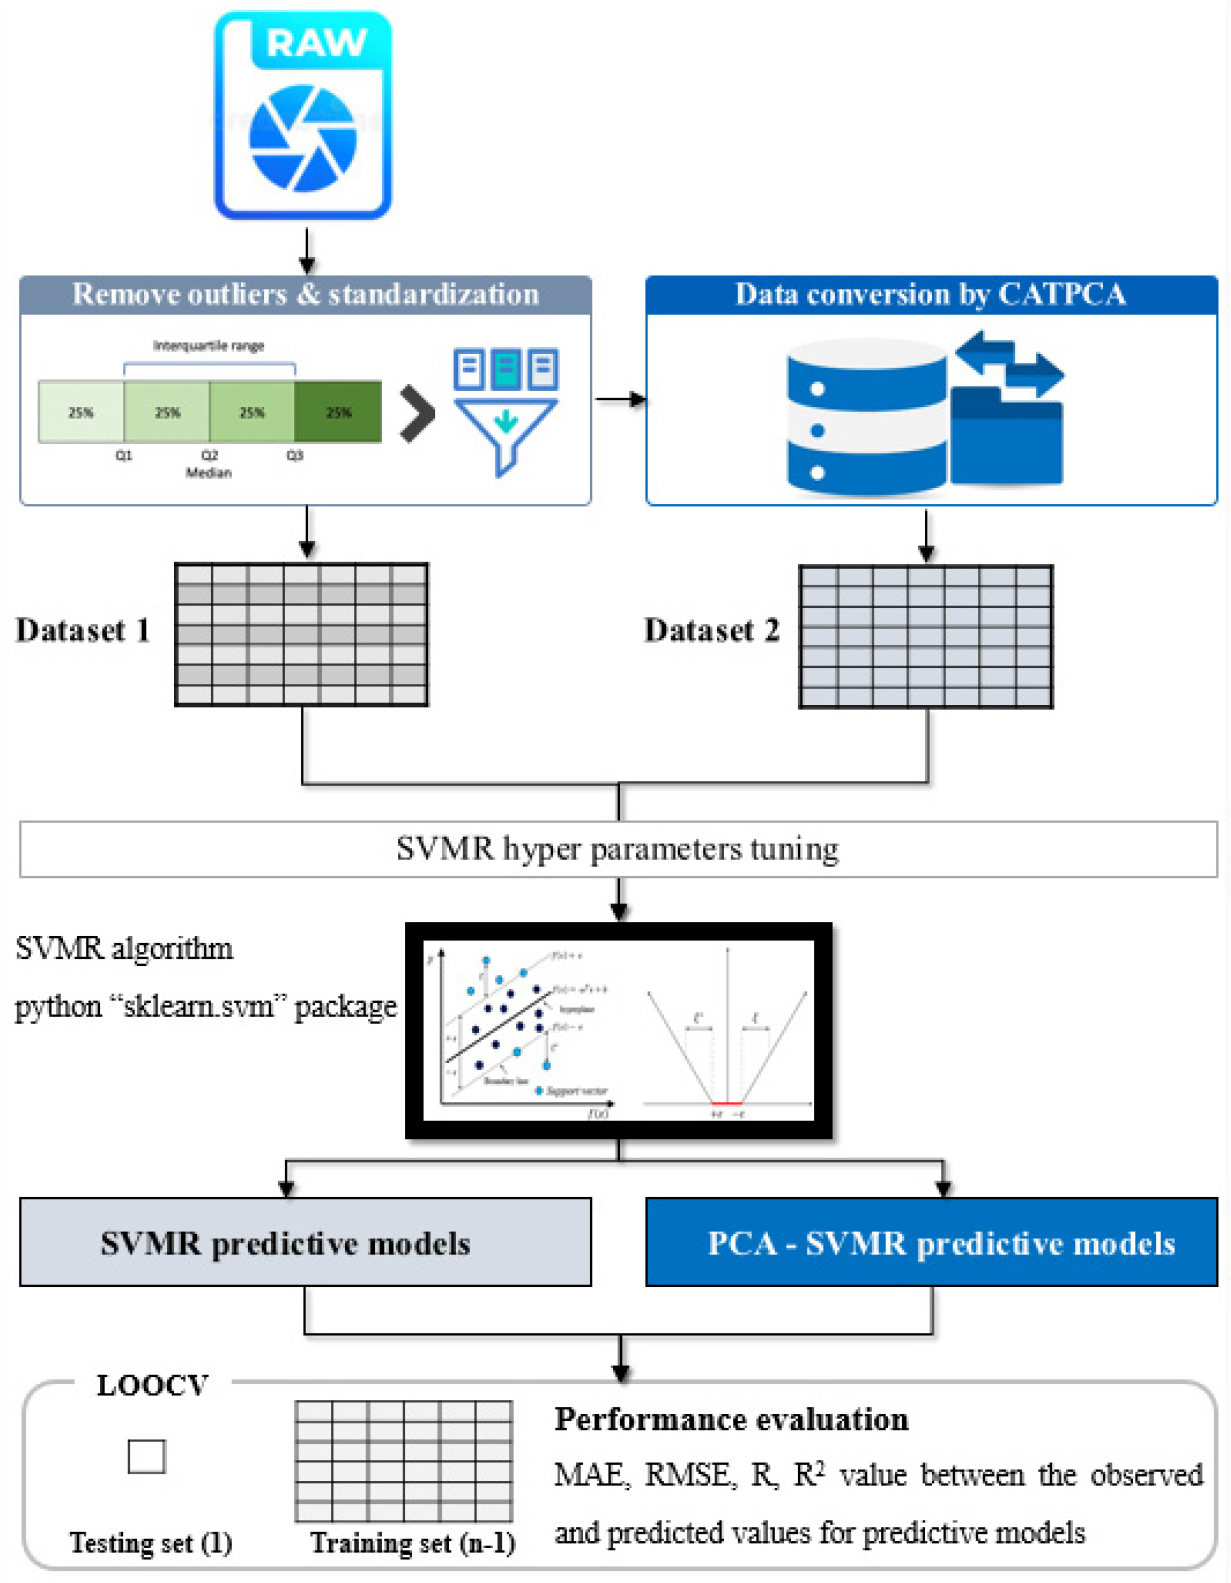
Figure 1 shows the flowchart of the processes performed in this study to develop predictive models through the application of CATPCA and examine the performance improvement. For predictive performance improvement of the predictive models, we built Dataset 1 through data pre-processing, such as outlier removal and standardization in raw data, and built Dataset 2 through data pre-processing and CATPCA. Dataset 1 and Dataset 2 were applied to the SVMR and CATPCA-SVMR models, respectively. In this study, the hyper-parameters were adjusted to derive the optimal predictive performance of the predictive models, and based on this, the SVMR and CATPCA-SVMR models were developed. For the performance evaluation of the two developed models, we tested the precision and accuracy through Pearson’s correlation coefficient (R), root mean square error (RMSE), coefficient of determination (R2), and mean absolute error (MAE).
Data source of DWGR and data pre-processing
The raw data in this study include the demolition waste generation rate (DWGR) (kg/m2) information of 784 buildings along with architectural characteristic information, such as region, use of building, structure, wall material, roof material, and gross floor area (GFA). The use, structure, wall material, roof material, and GFA are key features used in the ML predictive models, and DWGR is a dependent variable. Among the features, the use, structure, wall material, and roof material are categorical variables, and the GFA and DWGR are continuous variables. The definition of DWGR in this study is shown in Eq. (1).
Here, DWGR is the demolition waste generation rate (kg/m2), A is the amount of a building (quantity) (kg), and GFA is the gross floor area (m2).
The construction of a reliable dataset is required to improve the predictive performance of a predictive model. Data pre-processing is performed to build a reliable dataset, and it includes techniques for cutting, adding, and converting training data (Kuhn and Johnson, 2013; Nisbet et al., 2009) [19, 20]. In this study, outlier removal and standardization were performed to build a reliable dataset. The outlier removal follows Eq. (2), and the standardization follows Eq. (3).
where IQR is the interquartile range and the value of IQR is Q3 minus Q1, Q is quartile, Q1 is the 25th percentile, and Q3 is the 75th percentile.
Here, is the element of data, is the average of data, and is the standard deviation of data. After data pre-processing, the DWGR data of 690 out of 784 buildings were applied to develop the DWG predictive model.
Applying categorical principal components analysis
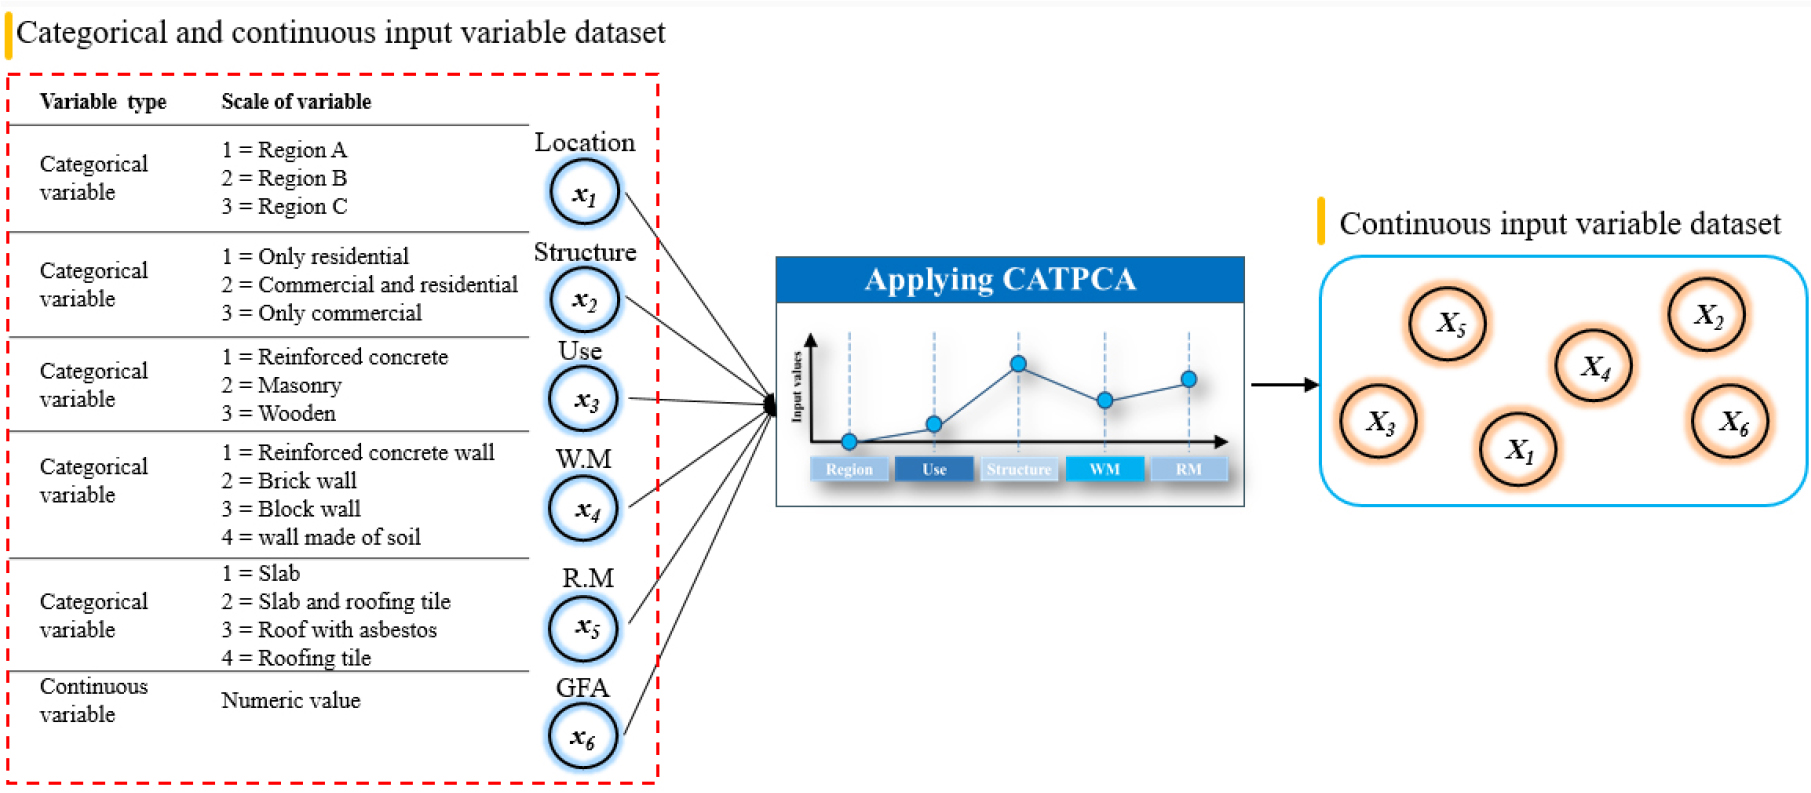
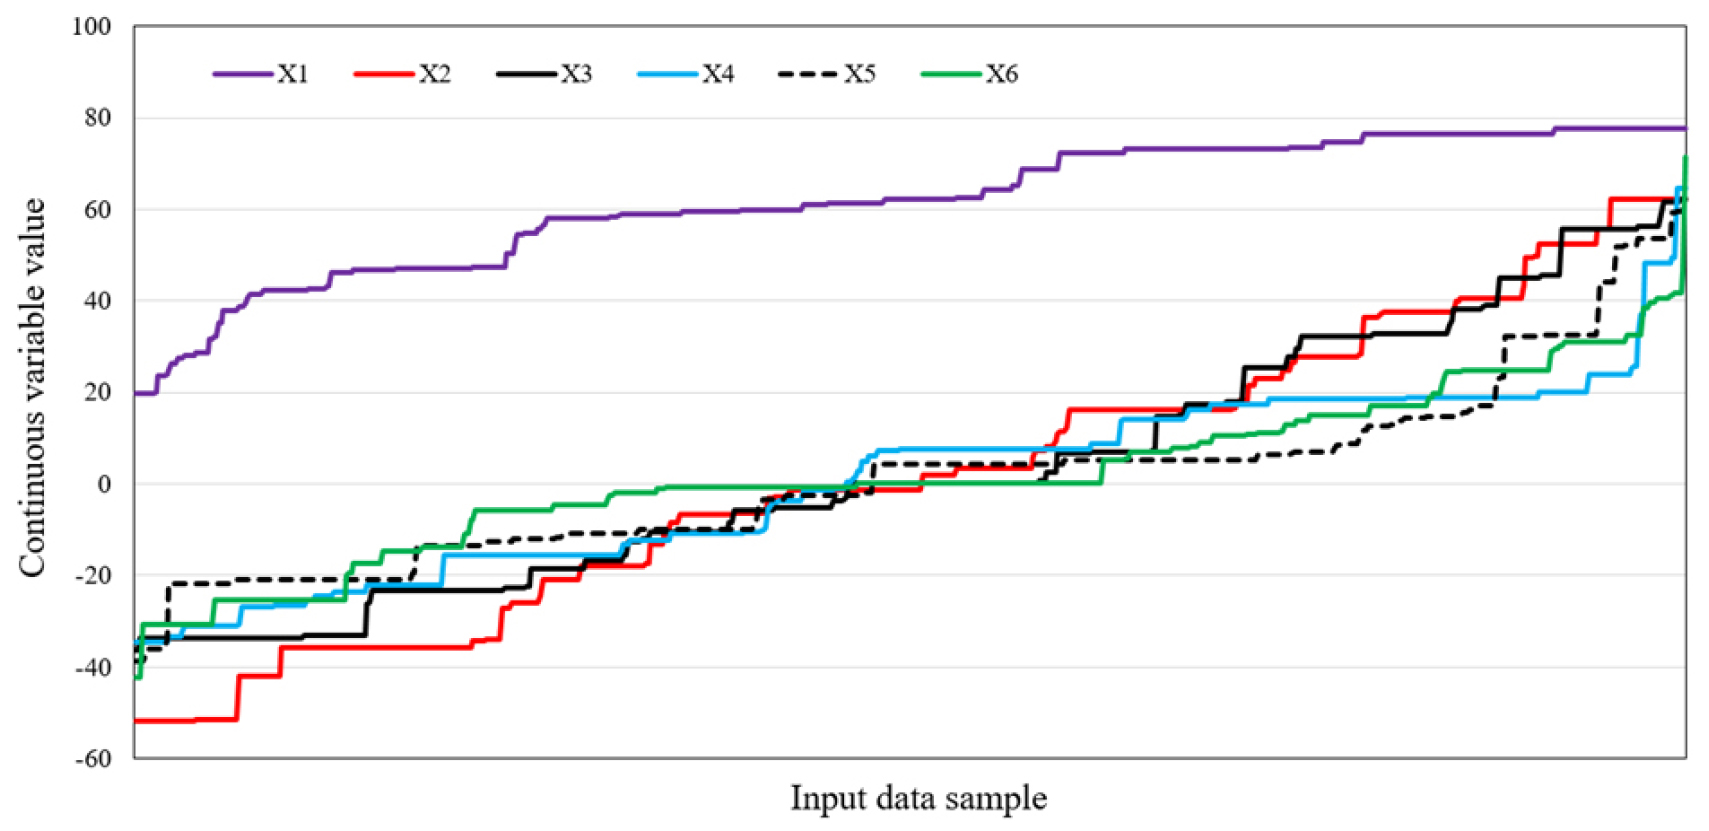
Principal components analysis (PCA) is a statistical method used to solve complex variable problems for a large number of variables (Camdevyren et al., 2005) [21]. In general, PCA aims to reduce a large number of variables to a smaller number of variables, which are called principal components that explain the variance of data. PCA works well when continuous variables are targeted, and it is not suitable for categorical variables (Khikmah et al., 2017) [22]. Conversely, CATPCA was developed for data, such as nominal and ordinal variables that have no linear relationship with each other (Linting et al., 2017) [23]. In this study, we used the CATPCA technique of the Python package “Prince” to convert the categorical data into continuous data. As shown in Figure 2, six features in this study can be converted into six continuous variables through CATPCA. Here, X1-X6, which were converted into continuous variables, do not signify existing variables x1-x6 (location, structure, use, WM, RM, and GFA, respectively). Figure 3 shows the result values of continuous variables converted through CATPCA.
Applying SVMR algorithm and hyper-parameters combinations
SVM can obtain good results, especially when solving classification or regression problems with small samples, high dimensions, and local minimum points (You et al., 2017) [24]. The SVMR generalized the SVM to predict arbitrary real number values and to solve a regression problem, the input variables are mapped to the feature space through the kernel function, thereby composing a linear function. Here, in the feature space, the structural risk minimization principle is applied to compose the optimal decision function. A linear -insensitive loss function is selected in the standard SVM regression. The optimization objective of the standard SVM regression is formulated as Eq. (4) (Noori et al., 2008) [25].
Here, is a vector of weights in feature space, and are positive slack variables specifying the upper and lower training error subject to an error term (), C is the penalty parameter, and n is the sample size.
If Lagrangian multipliers and Karush-Kuhn-Tucker conditions are applied to Eq. (4) to solve a problem for an unknown number, a general regression equation of SVMR, Eq. (5) is derived.
Here, is the learning vector and is the support vector. is the kernel function, and the kernel function is expressed as Eq. (6)
In SVMR, the choice of coefficients cost (C), gamma, and kernel parameters are the most important (Abbasi et al., 2013) [14]. The constant C (>0) is a weight that determines the balance between network complexities, and the kernel function significantly influences the generalization ability (You et al., 2017) [24]. In this study, the Gaussian radial basis kernel function (also referred to as radial basis function (Rbf)), which has high flexibility and generality, is applied as the kernel function. Furthermore, the best parameters are determined for the Cost (C) and gamma values through the LOOCV process, and in this study, 0.001 and 1 are applied as the Cost (C) and gamma values, respectively. For other parameters, the default values of Python “sklearn.svm” are applied. Table 1 shows the hyper-parameter values used for the development of the SVMR models in this study.
Table 1.
Hyper-parameters combinations of SVMR algorithm in this study
Model validation
In general, k-fold cross-validation (CV) is most widely used as a validation method for ML models; however, if the dataset size is small, it is appropriate to use LOOCV (Witten et al., 2011) [26]. This is to secure a sufficient training set and a sufficient validation set because the number of data required for validation is insufficient. In LOOCV, all samples undergo the test. Therefore, when a small dataset is used, LOOCV has the advantage that more stable results can be obtained compared to the validation set approach of a conventional CV method (10-fold or k-fold CV method) (Cha et al., 2020; Shao, 2016) [27, 28]. In this study, therefore, the LOOCV technique was applied as a validation method for the models, considering the size of the datasets. For the performance evaluation of the predictive models in this study, we used four statistical metrics (i.e., MAE, RMSE, R2, R). The definition of each performance evaluation indicator is shown in Eqs. (7), (8), (9), and (10), respectively.
Here, is the observed value of the generated DW amount, is the predicted value of the generated DW amount, is the average observed value of the generated DW amounts, is the average predicted value of the generated DW amount, and n is the number of samples.
Results
Model performance
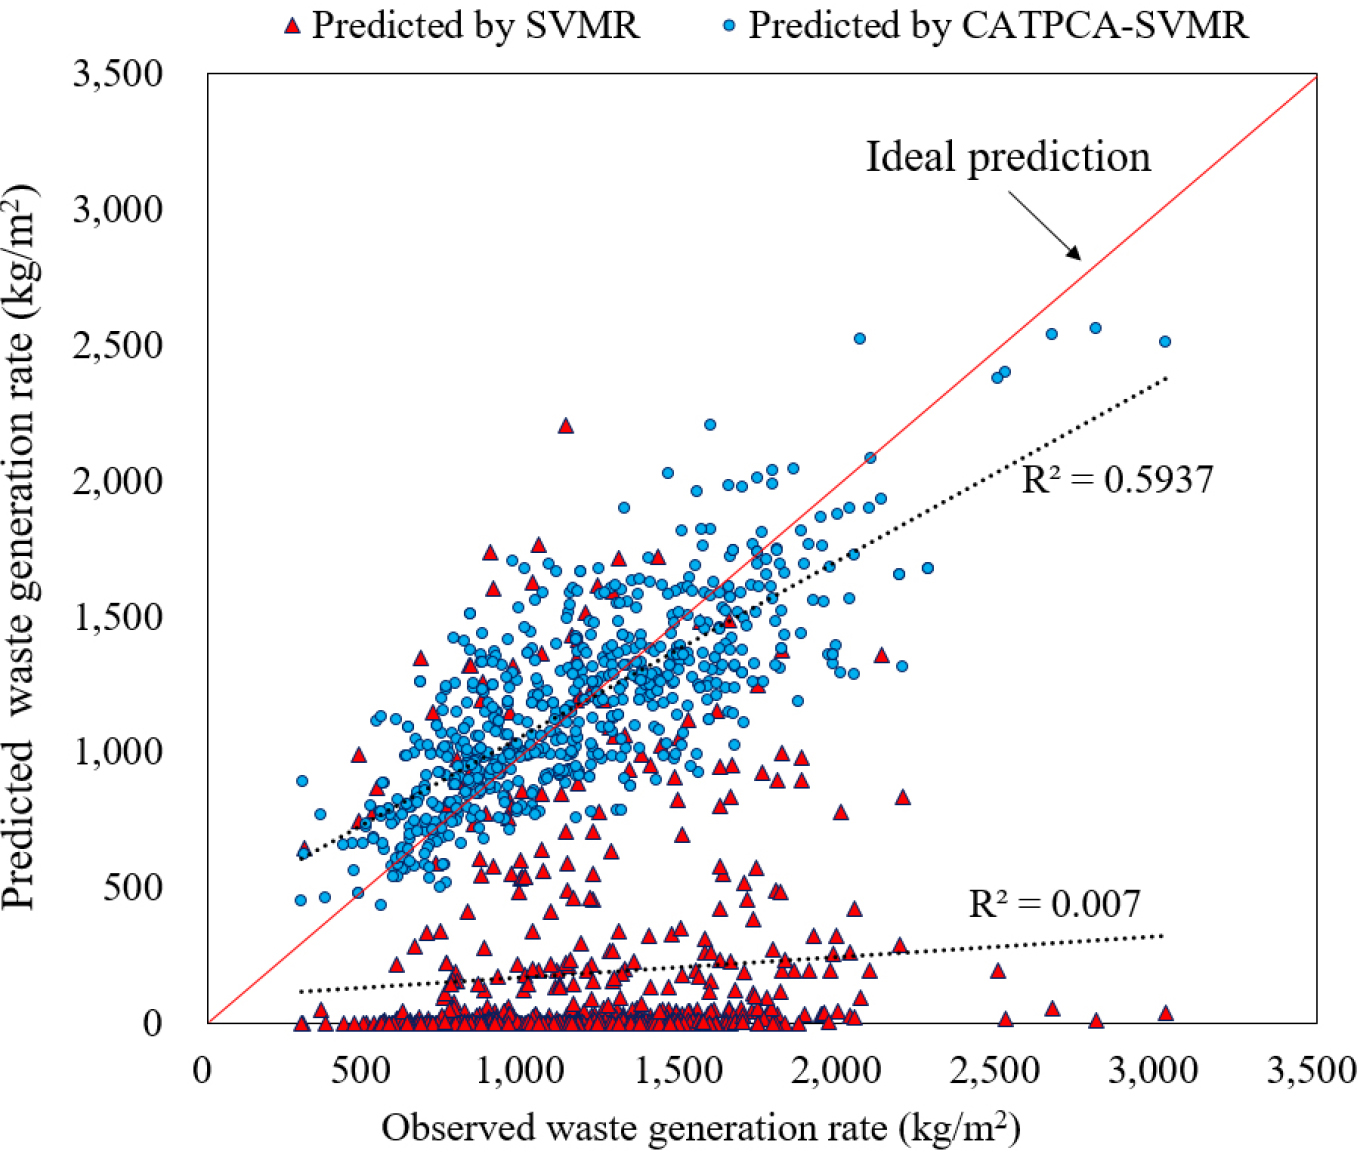
In this study, we developed SVMR and CATPCA-SVMR predictive models for small datasets consisting mainly of categorical variables. Table 2 and Figure 4 show the results of the performance metrics for the two models. The predictive performance of the SVMR predictive model is low, showing an MAE value of 2020.304, RMSE value of 1116.264, R2 value of 0.007, and R value of 0.083. Furthermore, there seems to be almost no correlation between the predictive and observed values, as shown in Figure 4. The reason is that categorical input variables are not suitable for the SVM algorithm because SMV is based on Mahalanobis distance (Ye et al., 2007) [24]. Conversely, the results of the CATPCA-SVMR model show significant improvements. As for the predictive performance of the CATPCA-SVMR predictive model, the MAE, RMSE, R2, and R values are 202.228, 261.445, 0.594, and 0.770, respectively. This model shows excellent predictive performance despite being a predictive model developed based on a dataset of 690 DWGRs. As shown in Figure 4, the distributions of the predictive and observed values of the CATPCA-SVMR predictive model are concentrated on the ideal prediction line. Therefore, the application of CATPCA to datasets comprising categorical variables is a useful method to improve the predictive performance of the SVMR model.
Table 2.
Comparison of models’ performance by MAE, RMSE, R2, R
| Model | MAE | RMSE | R2 | R |
| SVMR | 2020.304 | 1116.264 | 0.007 | 0.083 |
| CATPCA-SVMR | 202.228 | 261.445 | 0.594 | 0.770 |
Comparison of predictive models
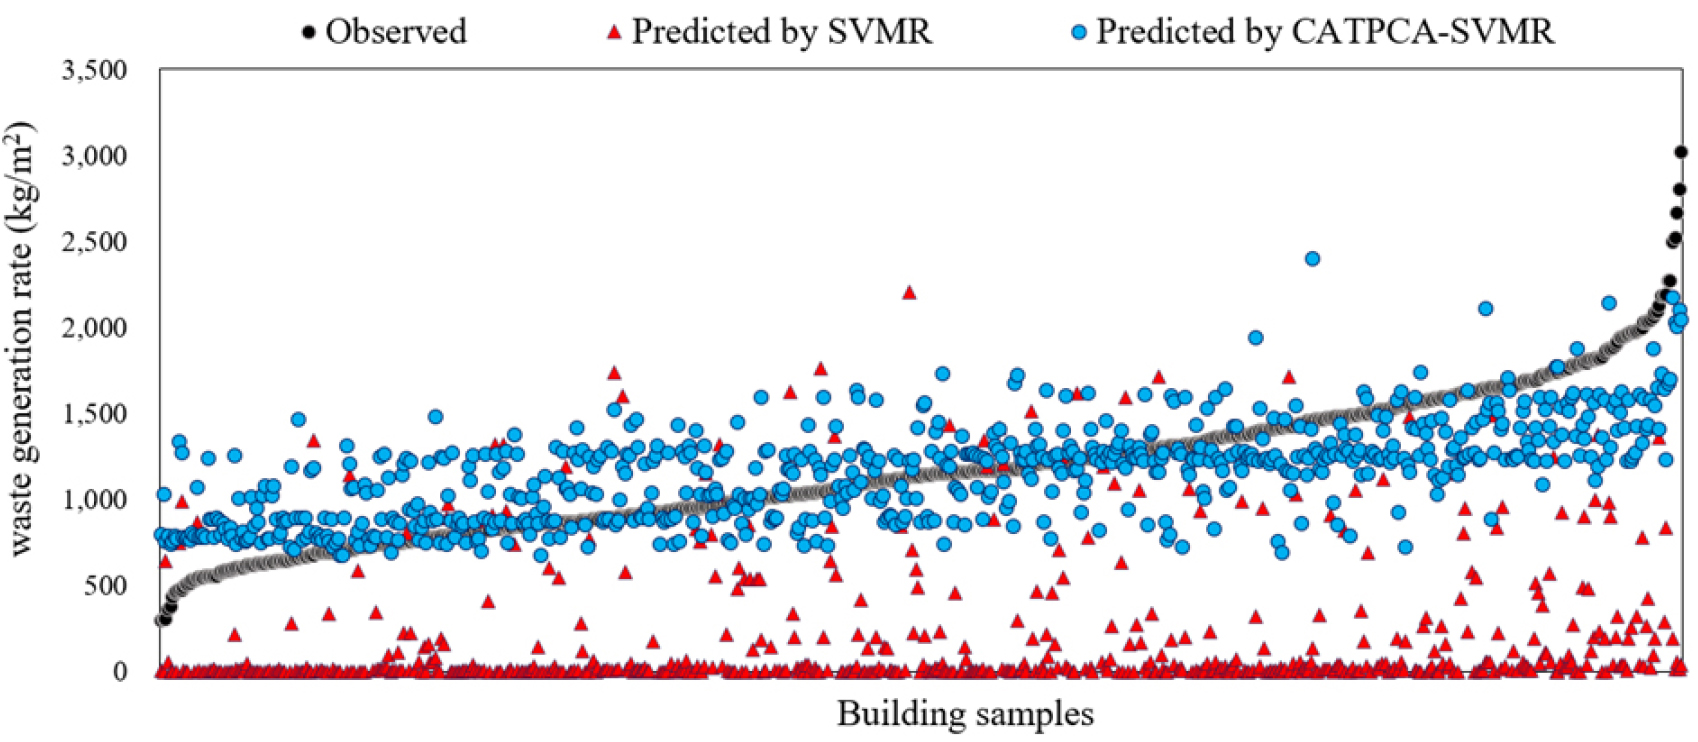
In the previous section, the hybrid predictive model that applied the SVMR algorithm and CATPCA technique showed a significant increase in predictive performance. Figure 5 shows the observed and predicted values obtained by the SVMR predictive model and the CATPCA-SVMR predictive model, respectively. The predicted values by the SVMR predictive model show significant difference from the observed values. Conversely, the predicted values by the CATPCA-SVMR predictive model are quite close to the observed values. The results in Figure 5 imply that the application of the CATPCA technique and the development of the hybrid DWG predictive model for a small dataset comprising categorical variables performed in this study are appropriate ways of improving the predictive performance of the predictive model.
Discussion and Limitation
In this study, we presented the hybrid ML model development and method that can improve predictive performance in a special data environment (i.e., categorical variables and a small dataset). Previous studies (Noori et al. (2009) [8]; Noori et al. (2008) [25]) used the PCA technique mainly as a simplification process of the input variables applied to the model. Noori et al. (2009) [15] used PCA for s13 input variables to develop a PCA-multi linear regression (PCA-MLR) model. In the study, the 3PCs-applied PCA-MLR model (R=0.445) exhibited the best result. Noori et al. (2008) [16] developed a PCA-SVM model for MSW generation prediction, and the 6PCs-SVM model (R2=0.7516) that had six variables among 13 input variables showed the best result. These studies were conducted using continuous input variables. In addition, the existing studies (Abbasi and El Hanandeh. (2016) [9]; Kumar et al. (2018) [10]; Abunama et al. (2019) [11]; Noori et al. (2008) [25]; Dai et al. (2011) [29]) on the DW prediction model using SVM algorithm were able to secure predictive performance through a dataset consisting of only continuous variables. It is the reason that the categorical type is an inappropriate variable type as a variable of the SVM algorithm. Conversely, this study focused on converting categorical variables into continuous variables by applying CATPCA. A hybrid DWG predictive model was also developed by applying the CATPCA technique to improve the performance of the model by the SVMR algorithm, which is not suitable for categorical input variables. As a result, we proposed a CATPCA-SVMR DWG predictive model that has excellent predictive performance (R2 value 0.594, R value 0.770) despite having been developed based on a small dataset. Therefore, this study has presented a development method for a novel hybrid DWG predictive model that can improve predictive performance in an insufficient data environment. Considering that AI models are driven based on large datasets (Abdallah et al., 2020 [18]), the result of this study is quite valuable. Nevertheless, the dataset size that is not sufficiently large is the fundamental limitation of this study, and securing a sufficiently large dataset is an important challenge. In addition, the dataset consisting of 6 variables used in this study has difficulty in reflecting all the characteristics of 690 buildings. Considering this, it seems necessary to add variables other than the key features used in this study. Therefore, it seems that we need to conduct additional studies to improve predictive performance by securing larger datasets in the future.
Conclusions
This study was conducted on a hybrid DWG predictive model for performance improvement with a small dataset comprising categorical variables. For this, we adopted an SVMR model and applied the CATPCA technique to develop SVMR and CATPCA-SVMR DWG predictive models, respectively, and conducted the performance evaluations. Therefore, the conclusions of this study are as follows.
First, categorical variables can be converted into input variables by applying the CATPCA technique, based on which, application of various ML algorithms can be expanded. In this study, only the SVMR algorithm was applied, but various ML algorithms suitable for continuous variables can be applied similarly, and predictive performance improvement is expected. Concisely, this study proposed a method that can improve predictive performance by applying various ML algorithms for datasets comprising categorical variables using CATPCA.
Second, we developed a CATPCA-SVMR predictive model for DWG prediction. Herein, a hybrid model for DWG prediction using SVM and CATPCA was proposed. The CATPCA-SVMR model (R2=0.594, R=0.770) showed significantly improved results compared to the SVMR model (R2=0007, R=0.083), and despite using a dataset of 690 buildings, it showed stable prediction performance.
This study was conducted on CATPCA-applied DWG predictive model, which has not been researched in the C&D waste management field yet. It seems that the novel hybrid ML model development method can be sufficiently used in other regions as well. Furthermore, the results of this study are expected to help mitigate the data requirements in constructing DWG information required for DW management strategies and develop appropriate DWG predictive models in various data environments.
Abbreviations
AI, Artificial Intelligence;
CATPCA, categorial principal components analysis;
C&D waste, construction & demolition waste;
DW, demolition waste;
DWGR, demolition waste generation rate;
GFA, gross floor area;
LOOCV, leave one out cross validation;
MAE, mean absolute error;
ML, machine learning;
PCA, principal components analysis;
R, Pearson’s correlation coefficient;
R2, coefficient of determination;
RMSE, root mean square error;
SVMR, support vector machine regression
