

Introduction
Material and Methodology
The case study
Building energy dynamic simulations
Building energy dynamic model
Results discussion
Monitoring campaign
Post-occupancy measurements
Results discussion
Measured data and simulation data comparison
Conclusions
Introduction
The Italian Long-Term Strategy to 2050 [1] provides a series of planned measures and policies to fully decarbonize the residential sector. This means that 2/3 of the existing buildings need to be renovated in the next 30 years.
With over 12 million buildings and 35 million residential units, in Italy the incidence of the residential buildings stock is among the highest in Europe (84% of existing buildings are residential compared to 76% in France and 68% in Germany) [2]. Despite the current “virtual” rate of deep renovation is 0.85% (with energy saving of 0.332 Mtoe/year) [3], the civil sector continues to be responsible for approximately 45% of final energy need, 28% of which is attributable to the residential sector, so it has a very large energy saving potential.
Over 60% of the residential buildings stock is over 45 years old and it was built before the first energy-saving national law (Law 373/1976). Over 25% of these buildings have annual consumption ranging from 160 KWh/m2 per year to over 220 KWh/m2 per year [4].
Looking at historical trend and future scenario based on current policies and Integrated National Energy and Climate Plan [5], the civil sector can contribute to GHG reduction for 2030 compared to 2050 for about 35 MTCO2eq, an expected results enhanced by the increase in renovation measures and the application of high- performing solutions for building envelope and technological systems.
Furthermore, in the last few years, the Italian policy framework has provided specific funding measures (Superbonus 110%, Ecobonus, Bonus casa, etc.) for energy efficiency, seismic safety, integration of renewable energy sources of existing building stock [6].
Consequently, these policies have marked a significant growth of the renovations market with specific reference to energy efficiency-related refurbishments, and the national rates of deep renovation have increased, and it is now higher than for new construction.
Nowadays, many studies are being performed in the field of deep renovation exploring innovative approaches and simulation tools to evaluate the effectiveness of benefits from appropriate retrofitting actions [7, 8, 9, 10].
A study [10] has suggested a systematic approach for sustainable building retrofits focusing on strategic planning and methods distinguishing between pre-retrofitting activities and post-retrofitting activities. The authors highlighted how reliable estimation and quantification of energy benefits are essential in decision-support system for prioritization of retrofit measures. However, is evident a difference between the predicted and measured building energy consumption in literature, known as Energy Performance Gap (EPG). In [11] common findings between research coming from different European countries have been synthesized to identify the causes and solutions to the Energy Performance Gap in residential buildings across Europe.
A wide range of research focuses on the development and application of appropriate models and strategies for building performance assessment to increase the level of confidence in potential retrofit benefits. Although, more comprehensive research suggests improvements for model calibration associating building energy simulation to monitoring to better predict the reliable energy savings of the building and post- retrofit increased comfort levels for the occupants [12, 13, 14].

Moreover, it should be noted the importance of evaluating the measures after the occupancy to reduce the energy performance gap and how benefits from deep renovation of existing buildings are associated with health benefits [15]. Thus, achieving a high level of energy efficiency while providing adequate climate comfort for each type of building is becoming a challenge.
Several studies on practical case studies [16, 17, 18] have shown positive effects on energy performance in the building as well as provided a better indoor environment in the building, achieving healthy Indoor Air Quality and successful provision of thermal comfort for the occupants.
Furthermore, considering the retrofit design process, energy simulation and modeling tools are commonly used to provide quantitative information on the performance of the examined building and to identify the optimal design/renovation strategies by comparing different scenarios. In this framework, findings from several scientific studies [19, 20, 21] show the effectiveness of simulation-based multi-criteria decision-making to assist decision-makers under multiple objectives and parameter uncertainty.
Accordingly, the purpose of this work is to perform a predictive analysis of the energy behavior of a historical residential building located in Italy, using energy simulations and post-occupancy evaluation analysis to define the improvements of the retrofit measures adopted in the design phase to increase the energy performance of the building envelope and plant systems and to enhance the indoor comfort. In detail, the study refers to the deep renovation of a terraced house in Florence built in the early 1900s.Terraced houses are a very common building typology in Italy, so results from this study could be extended to many buildings with similar construction features. Built mainly before 1945, although they often present architectural features, and are not structurally and energetically adequate to contemporary standards. Accordingly, there is an urgent need to upgrade them, improving the energy performances of the envelope and the plant systems without changing their stylistic characteristics.
The methodology followed in this work and the description of the case study is presented in Section 2. This section also describes the structural and energy renovation strategies applied, focusing on explaining the technological solutions chosen in the design phase. The Section 3 shows the dynamic energy simulation developed to verify if the energy targets defined in the design phase were achieved. Finally, Section 4 presents a post-occupancy evaluation analysis performed to evaluate the thermal comfort and Indoor Air Quality (IAQ).
Material and Methodology
This research work is based on a simple methodological workflow, presented in Figure 1, that designers and facility managers can usefully replay to evaluate building retrofit actions by energy simulation modeling and post-evaluation analysis.
This method consists of a sequence of following four main stages:
1) Preliminary analysis and data collection;
2) Building thermal dynamic simulations;
3) Post-occupancy measurements;
4) Coupling measured data and simulation model;
The main objective of stage 1 is to set project targets and chose the building retrofit options to meet minimum energy requirements.

As a starting point, an in-depth understanding of the building in its current state is necessary to provide specific information (constraints and features) for identifying the possible interventions aimed at structural retrofit and energy saving. In this phase, mandatory issues and restrictions have been taken into accounts, such as policies and regulations for the renovation of existing buildings, available technologies to implement retrofit solutions, economic resources, time schedule, and client expectations.
In stage 2, a bottom-up approach was adopted to perform a retrofit analysis of the building by means of energy simulation tools, comparing results from two different scenarios, respectively, before and after renovation. The aim of this phase is to assess the building’s energy-saving in terms of energy demand reduction and improvement of indoor comfort for users (based on Fanger’s indices) after renovation. The thermal model of the building was developed using EnergyPlus simulation software [22]. The data employed to generate the thermal models concerned the building’s physical, environmental, and energy characteristics, including envelope optimization and heating/cooling and ventilation systems improvements.
In stage 3, on-site ambient measurements after refurbishment were carried out to assess the real advancement of retrofit measures in terms of Indoor Air Quality and thermal comfort perceived by users. The process started by setting up a recording system of air temperature, relative humidity, and CO2 levels to study thermal conditions in selected rooms of the terraced house. In addition, measurements of the physical parameters necessary to determine PMV and PPD were carried out in the kitchen, where users spend a long time during the day.
Finally, the thermal building model was updated by coupling measured data from the post-occupancy monitoring campaign within a dynamic energy simulation model to reduce the gap between real and simulated building performances. This step can be helpful to obtain better predictions in terms of energy use and occupants’ comfort sensations and for future applications such as the optimization of building management systems (BMS).
The case study
The building chosen as the case study is a terraced house built in the early 1900s in neo gothic style, and it is in a central neighborhood of Florence. This building was refurbished in 2019 for use as a single-family home (Figure 2).
It consists of a two-story apartment with an underground cellar and an attic on the second floor. A living space, a kitchen, and a bathroom are located on the ground floor. Likewise, three bedrooms and two bathrooms are located on the first floor. The total heated floor area is 222 m2 (Table 1). The terraced house shares side walls attached to dwellings on east and west sides, so the exterior walls have north and south exposure. The front facing the main street shown a decorative stone cladding, while the opposite front facing north is covered with plaster.
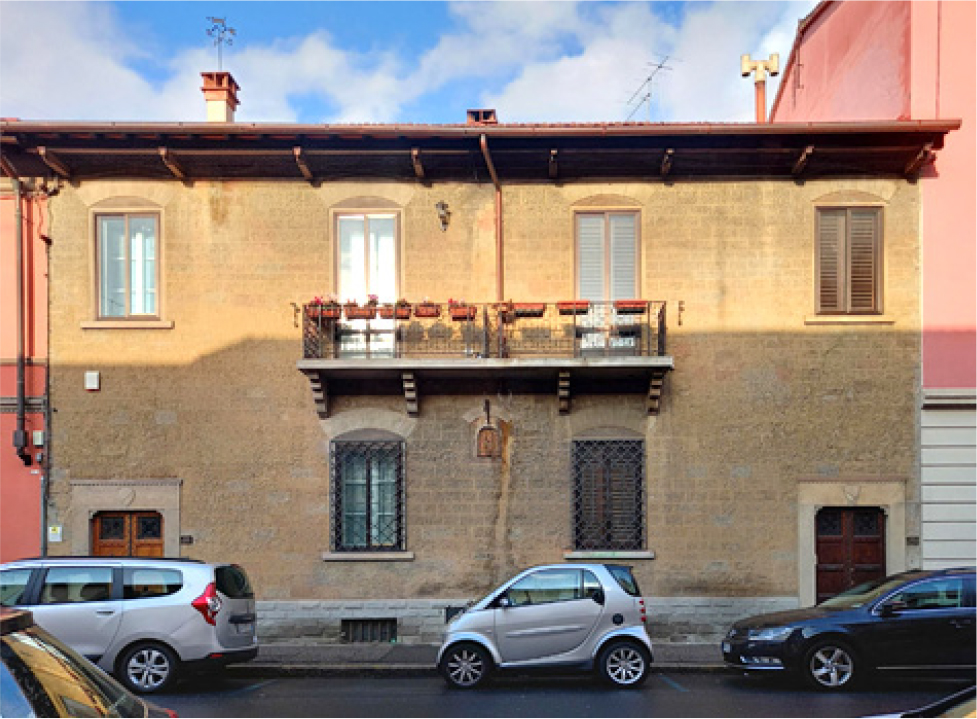
Table 1.
Geometric data of the building
| Heated Floor Area | 222 m2 |
| Heated Air Volume | 818 m3 |
| Envelope Surface | 303 m2 |
| Surface To Volume Ratio S/V | 0.37 m-1 |
The thermal performances of opaque and transparent envelopes were poor before renovation. The two external facades and the wooden pitched roof did not show thermal insulation. Furthermore, the windows were realized with a wooden frame and single glazed. Finally, a conventional and old plant system was used for heating service and domestic hot water based on a gas boiler with radiators. The deep renovation concerned seismic improvements and energy retrofit of the building to meet the current seismic and energy requirements from Italian regulations (Figure 3).

The retrofitting action aimed to reduce energy demand for heating and cooling, improve indoor comfort, and achieve a high energy efficiency level corresponding to the most performing energy class (class A4) according to the Italian Standard on Energy Performance Certification of Building.
For structural improvement of the building, all the slabs were entirely rebuilt with a timber structure, reinforced with steel bracing, and fixed to the masonry walls. A steel structure and cross-laminated timber panels were used for the new roof. All the slabs were connected to each other by an internal staircase made of reinforced concrete. Furthermore, the seismic upgrading concerned the application of reinforced plaster on the interior structural walls.
Regarding energy improvements, a thermal priority was to reduce the heat losses during the winter season. For this reason, different solutions for thermal insulation to upgrade the building envelope were adopted to improve the energy performance and thermal comfort (Figure 4). In detail, the retrofitting solution for the south façade concerned the application of polyiso-foam boards (5 cm - thick) thermal insulation on its interior surface to preserve its original feature and architectural value. Furthermore, the same insulation material (10 cm - thick) was used to insulate the front-facing north and the roof. At the same time, the ground floor was insulated with 10 cm thick EPS, and the old windows were replaced with new wooden frames with thermal break and Low-E double glazing filled with Argon gas (U-window-value: 1,050 W/m2 K).

Comparing the U-values of the building envelopes proposed after renovation (Table 2) with the minimum requirements provided by Italian building thermal regulation (Law 90/2013, Decree 26/06/2015), only for the main façade is above the reference (0.382 W/m2 K for the case study and 0.29 W/m2 K in regulation for deep renovation); while all the other building elements achieved U-values well below the reference values.
Table 2.
Thermal characteristics of the opaque and transparent envelope components
About the active strategies related to the plant system integrated into the building to reduce its energy consumption during the year, a hybrid system was installed to provide heating/cooling and Domestic Hot Water (DHW). The new system takes advantage of both traditional and renewable energy sources consisting of a backup condensing gas module (23.9 kW) and a heat pump module (11.3 kW). Their main features are described in Table 3.
Table 3.
Heat pump and condensing gas module main features
In compliance with the current Italian laws concerning energy saving, this plant system was equipped with a home Building Management System (BMS) designed to provide independent multi-zone thermoregulation by a chrono-thermostat and thermostatic valves placed on each radiator. Moreover, automatic control of room temperature allowed to operate on the specific conditions of a single room to optimize heat consumption and reduce it to the real needs of the users: this strategy was finalized to decrease energy waste and avoid the phenomenon of overheating.
The BMS system of the house worked based on an operating economic savings algorithm as described below.
Depending on the operating conditions of the heating system (outdoor air temperature and water delivery temperature set-point for heating and for DHW production), the control unit can compare instantly economic cost (€/kWh) provided by the natural gas condensing boiler to that one provided by the heat pump and, consequently, makes to work the unit more convenient.
Based on the following input data:
-the Coefficient of performance (COP) of the heat pump and how it varies with Inlet and Outlet Temperature;
-the average annual efficiency of the natural gas condensing boiler - the average natural gas and electricity prices per year (€/kWh).
However, the gas condensing boiler is activated when: i) the energy demand for heating and DHW becomes higher than that provided by the heat pump; ii) for daily anti-legionella disinfection of the DHW boiler, which takes place for a couple of hours at night.
Finally, a mechanical ventilation system with heat recovery is integrated with hydronic fan coils for cooling during the summer season.
Building energy dynamic simulations
Building energy dynamic model
The building thermal-energy dynamic analysis was performed within the EnergyPlus v. 8.9.0 simulation environment with Google Sketchup graphical Interface.
A thermal model of the building was generated as a base case to represent the building before renovation. It was divided into 11 thermal zones according to the intended use. The side walls, in common with the other dwellings, were considered adiabatic (Figure 5). As for the envelope materials, opaque components and windows were modeled in terms of physical and thermo-hygrometric characteristics such as thickness, thermal transmittance, g-factor, and reflectance to solar radiation, emissivity, thermal conductivity, and visible transmittance.

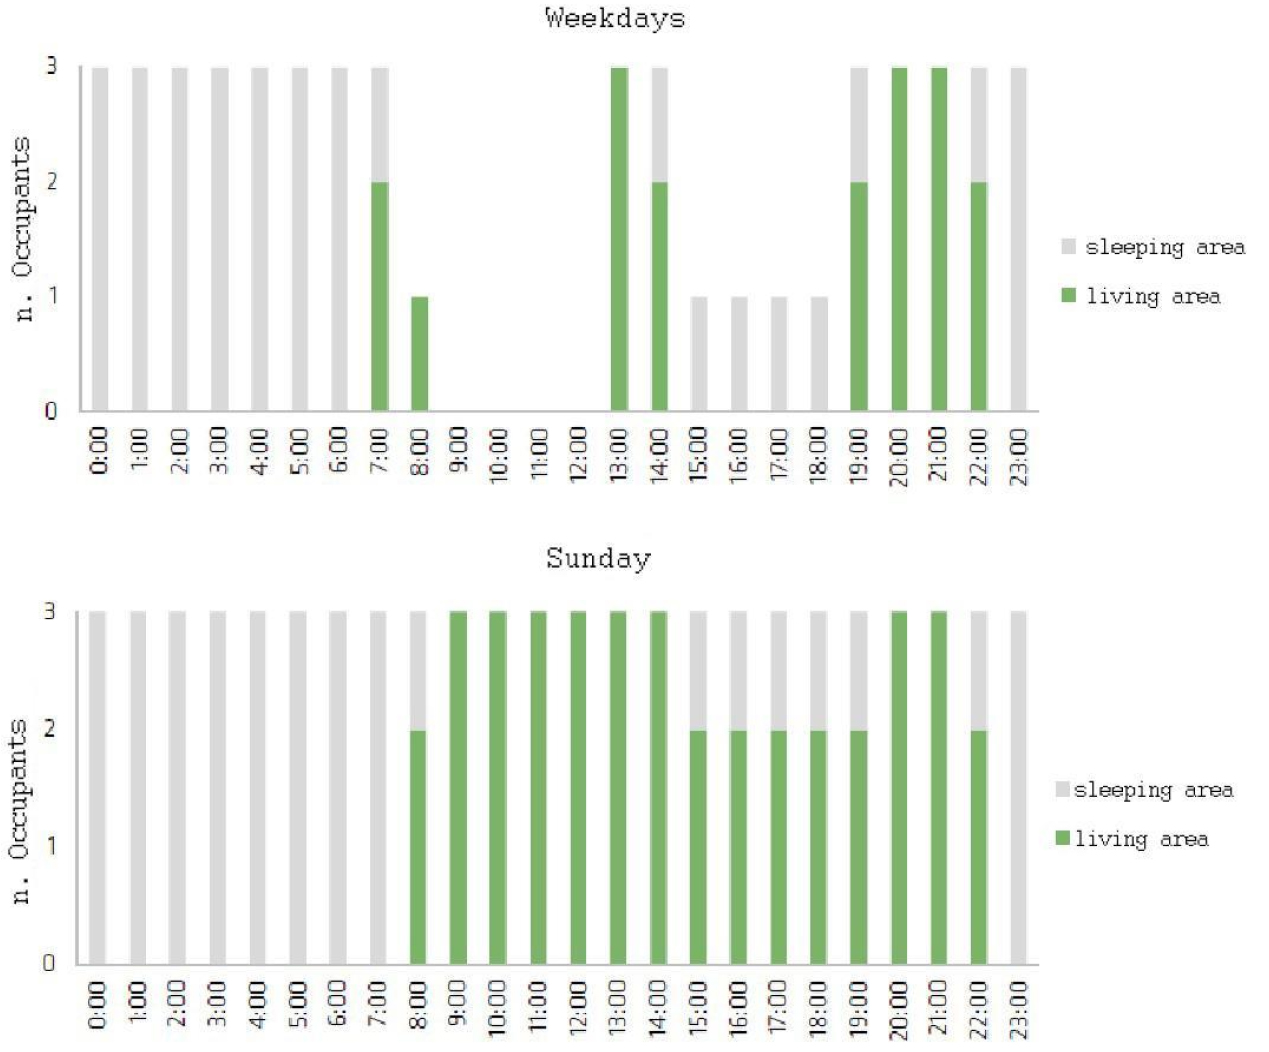
The internal heat gains and occupancy data refer to a typical profile for a residential building, occupied by a family of a couple with a young daughter (three users). Additionally, the users were interviewed about their habits to define the modeling features related to occupants’ behavior. The occupancy schedule used for simulation is shown in Figure 6.
The air infiltration rate (ACH) for the Base case was set equal to the values suggested for residential buildings with no mechanical ventilation according to UNI EN 15251 [23], as follows:
-0.5 h-1 for all the zones during winter days (day and night) and the daytime hours of the summer season;
-4 h-1 during nighttime in the summer season, supposing that occupants’ open windows for night cooling.
In order to evaluate the heat demand of the building the EnergyPlus model “ZoneHVAC:IdealLoadsAirSystem” was used as a conventional heating system: the limit value of the maximum was set according to the power of the radiators. At the same time, the setpoint temperature of the heating system was set at 20°C for the heating period (1 Nov - 15 Apr) and at 26°C for the cooling period (16 Apr - 31 Oct) in accordance with the Italian regulations on energy efficiency (Law n. 10/1991 and DPR n. 412/1993).
Three different schedules (30 W/m2, 20 W/m2, and 8 W/m2) were assumed for artificial lighting (provided by incandescent light bulb devices) depending on the high, medium, and low level of occupation of a zone during the day. The use of electrical equipment was also hypothesized based on the occupants’ habits.
With reference to the building model after renovation, Model 1 was generated with the same geometry as the base case, implementing all the retrofit actions illustrated in paragraph 2.1. The air change rate was set 0.05 h-1 considering the high airtightness of the building envelope because of retrofit actions on thermal insulation of opaque walls and windows replacement. At the same time, the schedules of artificial lighting (provided by LED light technology) were assumed 15 W/m2, 10 W/m2, 5 W/m2 depending on the occupation profiles of each zone.
Figure 7 illustrates the scheme used to model the hybrid system’s heating/cooling and Domestic Hot Water (DHW).

Results discussion
Energy simulation was carried out comparing results from two different scenarios, Base case and Model 1, respectively,before and after renovation. Results are related to 1) the building energy demand for heating and cooling 2) the users thermal comfort based on Fanger’s Model.
The analysis approach was firstly to investigate the effect of the internal gains on the energy balance and to verify if the thermal performance of the building envelope can prevent overheating problems during summer season and consequently to reduce cooling energy demand of the building. Accordingly, a comparison on indoor air temperature profile and energy needs for heating and cooling was carried out considering two scenarios, with internal gains and without internal gains, both in the Base case and Model 1. The results show that in the Base case, the internal gains have effect on the cooling needs increase, especially in the summer period, when indoor mean air values exceed 26°C, so air cooling works from May to September (Figure 8a). Meanwhile in the Model 1 with internal gains, the results show that temperature values are below the T set-point (26°C) for most of the time, and exceed this value in July and August, less frequently compared to Base case. This evidence good performance of building envelope in summer season too, allowing a significant indoor air temperature decrease. In fact, the use of cooling system during hot season is decreased, since the indoor air temperature reached always the operating temperature of 26°C.
Figure 8b shows the difference between energy demand for heating and cooling throughout the year before and after the building renovation, with a reduction for heating demand by 71% (from 5.65 kW to 1.63 kW) and for cooling demand by 53% (from 6.50 kW to 3.05 kW).

Furthermore, a dynamic simulation for assessing users’ thermal comfort was carried out using the calculation of the predicted mean vote PMV and the predicted percentage of dissatisfaction PPD Indices in accordance with the Fanger method and ISO 7730 [24].
This analysis aimed to demonstrate if the retrofit measures guaranteed an adequate climate comfort for users after renovation comparing the results between Base case and Model 1.
For these purposes, the investigation was focused on the same specific space of the house (the kitchen), which could showing some critical issues also after the renovation for its the north exposure and local discomfort due to cross ventilation, and also because the three users spend most of their time in this common space.
Figure 9 illustrates the PMV and the PPD results throughout the year comparing the simulation models before and after renovation and depending on users’ activities and clothing value variation over the seasons.

Results show a PMV index values range from -0.5 to +0.5 most of the time, which describes the feeling of thermal neutrality. The retrofit measures made it possible to obtain a PMV index reduction from -0.36 to -0.12 on average (-67%) and a PPD index reduction from 8.95 to 6.11 (-32%), while the hours in which discomfort is perceived have been reduced by 94%, from 451to 27 hours per year.
Monitoring campaign
Post-occupancy measurements
A post-occupancy monitoring campaign was carried out from 30th January to 24th February 2021, to monitor IAQ and thermal comfort of occupants during wintertime to validate the design strategies to increase the building energy performances. Indoor comfort data were collected continuously from a kit of sensors located in different rooms of the building. In detail:
-the indoor air temperature and relative humidity were monitored using six Tinytag Ultra 2 TGU-4500 temperature and humidity data loggers (measuring range: -25 to +85°C / 0 to 95% RH, Accuracy: ±0.3°C / ±3.0% RH). Two sensors were placed in the living room and in the kitchen on the ground floor; two in the bedrooms on the first floor, one in the office located on the second floor, and finally, one also in the outside area of the building to measure outdoor parameters (Figure 10);

-the CO2 level was measured using a Tinytag CO2 — TGE-0011 air quality data logger (measuring range: 0 to 5,000ppm, Accuracy: ± (50ppm +3% of measured value). One sensor was placed in the living room on the ground floor, and the other one was located in the bedroom on the first floor;
-a thermal microclimate unit Delta OHM HD32.3TA for the measurement of PMV (mean predicted vote), PPD (predicted percentage of dissatisfied) was located in the kitchen (Figure 11). Specifically, this monitoring unit was equipped with:
-a globe temperature probe Pt100 sensor, globe Ø 150 mm (measuring range −30°C…+120°C);
-a combined capacitive RH sensor and Pt100 temperature sensor (measuring range: T: -40…100°C - R.H.: 0…100%, Accuracy R.H.: ±1.5% (0…90%RH) / ±2% (90…100%RH); T=15…35°C (1.5 + 1.5% measure)%);
-an omnidirectional hotwire probe (measuring range: air speed 0.02 ÷ 5 m/s, temperature 0…+80°C, Accuracy: ± (0.05 + 5% measure) m/s).

The measurements were recorded with a 15-minute interval between readings.
The weather data were recorded by a weather station installed at Sesto Fiorentino, provided by the LAMMA Consortium (Laboratory of Environmental Monitoring and Modeling for the Sustainable Development), a public consortium between the Tuscany Region and the National Research Council.
Results discussion
As the thermal indoor comfort data was collected during the winter season the priority was to verify if the PMV and PPD indexes were keeping their values within the range of thermal comfort (-0.5 <PMV <+0.5 and PPD <10%).
As summarized in Figure 12 and Table 4, the results from measurements on indoor thermal comfort report PMV and PPD values within the comfort range. Throughout the monitoring time, thermal comfort analysis reported values outside the comfort range limited to a series of days in which there were outdoor air temperature anomalies lower than the minimum average seasonal value (-1°C).

Table 4.
Results from measurements on indoor thermal comfort
| Hours of discomfort | 28 |
| Total hours monitored | 624 |
| Percentage of hours of discomfort | 4% |
| Average PMV | -0.28 |
| Average PPD | 7% |
Furthermore, the indoor air temperature is variable, ranging from 20°C to 22.5°C, while the relative humidity oscillates between 40% and 60%, avoiding any condensation issues associated with higher relative humidity.
Regarding air quality, most of the time analyzed, the CO2 level in the living room ranges from a minimum of 470 ppm to a maximum of 960 ppm, while in the bedroom, values are more variable ranging from a minimum of 600 ppm during the day to a maximum of 1590 ppm at night. Therefore, the indoor spaces can provide to occupants a healthy environment with CO2 concentrations below 1500 ppm target [20] for good air quality throughout the monitoring period in the living room and over 92% of the period for the bedroom.
Measured data and simulation data comparison
To better predictions regarding energy use and users’ thermal comfort and reduce the gap between measured and simulated building performances, the measured data have been compared with dynamic simulation data. To this scope, some input data of the thermal building model was updated considering the setup used for the monitoring campaign of the indoor comfort. Weather data were used in the simulation instead of the typical climate file for Energy plus. The outdoor air temperature and relative humidity values were taken from in situ measurements. While the nearby weather station of the LAMMA Consortium provided atmospheric pressure, solar radiation, and wind speed data. The temperature setpoint of the heating system was set to 21°C equal to the average value measured during the monitoring period, while the occupants’ activity was set to 1.2 Mets. Furthermore, the setting of occupancy profiles and daily activities have been modified based on the information provided by the inhabitants.

The comparison between measured data and simulated data on indoor air temperature in the kitchen is shown in Figure 14. The temperature profiles are very similar, so the building model allows for an accurate simulation of the real case in this range of measures. Regarding the simulation model, this is due to the accuracy of in situ measurements, the proper characterization of the building envelope and active systems, and occupants’ behavior based on the real habits of users.
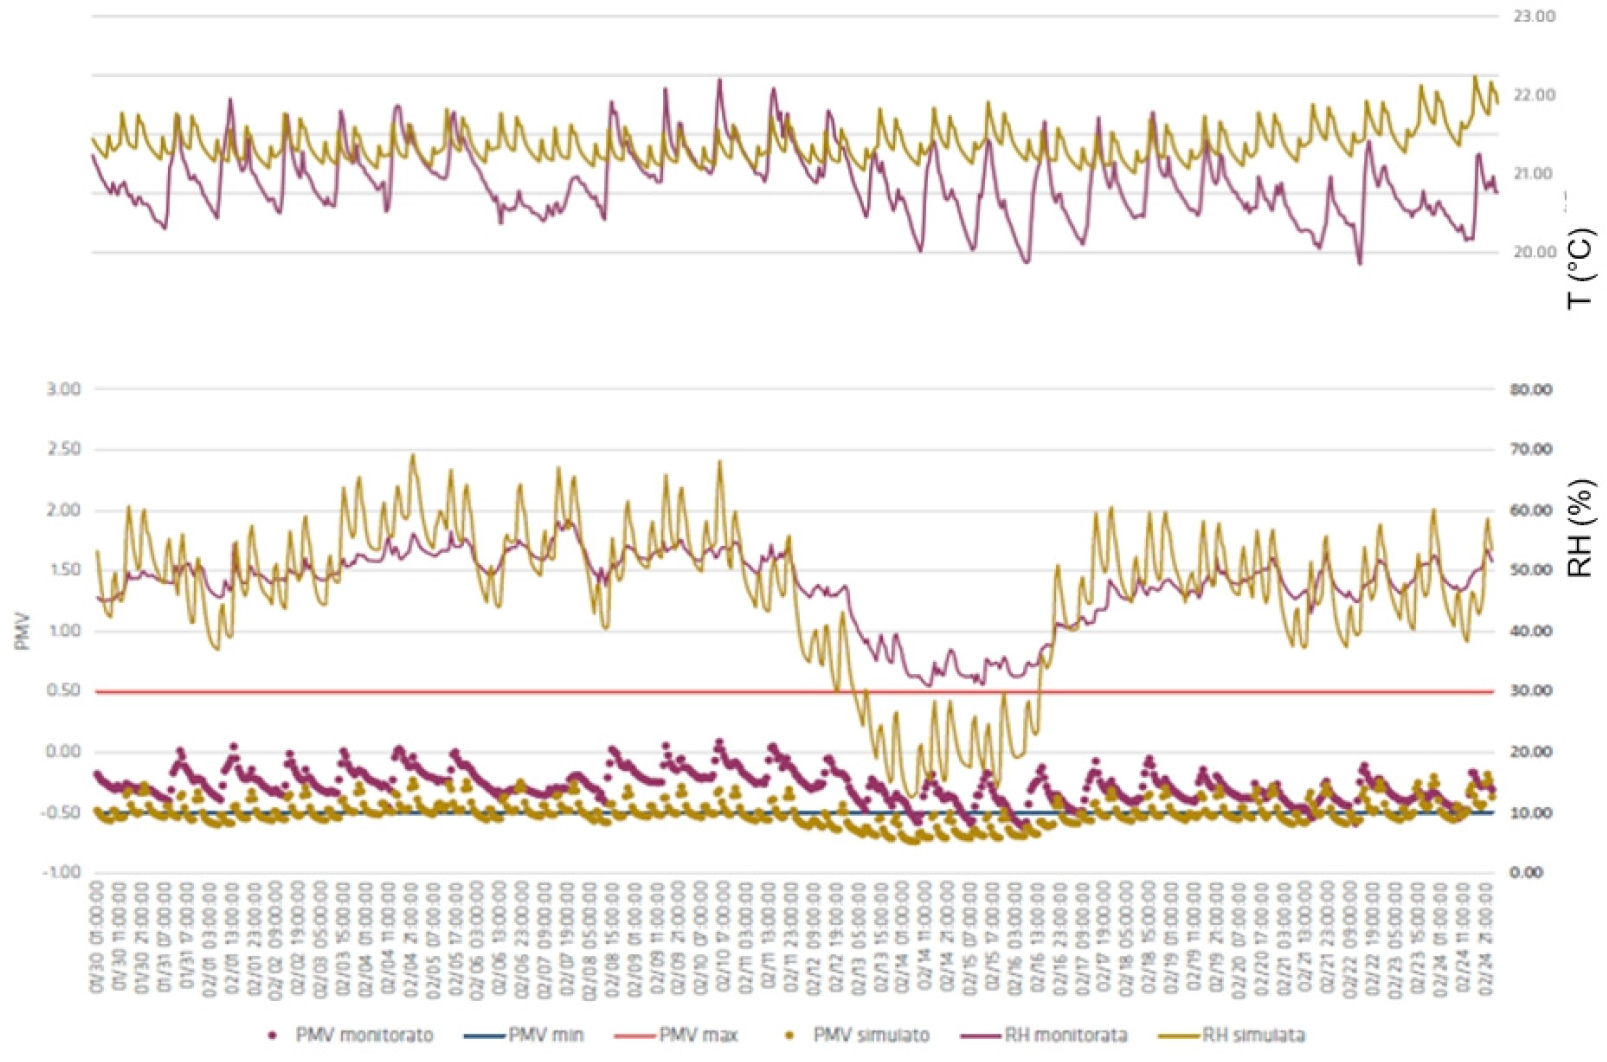
On the other hand, results show a more significant fluctuation of the simulated values when comparing the relative humidity profiles. Also, shallow values from the 12th to 16th of February occurred anomalies concerning the typical seasonal trend for the climate of Florence, with very cold and dry days. The humidity balance may cause this difference by the software derived from input data such as air change rate, ventilation from the HVAC system, and indoor humidity from the occupancy.
As can be seen, the results on indoor comfort show a good level in the winter season: PMV values are between -0.50 and 0.2, and PPD is lower than 14% except for these days of extreme cold, as explained above. Results are summarized in Table 5.
Conclusions
To achieve European long-term targets for energy savings and emission reductions, ambitious levels will be assessed for buildings sector towards nZEB targets. As repoted by BPIE (Buildings Performance Institute Europe), rates of new building construction in Italy are among the lowest in Europe, so efforts to advance NZEBs will remain centered on the challenge of existing buildings refurbishments [2]. Furthermore, in the last few years, the Italian “Superbonus110%” reform was introduced to cover up costs related to structural and energy building renovations, increasing deep renovation rates especially for residential sector.
In this framework, the deep renovation of a historical terraced house in Florence have been described in this paper and results have been discussed with the aim of set up a design process based on a practice method that can be replicated for future restoration and enhancement of other historical residential buildings.
The study focuses on the energy issues to assess the building energy-saving and users’comfort by means of simulation tools and in situ measurements after refurbishment. A predictive analysis of the building energy behavior was performed by means of energy simulation tools, based on the comparison of results between two different thermal models, respectively, before and after renovation. As a result of the deep renovation, the heating demand was reduced by 71%, and cooling demand was reduced by 53%. Also, a dynamic simulation for assessing users’ thermal comfort was carried out using the calculation of PMV and PPD indices according to the Fanger method and ISO 7730. At the same time, post-occupancy measurements were carried out in the winter season to assess IAQ and the thermal comfort of inhabitants in terms of PMV and PPD indices.
Finally, the thermal model of the building after the renovation was updated by coupling simulation data with monitored data provided from in situ measurements and occupancy data derived from inhabitants’ surveys.
The simulation results on indoor air temperature were very similar to those measured, while the relative humidity profile showed more significant fluctuation compared to the measured values. This is attributable to the short monitoring period as a limitation of this work. It must be highlighted that many studies [13] have proven that a long monitoring period could be useful to minimize the assumptions that must be made by modelers and the differences that may exist between the simulation outputs and measured data.
The proposed approach allowed authors to perform a critical evaluation of design solutions concerning the case of study; on the other hand, a methodological workflow for the analysis have been developed that can be useful for designers and facility managers to choose the effective interventions, compatible and consistent with restoration aims and comfort of users for residential buildings. However, in this work, authors focus on energy and environment issues and on technologies, materials, and tools to be applied for the evaluation of retrofit, considering primarily criteria attributable to energy consumption and IAQ parameters. This could be a limitation if we consider that design choices depend also on external factor, firstly the subjective needs/expectations/financial resources of the client/user, which could compromise the final result. Therefore, future developments could extend the analysis to other related criteria, first of all, economic and management and environmental issues, providing a systematic decision support system for professionals to proper selection and prioritize the best design options for existing buildings, also based on LCA (Life Cycle Assessment) and LCC (Life Cycle Cost) evaluation to assess their cost-effectiveness and their ecological footprint.
