

Introduction
Data and Method
Study area and data
Results
Analysis of factors affecting residential satisfaction among public rental housing residents in National Rental Housing and Happy Housing
Analysis of national rental housing residents
Analysis of Happy Housing residents
Discussion and Conclusions
Introduction
Major cities around the world are confronting housing challenges stemming from rapid urbanization and population growth, such as insufficient housing supply, rising housing prices, and polarization in housing markets [1, 2, 3, 4, 5, 6]. These challenges have constrained housing choices for many households [7, 8]. Seoul, South Korea is one of the cities confronting housing supply shortages and rapidly escalating housing prices. These housing issues have entrenched housing vulnerability and made housing stability a growing challenge for diverse urban groups, especially young adults, newlyweds, students, and economically disadvantaged elderly [9, 10, 11].
Public rental housing policy has served for decades as the foundation of Korea’s housing welfare policy, and it contributes to establishing a stable supply base of public rental housing for low-income, non-homeowner households [12, 11]. South Korea has implemented various public rental housing policies since 1989 to ensure housing stability and social equity [13]. These policies began with permanent rental housing for low-income groups and have evolved to provide a stable supply of affordable housing for diverse vulnerable populations over time. However, according to a housing status survey conducted by Korea Land and Housing Corporation (LH) in 2023, satisfaction with the public rental housing system was highest for National Rental Housing at 79.6%, followed by Permanent Rental Housing at 78.1%, and Happy Housing at 76.1% [14].
As housing is one of the fundamental human rights directly connected to quality of life, many cities have implemented diverse policies to provide public rental housing [15, 16, 17, 18]. While many cities have focused on expanding the quantity of public rental housing, recent studies have pointed out that an increase in supply alone cannot guarantee residents’ housing satisfaction [19, 20]. Housing satisfaction is determined by a complex interplay of multidimensional factors, including physical housing characteristics, community environment, social networks, and accessibility to infrastructure [21, 22, 23, 24]. Since the pandemic, new factors like housing environment and social distancing have also been shown to influence housing satisfaction [25, 26]. Still, the degree of residential satisfaction and the variability of its drivers remain strongly linked to spatial context, unit quality, amenities, and local social relations.
Previous public housing research also offers multifaceted insights into the determinants of housing satisfaction. Liu and Ma [8] emphasize in the context of Chinese rental housing, and they highlight that the significant roles were interior quality, facility accessibility, and social capital. Mohit et al. [27] analyze Malaysian public housing, showing how unit layout, physical quality, community relationship, and locational access all affect residential satisfaction. Diaz-Serrano & Stoyanova [28], using European panel data, reveal differences in satisfaction and moving intentions across housing types and countries. Studies of cases in South Korea have also reported differences in housing satisfaction according to internal housing status, economics, social ties, and location.
To improve residents’ satisfaction and quality of life, housing satisfaction is widely recognized as a key factor in residential quality and well-being in previous research and serves as the central dependent variable for analysis [29, 30, 31, 32, 33]. A Recent study shows that housing satisfaction arises from a combination of economic burden, physical quality, external environment, social factors, and demographics. For instance, research in Seoul and other cities demonstrates that satisfaction improves with a lower rent-to-income proportion, better unit size, maintenance, access to transit and amenities, and proximity to parks, schools, and healthcare [34, 35, 36, 37]. Social relationships, including neighbor interaction and sense of community, are also central, sometimes outweighing economic and environmental aspects [38, 39]. Demographic factors such as age, household composition, and tenure further shape satisfaction, with younger or single residents generally expressing lower levels [40]. These analyses collectively confirm that housing satisfaction is multidimensional. It reflects economic, physical, social, environmental, and contextual influences. Research continues to emphasize the need for nuanced analysis, especially in cities like Seoul where spatial disparities and asset concentrations strongly impact residential experience and satisfaction.
However, there is a lack of research examining spatial disparities in the factors determining residents’ satisfaction in public rental housing. Seoul consists of five living zones (Central, Northeast, Northwest, Southeast, Southwest), which exhibit distinct differences in residential environment, population structure, and urban functions [41]. Notably, the Southeast zone (Gangnam, Seocho, Songpa, and Gangdong districts) stands out from other areas in terms of apartment prices, asset level, residential preference, and educational environment. Given the limited systematic comparative analysis of different public rental housing types – particularly, the spatial disparities between Seoul’s living zones (such as Southeast versus others), it is important to investigate how residents’ satisfaction with public rental housing varies across these zones and housing types. Despite recent accumulation of panel data, in- depth investigation into divergent determinants if satisfaction by housing type and region remain scarce.
Therefore, the objective of this study is to utilize Seoul public rental housing panel data collected in 2021 by employing an ordinal logistic regression to compare determinants of housing satisfaction among National Rental Housing and Happy Housing residents, with special attention to variations between the Southeast living zone and other zones in Seoul. Through the comparative analysis of housing satisfaction, this study aims to provide empirical evidence for establishing regionally customized public rental housing policies. By identifying how resident eligibility and regional context interact to shape satisfaction and by empirically characterizing spatial disparities, the study aims to inform place-specific policy design for public rental housing, supply strategy, and improvements to Korea’s housing welfare system especially in Seoul.
Research Questions:
•What are the key determinants of housing satisfaction among public rental housing residents in Seoul?
•How do these determinants differ between National Public Housing and Happy Housing?
•How do these determinants differ between high- asset Southeast and other regions of the city?
•To what extent do spatial disparities shape satisfaction and the overall effectiveness of public rental housing policy?
Prior studies have typically focused on program- level evaluation, aggregate satisfaction, or broad housing outcomes, often overlooking detailed spatial analysis of factors influencing residents’ satisfaction within a single metropolitan area. This study’s novel contribution lies in empirically comparing the determinants of housing satisfaction among public rental housing residents—specifically contrasting the Southeast life zone of Seoul with other regions. By systematically mapping how location-related factors mediate resident experiences, this research highlights the critical role of spatial strategy in urban housing welfare. This study contributes academically by demonstrating the importance of locational context in shaping the effectiveness and outcomes of public housing policies. Furthermore, it provides evidence- based, locality-sensitive guidance for reforms aimed at creating more integrated and inclusive public housing strategies in high-cost cities like Seoul. In sum, by focusing on spatial disparities between the Southeast and other living zones, this research makes a novel empirical and policy contribution—bridging previous gaps and grounding future public housing reforms in the realities of urban distribution, amenities, and resident satisfaction.
Data and Method
Study area and data
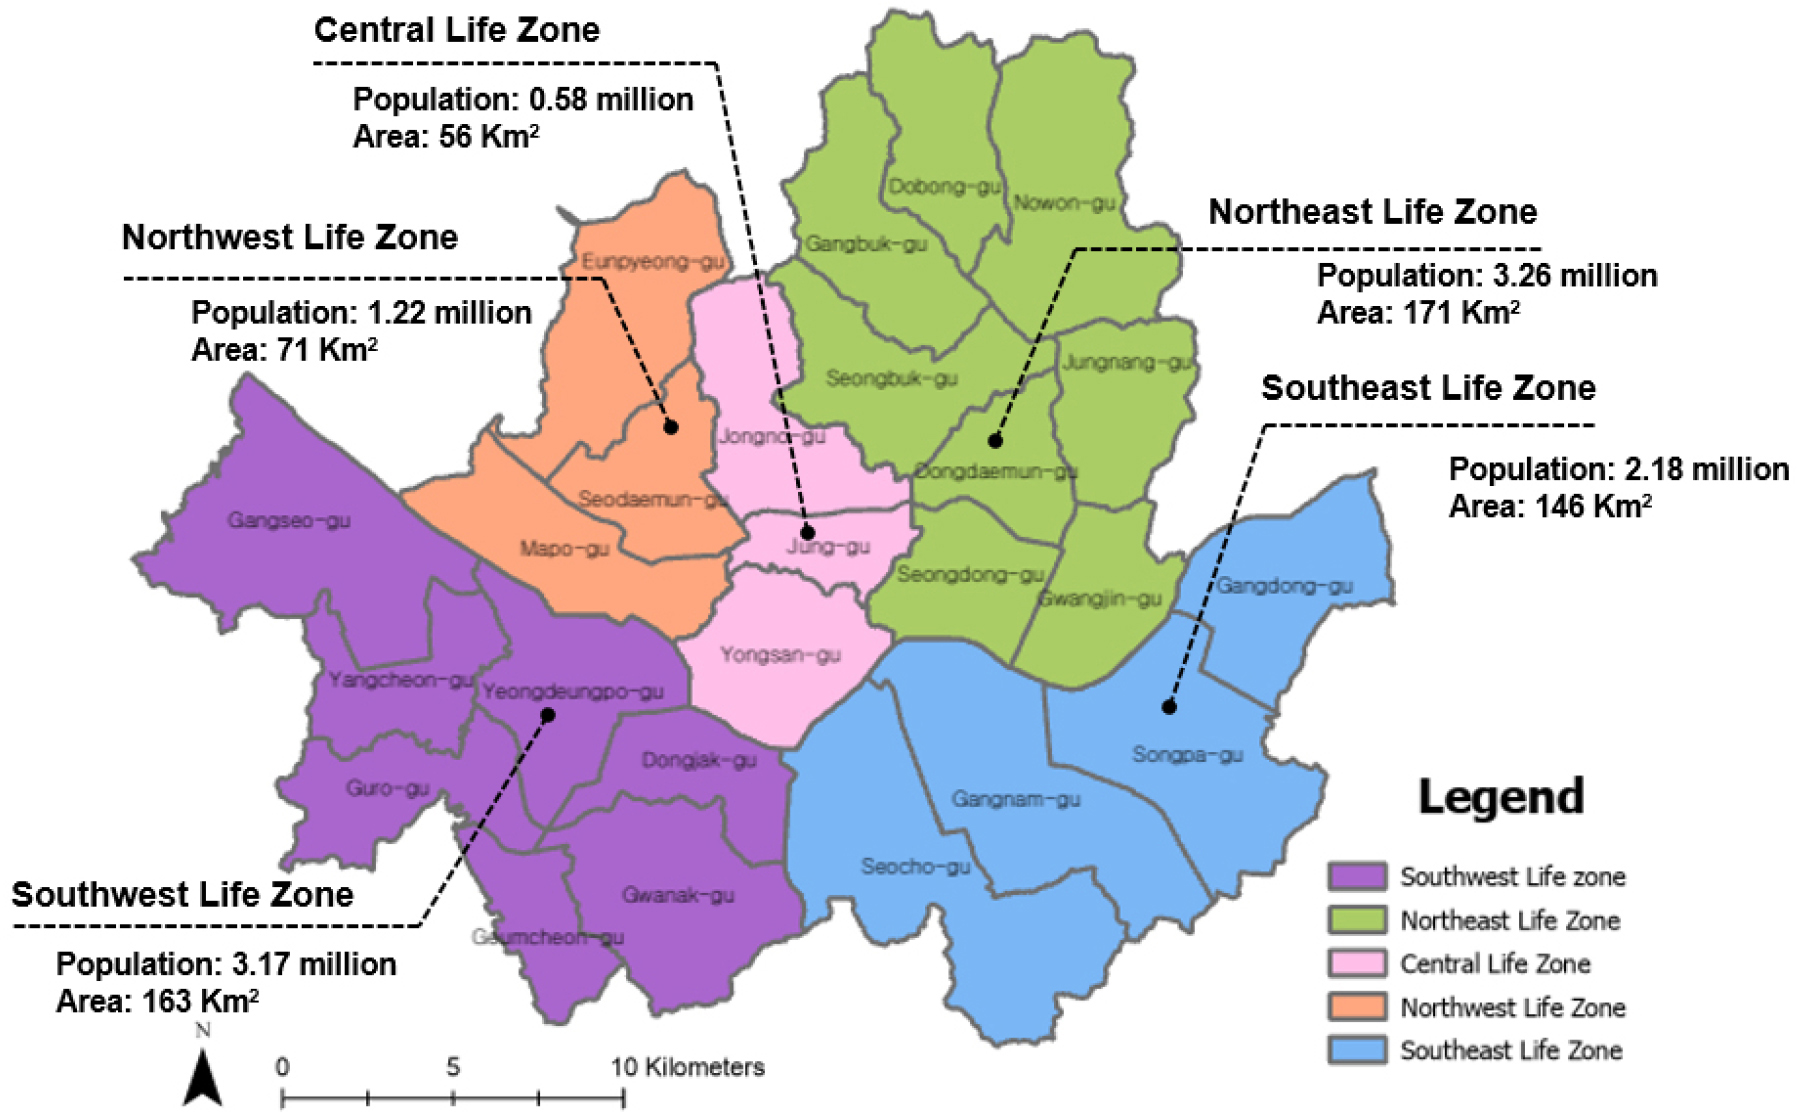
The empirical study of this research is conducted on the public housing satisfaction of Seoul, South Korea. Seoul is the capital city of South Korea, and as of 2024 the total population is 9,605,419. It represents about 20% out of total population of South Korea. Moreover, as of 2024, there are about 50.7% of South Korea’s total population residing in Seoul and the greater metropolitan area. It means that over half of all residents in the country live in Seoul and the surrounding metropolitan region, reflecting an ongoing trend of population concentration in these areas. Seoul has 25-boroughs (“gu” in local term) and the ‘Regional Living zones’ in the city are divided into five (Central, Northeast, Northwest, Southeast, Southwest) by comprehensively considering factors such as natural and physical environments (rivers, roads, terrain), urban growth processes, administrative boundaries, education districts, and residential population characteristics. Figure 1 illustrates the five living zone classifications and its brief characteristics [42].
In this study, the public rental housing types analyzed are limited to National Rental Housing and Happy Housing. This focus was adopted because these two types share similar characteristics — such as identical exclusive floor area and rental conditions — and both are accessible to newlywed households. Consequently, comparison of variation in determinants across types was confined to these comparable forms of public rental housing, allowing for a more systematic analysis of the differences in influencing factors. The stock of public rental housing by regional life zone in Seoul as of the end of 2019 shows that the Northeast zone accounted for 102,280 units, or 33.3% of the city’s total rental housing stock of 307,606 units — the highest share. The Southwest zone followed with 97,108 units (31.6%), then Southeast with 57,675 units (18.7%), Northwest with 40,091 units (13.0%), and Central Zone with 10,452 units (3.4%). By housing type, Happy Housing totaled 11,986 units citywide, with Southeast and Southwest each having the most units (3,797 and 3,794 respectively), followed by Northwest (2,366), Northeast (1,780), and Central life zone (249 units). For National Rental Housing, 12,140 units were concentrated in the Southeast — the largest share — followed by Southwest (8,060), Northwest (3,228), Northeast (1,876), and none in the Central zone.
This study was conducted using data from the fourth year of the "Seoul Public Rental Housing Tenant Panel Survey" conducted in 2021. This panel survey is significant as it is the first in Korea to establish a panel system for public rental housing resident information, and it surveys not only household characteristics and housing but also welfare, economic, and health aspects. This resident panel survey is representative, as it includes tenant households in the Seoul area managed by organizations such as the Korea Land and Housing Corporation, the Korea Housing Management Corporation, and the SH Seoul Housing & Communities Corporation in its population, aiming to understand the overall housing conditions of public rental housing residents living in Seoul. The panel survey included questionnaires administered to tenants, consisting of household-level and household member-level surveys. In the fourth wave of panel surveys conducted in 2021, 2,320 households were successfully surveyed out of the original 2,890 baseline households, achieving an original sample retention rate of 80.3%. Additionally, 401 households residing in Happy Housing were newly surveyed for the fourth year of the panel survey [43]. For analysis, 366 households out of the sampled 401 households that responded to all key variables—independent, control, and dependent variables—were selected for this study, excluding 35 households with incomplete responses. Among National Rental Housing households, 325 out of the sampled 407 baseline households participated in the survey, resulting in a completion rate of 79.9%. Furthermore, of the responding National Rental Housing households, 35 that did not answer one or more independent, control, or dependent variables set for this study were excluded, leaving 290 households out of 325 as the final analytic sample.
Among the survey items, independent variables, control variables, and dependent variables were selected, focusing on variables frequently used in prior studies related to public rental housing residential satisfaction. Among the public rental housing units surveyed in the fourth year, this study analyzed the factors influencing residential satisfaction for residents of two public housing types: National Rental Housing and Happy Housing. The dependent variable in this study is residential satisfaction which was measured by a Likert-Scale consisting of “very dissatisfied,” “dissatisfied,” “satisfied,” and “very satisfied.” The independent variables consist of housing interior condition, housing exterior condition, residential environment, economic characteristics, neighborhood relations, and family and social relations. The control variables are gender, age, education level, number of household members, length of residence, number of rooms, and exclusive floor area. The composition of variables in this study is shown in Table 1, and the descriptive statistics of the variables are presented in Table 2. The sub variables of each independent variable were examined for one-to-one (pairwise) correlations through factor analysis. Groups of sub variables with the highest correlations were identified and aggregated as a single independent variable, which was then applied in the ordinal logistic regression analysis.
Table 1.
Variable description
Table 2.
Descriptive Statistics of variables
Empirical method
This study analyzes which factors affect residential satisfaction among residents of National Rental Housing and Happy Housing, and whether these factors have a positive (+) or negative (−) influence on resident’s satisfaction. Furthermore, it examines whether the determinants of residential satisfaction differ between residents of National Rental Housing and Happy Housing, as well as whether these determinants vary by region.
For this research, an ordinal logistic regression model is used to analyze the determinants of residential satisfaction in the following steps: First, factors influencing the residential satisfaction of all public rental housing – National Rental Housing and Happy Housing – residents are identified. Second, differences in determinants affecting residential satisfaction between National Rental Housing and Happy Housing residents are examined. Third, the study investigates whether the determinants of residential satisfaction for both types vary by the living zones in Seoul. In the regional analysis, households in the five Seoul living zones (Southeast, Northeast, Southwest, Northwest, Central living zones) were considered, except for the Central life zone due to lack of survey responses, so the analysis focuses on two regions: Southeast (Gangnam, Seocho, Songpa, Gangdong) and non-Southeast. The Southeast zone is classified as the center for international business and exchange, a hub for mobility and infrastructure development, and an area where planned redevelopment projects such as reconstruction are needed (Seoul Metropolitan Government, 2023). Additionally, the Southeast zone is regarded as a region with favorable residential environments, including accessibility to public transportation, convenience, public and cultural facilities, medical services, and quality educational resources.
Results
Analysis of factors affecting residential satisfaction among public rental housing residents in National Rental Housing and Happy Housing
This study analyzed whether factors affecting the residential satisfaction of National Rental Housing and Happy Housing residents differ by region. Regions were divided into two areas: the Southeast Region (Gangnam-gu, Seocho-gu, Songpa-gu, Gangdong-gu) and regions outside the Southeast Region. This division excluded the Central District, one of Seoul’s five major living zones (Central, Northeast, Northwest, Southeast, Southwest), as it had no responding households. The Southeast Zone is classified as an area requiring the establishment and expansion of international business and exchange hubs, mobility hubs and related infrastructure, and the planned implementation of redevelopment projects such as reconstruction initiatives (Seoul Metropolitan Government, 2023). Furthermore, the Southeast Zone can be considered an area with a favorable residential environment, offering public transportation convenience, accessibility to daily convenience facilities, public facilities, cultural facilities, medical facilities, and educational environments.
Of the total 656 responding households, the Southeast Region had the highest number at 278 households (42.4%), followed by the Southwest Region with 177 households (27.0%), the Northwest Region with 101 households (15.4%), and the Northeast Region with 100 households (15.2%). Within the Southeast Region, had 134 households (46.2%) in National Rental Housing and 144 households (39.3%) in Happy Housing, while regions outside the Southeast had 156 households (53.8%) in National Rental Housing and 222 households (60.7%) in Happy Housing. These overall statistics are described in Table 3.
Table 3.
Status of national rental housing and happy housing respondent households by living zones
In the analysis of factors influencing residential satisfaction among all public rental housing residents in this study, the term ‘all public rental housing’ is limited to two types: National Rental Housing and Happy Housing. To examine the determinants of residential satisfaction for all public rental housing residents, an ordinal logistic regression model was applied to the independent and control variables. The results of this analysis are presented in Table 4.
Table 4.
Analysis of factors influencing residential satisfaction among public rental housing residents
Among the independent variables, residential environment and economic characteristics were found to have a statistically significant effect on residential satisfaction at a level of p < 0.001. In contrast, housing interior condition, housing exterior condition, neighborhood relations, and family and social relationships did not exert a statistically significant effect on residential satisfaction. Specifically, a one-point increase in satisfaction with the residential environment increases the odds of public rental housing residential satisfaction by 2.581 times, indicating that satisfaction with the residential environment has a positive effect on overall residential satisfaction. On the other hand, when the level of economic burden — such as deposit or monthly rent—increases by one, the odds of residential satisfaction decrease by 40.4%, demonstrating that economic characteristics have a negative effect on residential satisfaction. Among the control variables, household size, length of residence, number of rooms, exclusive area, and living in the Southeast zone (Southeast = 1) were shown to have statistically significant effects on residential satisfaction. In contrast, gender, age, educational attainment, and Happy Housing status were found not to have significant effects. More specifically, exclusive areas and living in the Southeast zone have a positive effect on residential satisfaction, while household size, length of residence, and number of rooms have negative effects. More specifically, exclusive floor area and residence in the Southeast zone positively influence residential satisfaction, whereas household size, length of residence, and number of rooms have negative effects. The negative impact of household size likely reflects increased spatial pressure and overcrowding, reducing comfort and privacy. Similarly, the negative association between the number of rooms suggests a mismatch between housing design and functional space use, as increasing room counts within limited floor areas may result in smaller spaces. These findings highlight the importance of both spatial capacity and layout efficiency in shaping residential satisfaction.
Analysis of national rental housing residents
Analysis of factors affecting residential satisfaction among National Rental Housing residents in the Southeast living zone
To analyze the factors influencing residential satisfaction among National Rental Housing residents by region, an ordinal logistic regression model was applied to National Rental Housing units in the Southeast region. The results of the ordinal logistic regression analysis applied to public rental housing in the Southeast Region are shown in Table 5.
Table 5.
Analysis of factors influencing residential satisfaction among National Rental Housing residents in Southeast living zone
Among the independent variables, only economic characteristics (p<0.05) were found to have a statistically significant effect on residential satisfaction. Specifically, it was analyzed that for every 1-unit increase in the economic characteristics of rental deposit or monthly rent burden, the odds of residential satisfaction in public rental housing decreased by 44.4. That is, economic characteristics were found to have a negative impact on residential satisfaction. Conversely, the internal condition of the dwelling, the external condition of the dwelling, the residential environment, neighbor relations, and family and social relations did not have a statistically significant effect on residential satisfaction.
Among the control variables, the number of rooms and exclusive floor area were confirmed to have a statistically significant effect on residential satisfaction. Specifically, an increase of one room decreased the odds of residential satisfaction in National Rental Housing by 69.6%, while an increase of one unit in exclusive floor area increased the odds of residential satisfaction by 4.043 times. That is, the number of rooms was found to have a negative impact on residential satisfaction, while the size of the exclusive area was found to have a positive impact. On the other hand, gender, age, education level, number of household members, and length of residence were found to have no statistically significant effect on residential satisfaction.
Analysis of factors affecting residential satisfaction among National Rental Housing residents in non- Southeast living zone
To identify factors influencing residential satisfaction among National Rental Housing residents outside the Southeast Region, an ordinal logistic regression model was applied. The analysis results are presented in Table 6.
Table 6.
Analysis of factors influencing residential satisfaction among National Rental Housing residents in non-Southeast living zone
Among the independent variables, residential environment (p<0.05), economic characteristics (p<0.05), and neighbor relations (p<0.01) were confirmed to have a statistically significant impact on residential satisfaction. Conversely, the internal condition of the dwelling, the external condition of the dwelling, and family and social relations were found to have no statistically significant effect on residential satisfaction. Specifically, an increase of 1 in satisfaction with the residential environment was analyzed to increase the odds of satisfaction with public rental housing by 2.846 times. That is, satisfaction with the residential environment was found to have a positive (+) effect on overall residential satisfaction. When the perceived level of neighbor relations increases by 1, the odds of residential satisfaction in public rental housing increase by 7.721 times. This indicates neighbor relations have a positive (+) effect on residential satisfaction. When the burden of economic characteristics such as the lease deposit or monthly rent increases by 1, the odds of residential satisfaction in national rental housing decrease by 38.6%. This indicates that economic characteristics have a negative impact on residential satisfaction. All control variables—gender, age, education level, number of household members, length of residence, number of rooms, and exclusive floor area—were found to have no statistically significant effect on residential satisfaction.
Analysis of Happy Housing residents
Analysis of factors affecting residential satisfaction among Happy Housing residents in Southeast living zone
To identify factors influencing residential satisfaction among residents of Happy Housing in the Southeast Region, an ordinal logistic regression model was utilized for analysis. The results are presented in Table 7. Among the independent variables, only the residential environment (p<0.01) was found to have a statistically significant effect on residential satisfaction. Conversely, the internal housing conditions, external housing conditions, economic characteristics, neighborly relations, and family and social relations did not have a statistically significant effect on residential satisfaction.
Table 7.
Analysis of factors influencing residential satisfaction among Happy Housing residents in Southeast living zone
Specifically, the analysis showed that a 1-point increase in satisfaction with the residential environment resulted in a 3.228-fold increase in the odds of satisfaction with Happy Housing. Thus, satisfaction with the residential environment was found to have a positive (+) effect on overall residential satisfaction. Among the control variables, only the number of rooms was found to have a statistically significant effect on residential satisfaction. Specifically, an increase of 1 in the number of rooms was analyzed to decrease the odds of satisfaction with Happy Housing by 60.5%, indicating that the number of rooms has a negative effect on residential satisfaction. Conversely, gender, age, education level, number of household members, length of residence, and exclusive floor area were found to have no statistically significant effect on residential satisfaction.
Analysis of factors affecting residential satisfaction among Happy Housing residents in non-Southeast living zone
To identify factors influencing residential satisfaction among Happy Housing residents outside the Southeast Region, an ordinal logistic regression model was applied. The results are presented in Table 8.
Table 8.
Analysis of factors influencing residential satisfaction among Happy Housing residents in non-Southeast living zone
Among the independent variables, residential environment (p<0.05) and economic characteristics (p<0.01) were found to have a statistically significant effect on residential satisfaction. Conversely, the internal condition of the dwelling, the external condition of the dwelling, neighbor relations, and family and social relations were not found to have a statistically significant effect on residential satisfaction. Specifically, an increase of 1 in satisfaction with the residential environment was analyzed to increase the odds of satisfaction with Happy Housing by 2.067 times. That is, satisfaction with the residential environment was found to have a positive (+) effect on residential satisfaction. Economic characteristics, such as the burden of the deposit or monthly rent, or monthly rent burden, the odds of satisfaction with Happy Housing decreased by 56.7% . In other words, economic characteristics were found to have a negative impact on residential satisfaction.
Among the control variables, household size and exclusive floor area were confirmed to have a statistically significant effect on residential satisfaction. Specifically, an increase of 1 in household size was analyzed to decrease the odds of satisfaction with Happy Housing by 57.5%. Conversely, an increase of 1 in the size of the exclusive area was analyzed to increase the odds of satisfaction with Happy Housing by 1.605 times. That is, household size was found to have a negative impact on residential satisfaction, while exclusive floor area was found to have a positive impact. Conversely, gender, age, education level, length of residence, and number of rooms were not found to have a statistically significant effect on residential satisfaction. Overall results of determinants of residential satisfaction depending on public housing program types and spatial zone are systematically recapitulated in Table 9.
Table 9.
Results of determinants of residential satisfaction
Discussion and Conclusions
This study empirically examined whether the factors influencing residential satisfaction among Seoul’s public rental housing residents differ across regions and housing types —specifically National Rental Housing and Happy Housing, which share identical floor area and lease conditions for newlywed and young adult households. The ordinal logistic regression and subgroup analysis provide several novel insights that directly address our research questions.
First, the determinants of residential satisfaction substantially vary by region and housing type. In the Southeast region, National Rental Housing residents’ satisfaction is largely constrained by negative economic characteristics (OR=0.556), while differences in floor area (positive) and the number of rooms (negative) also play significant roles. Outside the Southeast, satisfaction benefits primarily from a supportive residential environment (OR=2.846) and stronger neighbor relations (OR=7.721), while higher economic strain remains a consistent detractor. For Happy Housing, both inside and outside the Southeast, the residential environment is the main positive driver; however, economic strain is a marked negative factor outside the Southeast. Notably, control variables such as exclusive floor area and household composition affect satisfaction in different directions according to locale—a nuanced pattern seldom highlighted in previous studies.
Second, there are clear differences in satisfaction determinants between National Rental and Happy Housing residents within the same region. Neighbor relations—a strong predictor of satisfaction for National Rental Housing, especially outside the Southeast—appear insignificant for Happy Housing, reflecting different demographic compositions and social dynamics within these communities. Older populations in National Rental Housing engage more actively in community programs and derive greater satisfaction from these ties. Conversely, young and newlywed households in Happy Housing, most of whom reside in studio and one-bedroom units, have fewer opportunities and less interest in neighborly relations or communal spaces, leading to higher turnover intentions.
Third, both regional and typological factors intersect with demographic and spatial variables to affect satisfaction. The Southeast region is home to more households with higher educational attainment, and its units typically offer larger floor areas — a key factor associated with greater satisfaction. Nevertheless, more rooms are linked to lower satisfaction, suggesting supply planning has focused on quantity of spaces rather than appropriate spatial utility for household needs. This supports policy recommendations for customized floor plans matching resident demands. Finally, housing performance and facility aging differ sharply across types: National Rental Housing, with longer-tenure residents, shows lower ratings for barrier-free design and external amenities, reinforcing the need for ongoing inspection, maintenance, and targeted upgrades.
The findings of this study provide several important implications for the design and implementation of public rental housing policy, particularly from a spatial and program-specific perspective. First, the government’s public rental housing policy has historically determined annual supply volumes and total construction volumes for the duration of administration without sufficiently reviewing regional conditions. Current public rental housing policies often rely on uniform allocation and supply strategies, which may not adequately reflect localized needs. Instead, a place-based approach should be adopted, in which housing supply, site selection, and program design are aligned with regional characteristics such as infrastructure provision, accessibility, and demographic composition. This implies that public rental housing policy should be more closely coordinated with comprehensive urban planning and housing plans to ensure balanced and equitable development. Among Seoul’s four major living zones (Northeast, Southeast, Northwest, Southwest), factors affecting the residential satisfaction of National Rental Housing and Happy Housing residents differ between the Southeast zone and other zones. Considering these points, it is necessary to establish project plans that consider the sociodemographic characteristics, public transportation conditions, accessibility to daily convenience facilities, and educational environments of each project area nationwide. In other words, it is essential to enhance the satisfaction of residents living in public rental housing by considering regional characteristics.
For example, the findings indicate that residential environmental factors are strongly associated with housing satisfaction, but their effects vary across spatial contexts. In the Southeast zone, where infrastructure and amenities are already well-developed, these factors exhibit relatively limited marginal effects, while economic burden and unit characteristics play a more decisive role in shaping residential satisfaction. Accordingly, more spatially explicit and differentiated policy approaches are required. In the Southeast zone, policy efforts should focus on reducing financial burdens—such as rent and deposit costs—and improving the functional efficiency of housing units through better spatial design. In non- Southeast regions, priority should be given to enhancing the residential environment by expanding public transportation networks, improving accessibility to daily convenience facilities, and strengthening educational and community infrastructure. These results suggest that uniform housing policies are insufficient and highlight the need for regionally tailored strategies that reflect local conditions and spatial disparities.
Second, residents of National Rental Housing showed higher residential satisfaction when neighborly relations were better, and this factor was analyzed to have a relatively greater impact on residential satisfaction than factors like the residential environment or economic characteristics. National rental housing primarily accommodates residents such as those aged 65 and over, evictees from permanent rental housing, North Korean defectors, non-regular workers, single-parent families, and child heads of households. Most residents are elderly or basic livelihood security recipients. National rental housing residents tend to have high levels of trust with neighbors and engage in active community interaction. To foster community engagement among residents, it is necessary to develop and operate diverse programs that appeal to residents, such as joint vegetable garden cultivation, resident cafes, small libraries, origami clubs, story book and picture book reading sessions, and health lectures.
For Happy Housing, neighborly relationships were found to have no significant impact on residential satisfaction. This analysis result is thought to stem from the fact that Happy Housing residents are mostly young people such as university students, young adults, and newlyweds, and there are no or insufficient community facilities that would be helpful or of interest to them. Analysis of demographic characteristics using chi-square analysis of demographic characteristics revealed that residents aged 20-39 constitute the largest group at 77.9%, with those in their 40s accounting for 12%, meaning 89.9% are under 40. This is likely because over 80% of Happy Housing units are allocated to young demographics like university students, young adults, and newlyweds. Therefore, it is necessary to install community facilities preferred by the younger generation and develop and operate programs to activate them. Furthermore, since many young households have dual-income parents, providing practical help to residents, such as ‘full-day childcare centers,’ and budgetary support for these from the government or local authorities is also needed.
Third, factors affecting the residential satisfaction of National Rental Housing and Happy Housing residents were found to differ somewhat. Analysis of demographic characteristics using the chi-square test revealed that National Rental Housing is predominantly occupied by relatively older residents with lower educational attainment, while Happy Housing is primarily inhabited by younger residents with higher educational attainment. Particularly, since Happy Housing residents often live in cramped studio or one-bedroom units, leading to high relocation plans, designs considering floor plans and room counts tailored to the needs of each resident group are necessary to enable long-term residency and ensure housing stability. Furthermore, planning policies should also reflect differences in housing types. For National Rental Housing, community-building programs and social infrastructure should be strengthened to support stable long-term residency. For Happy Housing, policies should focus on providing flexible housing designs and lifestyle-oriented amenities that meet the needs of younger households. By integrating both spatial and typological considerations, public rental housing policies can become more targeted, effective, and responsive to diverse urban conditions.
Furthermore, while larger exclusive floor areas are positively associated with residential satisfaction, a seemingly contradictory finding emerges regarding the number of rooms. This relationship can be interpreted as a trade-off between the number of rooms and individual room size. Given a limited floor area, an increase in the number of rooms may lead to smaller and less functional spaces, thereby reducing overall residential satisfaction. This could stem from public housing supply plans focused on quantity rather than adequately considering household size and spatial utility. Specifically, it is interpreted as a problem with floor plan designs that increase the number of rooms without considering room sizes relative to household size. Therefore, floor plan designs that comprehensively consider spatial utility and household size are required.
This research’s creative contribution lies in its spatially explicit comparative approach, disentangling how location, demographics, economic dynamics, facility design, and social programs interact to generate differentiated satisfaction outcomes within seemingly uniform public rental housing programs. By systematically comparing regions and housing types, it offers actionable evidence for a shift toward highly differentiated, context-attuned, and resident-centered public housing policy—marking a valuable advance for both academic understanding and practical governance in urban rental housing. Despite these contributions, several limitations must be noted. The study is based on cross-sectional panel data for Seoul in 2021 and only includes National Rental Housing and Happy Housing. Future research should use longitudinal nationwide data, incorporate more diverse housing types and regions, and expand the scope of independent variables to include subjective well-being, utility costs, lifestyle, mental health, discrimination experiences, and mobility. In addition, this study does not explicitly account for potential spatial dependence or spatial autocorrelation among observations. Given that housing satisfaction may be influenced by spatially clustered factors such as neighborhood characteristics and regional amenities, future research could benefit from employing spatial regression models to more rigorously capture spatial effects and improve model robustness. In-depth qualitative studies, including interviews and ethnographic analyses, would reveal more about residents lived experiences and how policies and infrastructure changes impact satisfaction over time. Comparative studies that examine similar programs in other cities, or nationally across Korea, can help generalize these findings and inform evidence-based interventions with wider applicability.
