

Introduction
Review of section properties in composite beams
Basic design assumptions and material strength
Calculation of neutral axis of composite section and moment of inertia
Calculation of yield moment
Calculation of horizontal shear force
Calculation of the number and spacing of joint screws
Calculation of adhesive strength of the adhesive for steel and wood
Flexural performance evaluation experiment
Design and fabrication of specimens
Loading and measuring methods
Experimental results and analysis
Conclusions
Introduction
Wood is a representative ecological building material that returns to an ecosystem when discarded, and it is a sustainable resource that stores carbon dioxide, a greenhouse gas. The utilization of engineered wood, such as a glued laminated timber (GLT), is more efficient for structural purposes [1].
Modern wooden architecture uses engineered wood, such as GLT, cross-laminated timber, and laminated veneer lumber, to construct large, medium, and high-rise buildings. In particular, countries with advanced wooden architecture in Europe, North America, and Oceania are attempting to replace reinforced concrete and reduce greenhouse gases by constructing wooden structures with more than 10 stories in major cities [2]. Using hybrid wood materials, an 18-story wooden building was built in Vancouver, Canada, in 2015, and a 24-story wooden building was built in Vienna, Austria, in 2019. The University of Cambridge in England is actively conducting research to construct an 80-story wooden building in London. Japan has established a plan to construct the tallest wooden building (350 m) in Tokyo, and related research and development are under way [3].
Structural GLT is an eco-friendly structural material with an excellent strength-to-weight ratio and a strength 1.5 times or more of that of general wood maintained by eliminating natural defects and strictly controlling the moisture content. It demonstrates a higher dimensional accuracy, and there are almost no defects, such as cracking, twisting, and deformation, over long periods of use, even in harsh environments. In addition, it requires no separate interior work and has excellent functionality as an external material while showcasing the beauty of the exposed structural material.
Because it exhibits lower strength and a more brittle fracture behavior than typical building materials, such as reinforced concrete and steel, use of wood as a structural material for buildings requires the improvement of such brittle fracture behavior and strength.
In a conventional composite member, the main member receiving the load is composed of a steel cross section, and the wood is simply given the function of covering the steel in the exposed form to meet the design concept. Because it is difficult to implement a composite of steel and wood, not only are excessive construction costs incurred, but also there is a limit to shortening the construction period because the construction of wood requires a separate process on site. For building a high-rise or long-span structure, separate joints, as well as many stiffeners, are required [4].
Therefore, in this study, the cross section of GLT was improved by embedding a steel material with excellent tensile force and deformation capacity that can improve the strength of the GLT with maximized flexural performance, and the structural safety was carefully examined by testing the flexural performance of the composite beams.
Review of section properties in composite beams
Basic design assumptions and material strength
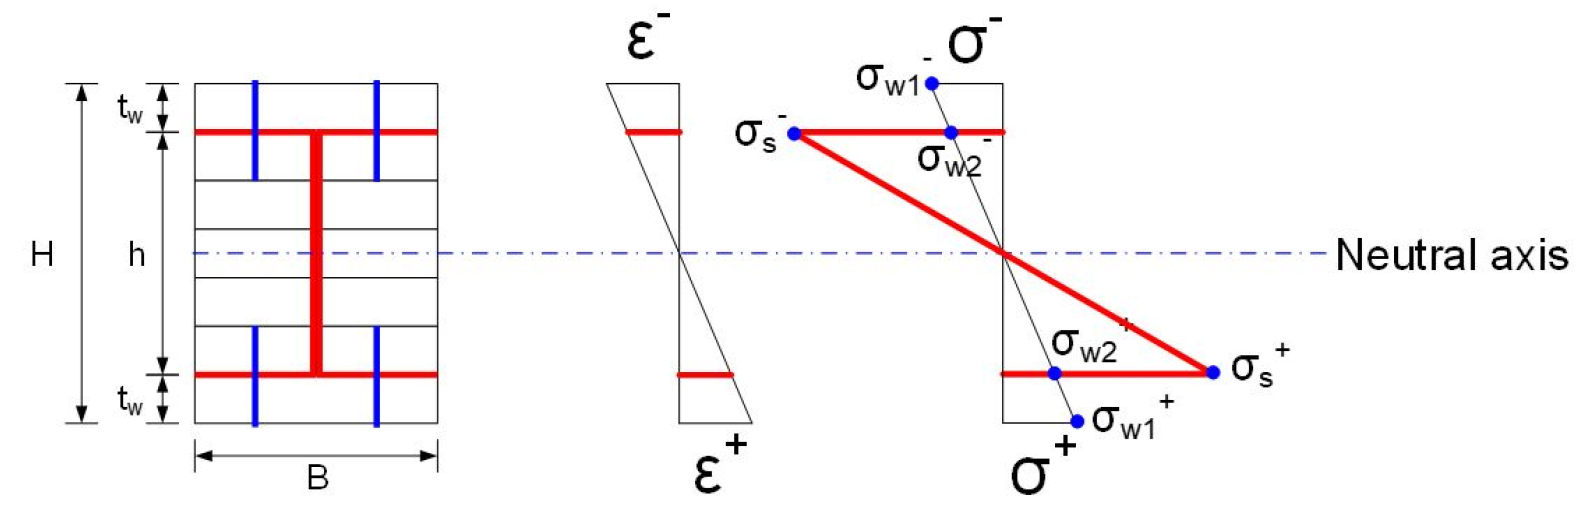
The cross-sectional performance of composite beams was reviewed in accordance with the wood structure design standards of KS F 3021 [5] and KDS 41 33 [6], and the allowable stress design assuming linear elastic analysis was applied [7]. For the calculation of the stress and strain acting on the cross section of the steel-wood composite beam, a full composite of the steel and wood was used until the outermost end of the composite cross section reached the yield stress, as shown in Figure 1. It was assumed that there was no stress loss in the cross section of the GLT due to the finger joint.
A shear connector for fully composite steel and wood was designed based on the horizontal shear force calculated using the shear flow acting between the steel and wood. Structural GLT with a strength grade of 10S-30B was selected for the cross-sectional design among symmetrical mixed grade lay-ups defined in KS F 3021 [5] and KDS 41 33 02 [8]. The material strength of the self-drilling screw for joining the GLT to the steel material was calculated based on the property values provided by the manufacturer. Table 1 shows the material strength for calculating the strength of the composite beams.
Table 1.
Material properties of composite beams
Calculation of neutral axis of composite section and moment of inertia
1) Neutral axis of composite beams
Because the cross section of the beam is symmetrical, the neutral axis of the composite section can be calculated as one half of the height of the GLT, as shown in Equation (1).
where H denotes the height of the GLT, and yc denotes the neutral axis position of composite beams.
2) Moment of inertia of GLT
The moment of inertia of GLT can be calculated as shown in Equation (2).
where B denotes the width of the GLT, and H denotes the height of the GLT.
3) Moment of inertia of composite beams
The moment of inertia of the composite beams can be calculated as shown in Equation (3).
where h denotes the height of the steel, and ts denotes its thickness.
Calculation of yield moment
Because the composite section composed of steel-wood was based on a fully composite behavior, the steel strain was the same as the wood strain at the location where steel was inserted (). At this time, the state of stress acting at the same location was different owing to the difference in elastic modulus between the materials, and the stress acting on steel was as in Equation (4).
Here, denotes the stress on steel, denotes the stress on wood, denotes the strain on steel, and denotes the strain on wood
Because linear elasticity theory was applied as a basis, the stress acting on the composite section could not exceed the yield stress. Therefore, the yield moment of a steel-wood composite beam was calculated based on two stress distributions: 1) the compressive or tensile yield of wood and 2) the compressive or tensile yield of steel.
1) For compressive or tensile yield of wood
When the stress on the outermost GLT reached the flexural strength of the material, the yield moment of the composite section was as shown in Equation (5).
where denotes the flexural strength of GLT.
Such a case violates the elastic theory because the tensile stress of the outermost steel exceeds the yield strength of the material.
2) For compressive or tensile yield of steel
When the stress on the outermost GLT reached the yield strength of the material, the yield moment of the composite section was as shown in Equation (7).
Because the stress on the outermost steel of the composite section reached the yield stress and the GLT exhibited an elastic stress distribution, the yield moment of GLT was expressed when the steel yielded.
3) Yield moment of GLT
The yield moment of only GLT was exerted when the stress on the outermost end of the GLT reached the flexural strength of GLT, which was as shown in Equation (9).
Calculation of horizontal shear force
The shear flow between the steel and wood can be calculated as shown in Equation (10).
when denotes the yield load.
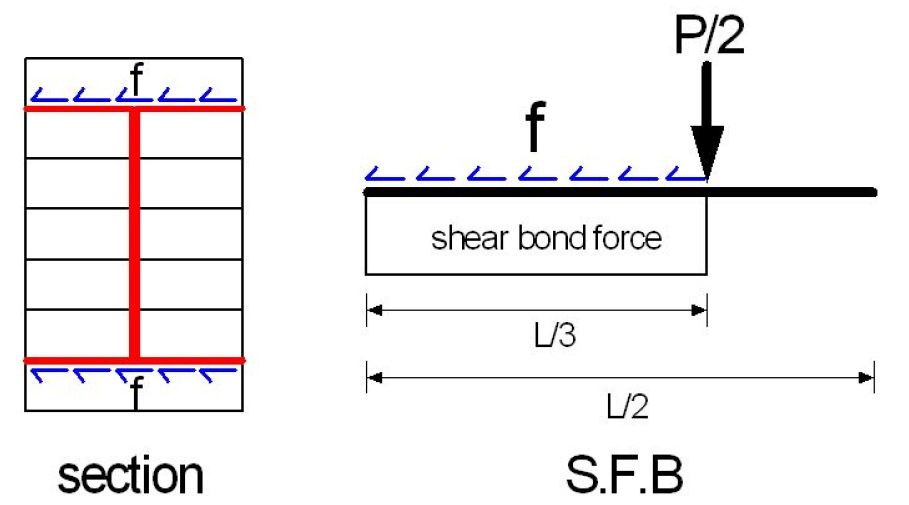
The horizontal shear force generated between the steel and wood can be calculated by multiplying the shear flow acting on the interface by the length of the shear force acting as shown in Figure 2.
Calculation of the number and spacing of joint screws
The number of screws connecting wood and steel was calculated by dividing the horizontal shear force by the shear strength of one joint screw. The spacing was calculated by dividing the section where shear force was applied (L/3) by the required number of screws. As a result of the calculation, a total of 22 screws and a spacing of 115 mm were required when arranging two rows. For safe design, the screws were placed at 100 mm intervals over the entire length of the specimen.
Calculation of adhesive strength of the adhesive for steel and wood
The adhesive strength of the adhesive is calculated by multiplying the adhesive strength per unit area by the area for adhesion. The adhesive strength per unit area of the polyurethane adhesive used in this experiment was 2.2 MPa, which was the value of the adhesive strength between metal and wood provided by the manufacturer.
As a result of the calculation, the adhesive strength of the polyurethane adhesive used in this experiment was much higher than 94.1 kN, which was the horizontal shear force acting at 648.0 kN. It appeared to be safe enough to ensure the flexural failure behavior of the composite beam.
where Fb denotes the adhesive strength of the adhesive, fb denotes the adhesive strength per unit area, and Ab denotes the area of adhesion.
Flexural performance evaluation experiment
Design and fabrication of specimens
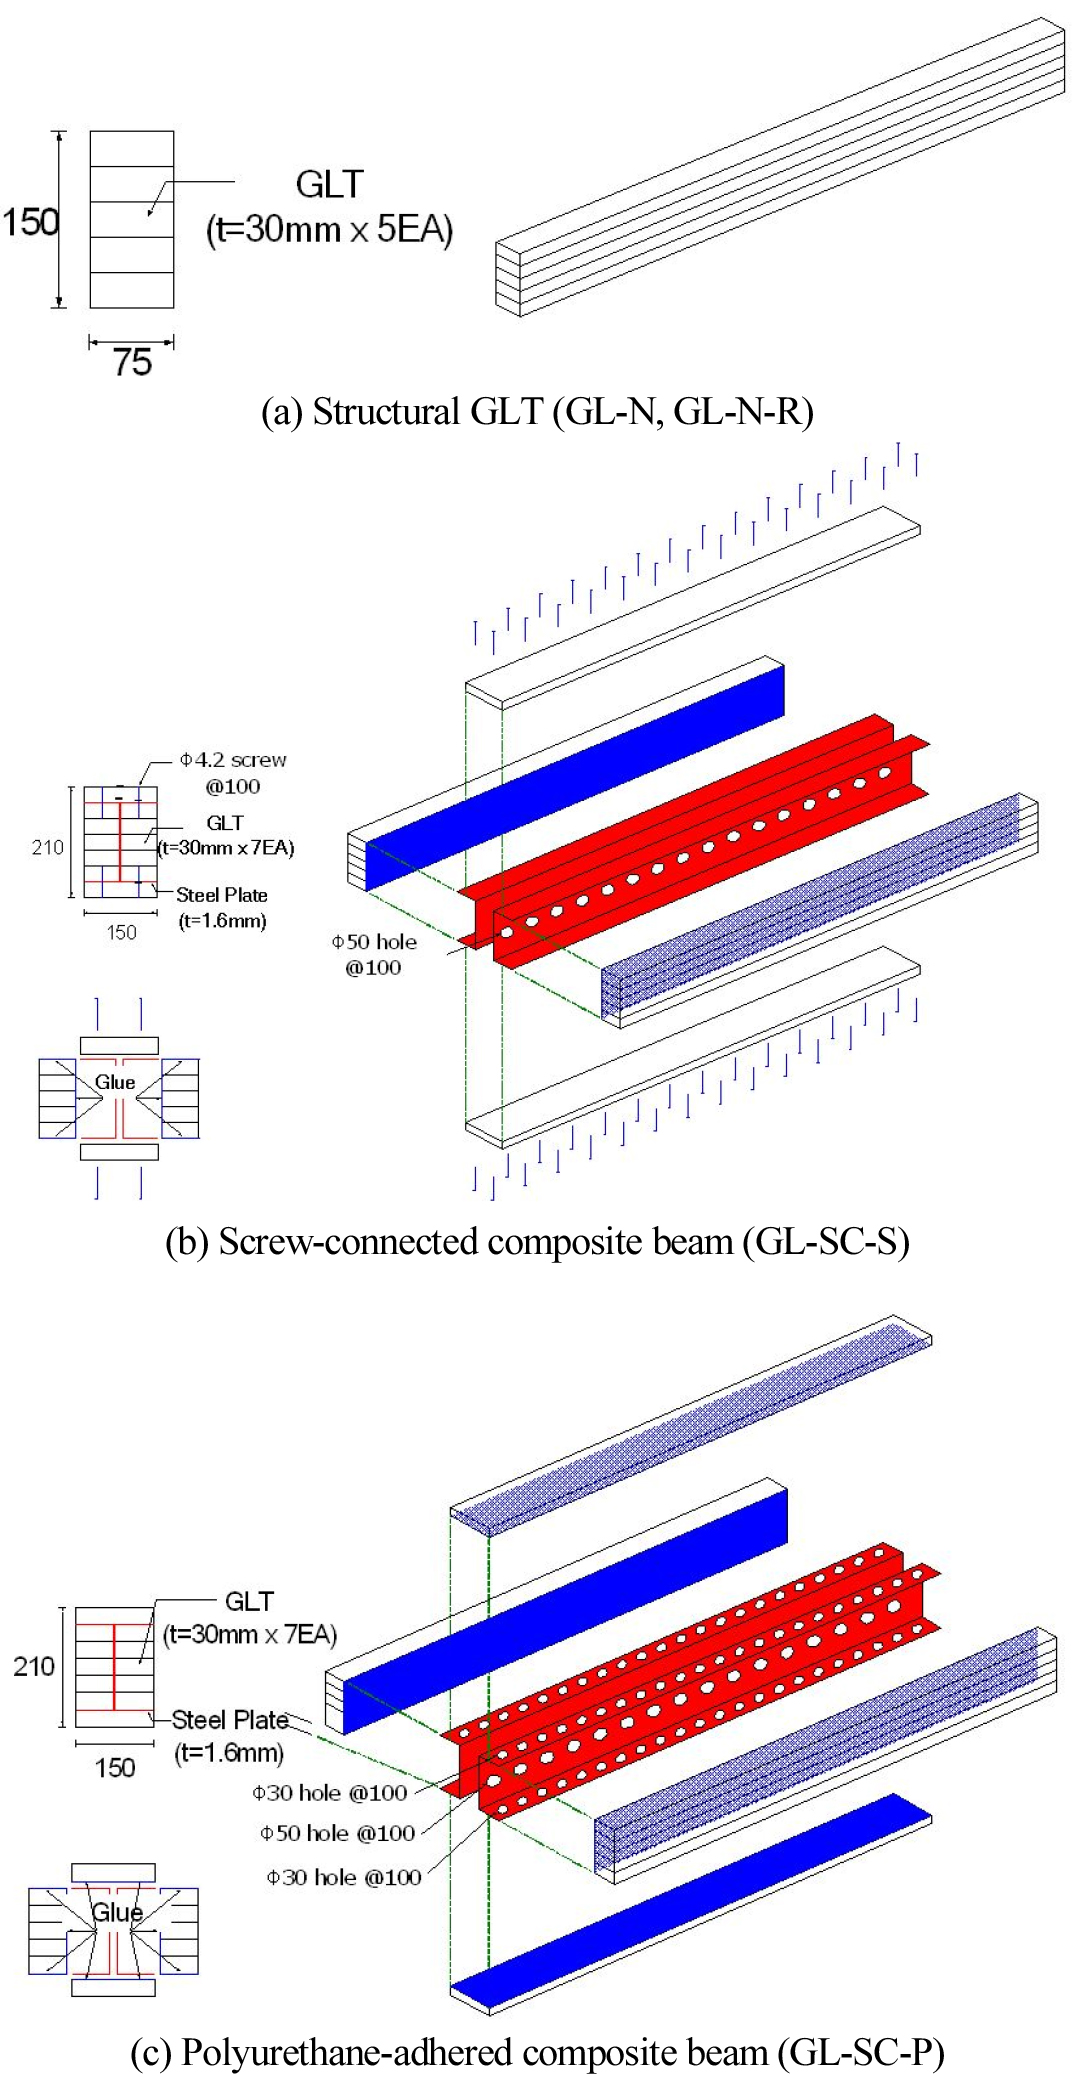
As shown in Figure 3, To evaluate the structural performance of the composite beams composed of two C-channel steel and wood, three specimens were fabricated for the flexural experiment. For the specimens, a structural GLT specimen (GL-N: Glue Laminated-None reinforced-first test, GL-N-R: Glue Laminated-None reinforced-Reverse test)) consisting of pure wood was fabricated to examine the effect of steel insertion in the structural GLT. To evaluate the adhesive performance between steel and wood according to the adhesion method, a screw-connected specimen (Glue Laminated-Screw Connection-Screw, GL-SC-S) and a polyurethane-adhered specimen (Glue Laminated-Screw Connection-Polyurethane, GL-SC-P) were fabricated.
A structural GLT made of larch wood with a strength grade of 10S-30B was selected for the cross-sectional design among symmetrical mixed grade lay-ups defined in KS F 3021 [5] and KDS 41 33 02 [8].
The layer material constituting the GLT had a cross section 30.0 mm in thickness by 75 mm in width. Five layers were pressed using a wood adhesive to produce GLTs with a section of 150 mm in height by 75 mm in width, and they were inserted in C-channel type steel. A steel-wood composite beam of 210 mm in height by 150.0 mm in width by 4000 mm in length was fabricated by adding two layers to the top and bottom.
The inserted galvanized steel was of SGH 41 [9] grade based on the KS D 3506 standard. The thickness of the steel was set to 1.6 mm to enable the cross section of GLT to be fastened immediately with self-drilling screws for wood without having to process the screw holes in advance [7].
The GLT and galvanized steel were connected by two methods: self-drilling screws or a polyurethane adhesive. For adhesion using a polyurethane adhesive, two rows ϕ30 holes on the steel flange and a row ϕ50 holes on the web were arranged at 100 mm intervals over the entire length to facilitate the adhesion of steel and wood.
The polyurethane-adhered composite beam was fabricated by applying a polyurethane adhesive on three sides of GLT of 150 mm in height and 75 mm in width, composed of five layers, to attach the C-channel-type steel. The adhesive was applied on the web of steel to fabricate a pair of composite sections on the left and right. The specimen was cured for 24 hours for complete adhesion. After the screw holes were drilled when covering the upper and lower parts of the composite section with layers, it was fastened using self-drilling screws.
The self-drilling screws used in this study were flat-headed self-drilling screws provided by the M company with a size of 4.2 mm in outer diameter and 64 mm in length, and the shear strength per screw was 4.3 kN. The screws were placed at 100 mm intervals in two rows.
The polyurethane-based adhesive provided by the H company was used for attaching steel and wood. The adhesion strength between metal and wood tested by the manufacturer was 2.2 MPa, which was reflected in this study.
Loading and measuring methods
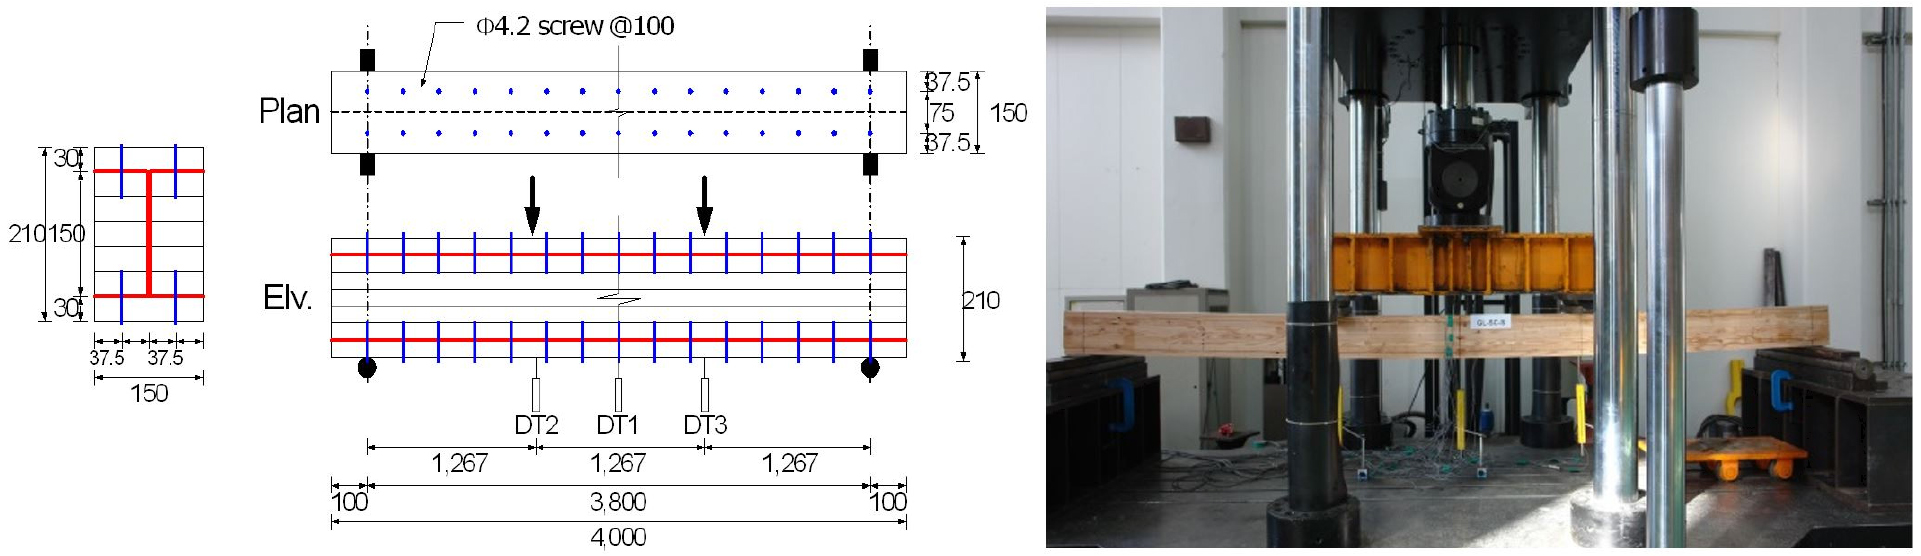
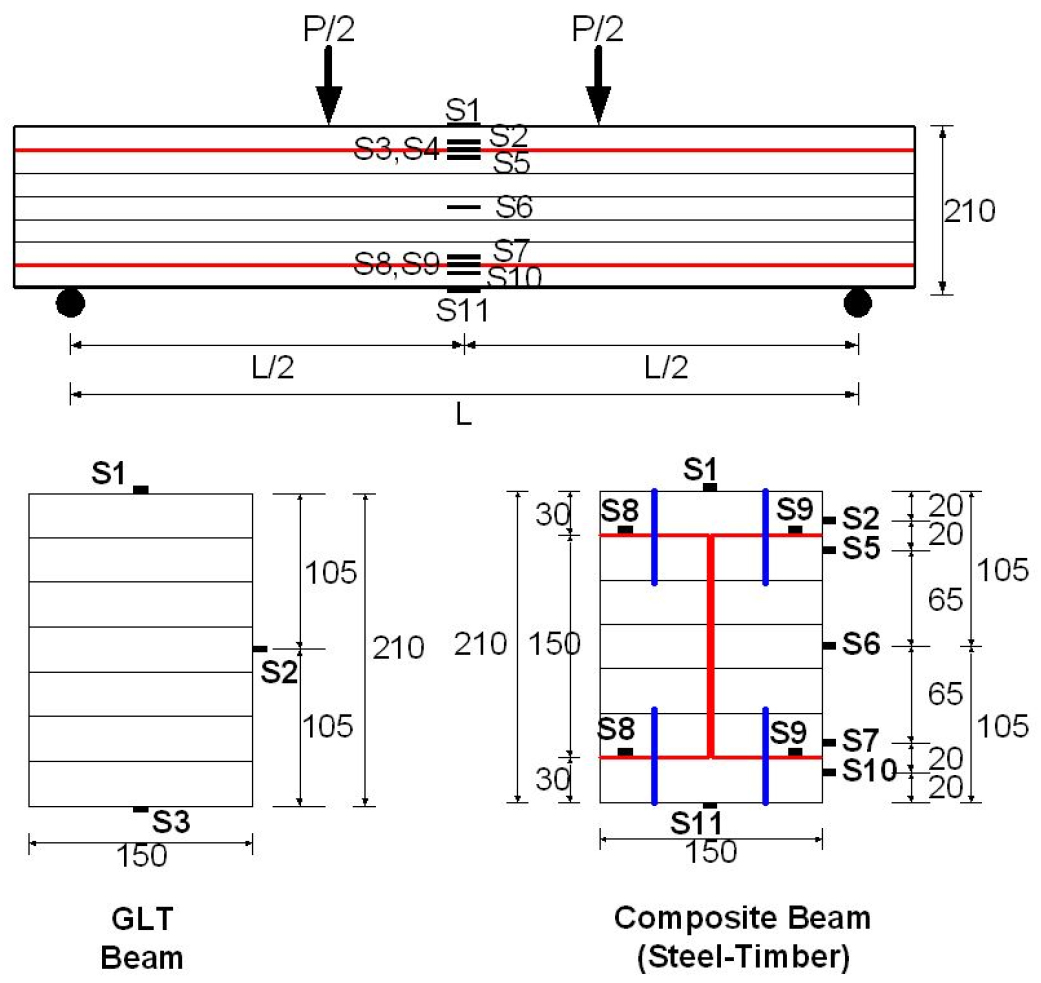
As shown in Figure 4, the composite beam specimen was manufactured based on the test method of the A-type flexural specimen of KS F 3021 and KDS 41 33 02(2016). To induce flexural failure, the distance between the points of the specimen was set to 3800 mm, which was 18 times the height of the cross section of 210 mm. Load was applied by displacement control using a universal testing machine. At one third the span length, a two-point concentrated loading method was used for loading at an average loading rate of 15 N/min or less. To measure the amount of deflection, three linear variable differential transformers were installed at the center of the specimen as well as the loading points to measure the load and displacement at each stage. As shown in Figure 5, strain gauges were installed to measure the strain occurring in the composite section of steel and wood. Four strain gauges were installed on the inserted steel, and seven strain gauges were installed on the external and upper sides of the composite section. It was planned to identify the position of the neutral axis of the composite section and measure the relative slip between steel and wood.
Experimental results and analysis
Behavior of composite beams
1) GL-SC-S specimen
GL-SC-S was the specimen composed of GLT, steel, and layer materials, in which the steel was attached using self-drilling screws. The diameter and spacing of the screws were set to realize a fully composite specimen.
The load-displacement increased linearly up to a load of approximately 46.0 kN, and then the stiffness gradually began to decrease because of the slip phenomenon between the inner steel and the upper and lower outermost layers. Under a load of 72.3 kN, the first crack occurred in the finger joint of the second layer located at the bottom, near the left loading point. Under a load of 74.8 kN, another crack occurred in the finger joint near the right loading point, resulting in a slight decrease in the load to 73.5 kN, but it increased again.
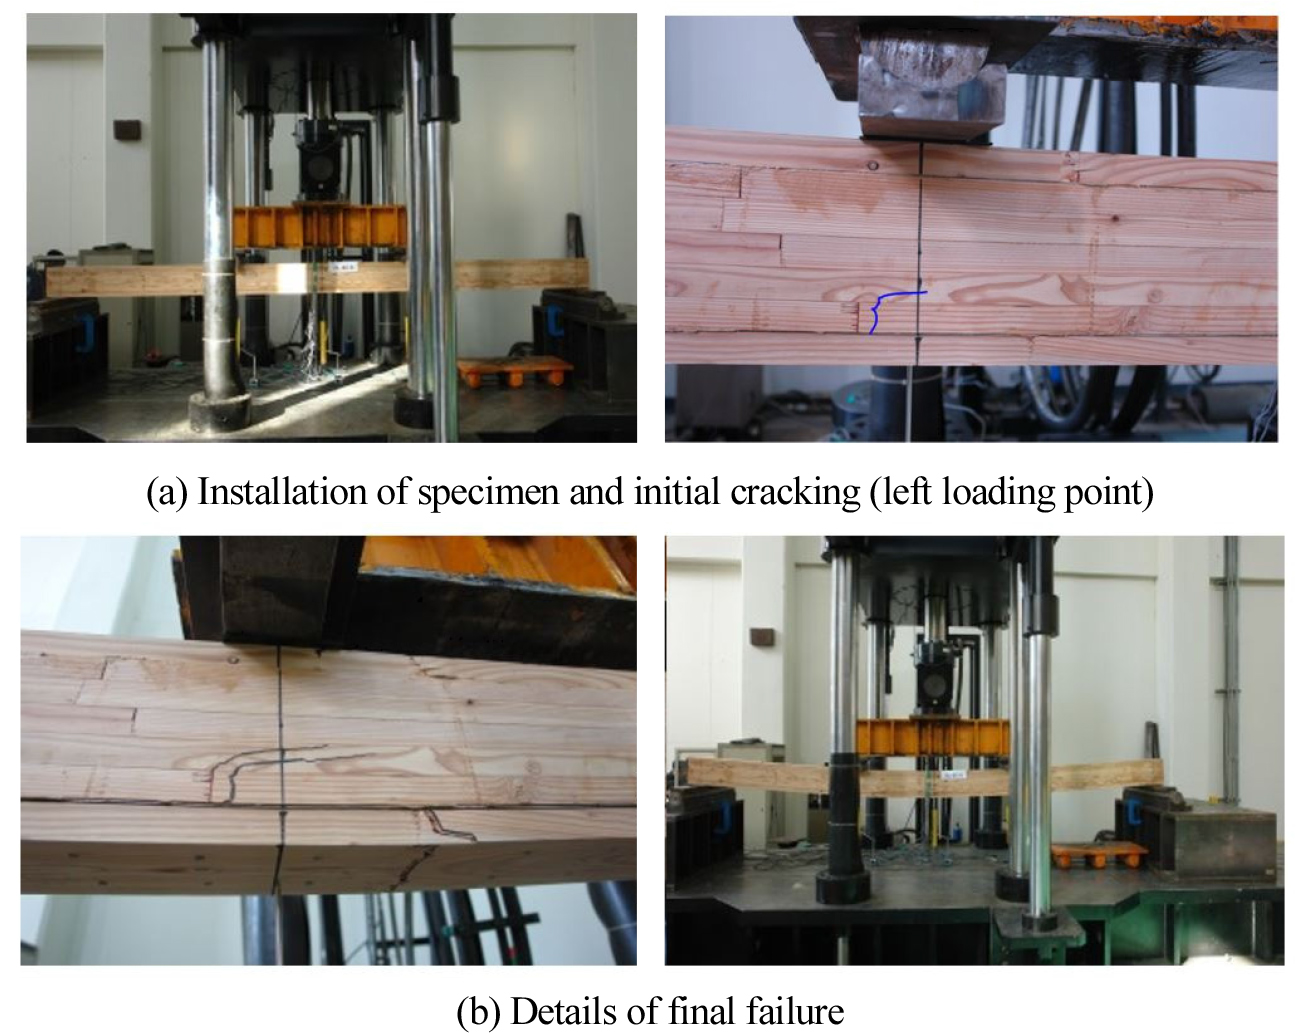
As shown in Figure 6 and 7, Under a load of 77.1 kN, the maximum load was reached owing to the cracking of the outermost-layer finger joint located near the left loading point. Finger joint cracks did not propagate to the second layer, but they occurred locally only on the outermost layer and were presumed to result from the cutting of the self-drilling screw near the loading point.
After the failure of the specimen, the amount of slip between the inner steel and the upper and lower outermost layers was measured to be approximately 4 mm, and no horizontal separation between the GLT inside the C-channel-type steel and steel occurred.
As a result of separating the steel and the outermost layer on the tensile side after the end of the experiment, the direct screw located at the cracking site in the outermost layer finger joint near the left side loading point was cut. At another site, the screw was not cut, and the screw was not severely deformed.
Assuming a fully composite specimen, the expected maximum load of GL-SC-S was 68.0 kN based on the yield strength of steel and 84.0 kN based on the flexural strength of wood. The composite section connected by self-drilling screws demonstrated the adhesive strength for the steel material to reach the yield stress, but it failed to achieve a fully composite behavior.
2) GL-SC-P specimen
GL-SC-P was a specimen in which steel was integrated with GLT and the upper and lower outermost layers using a polyurethane adhesive. The adhesive strength of the polyurethane adhesive was significantly higher than the total composite strength of the steel and wood.
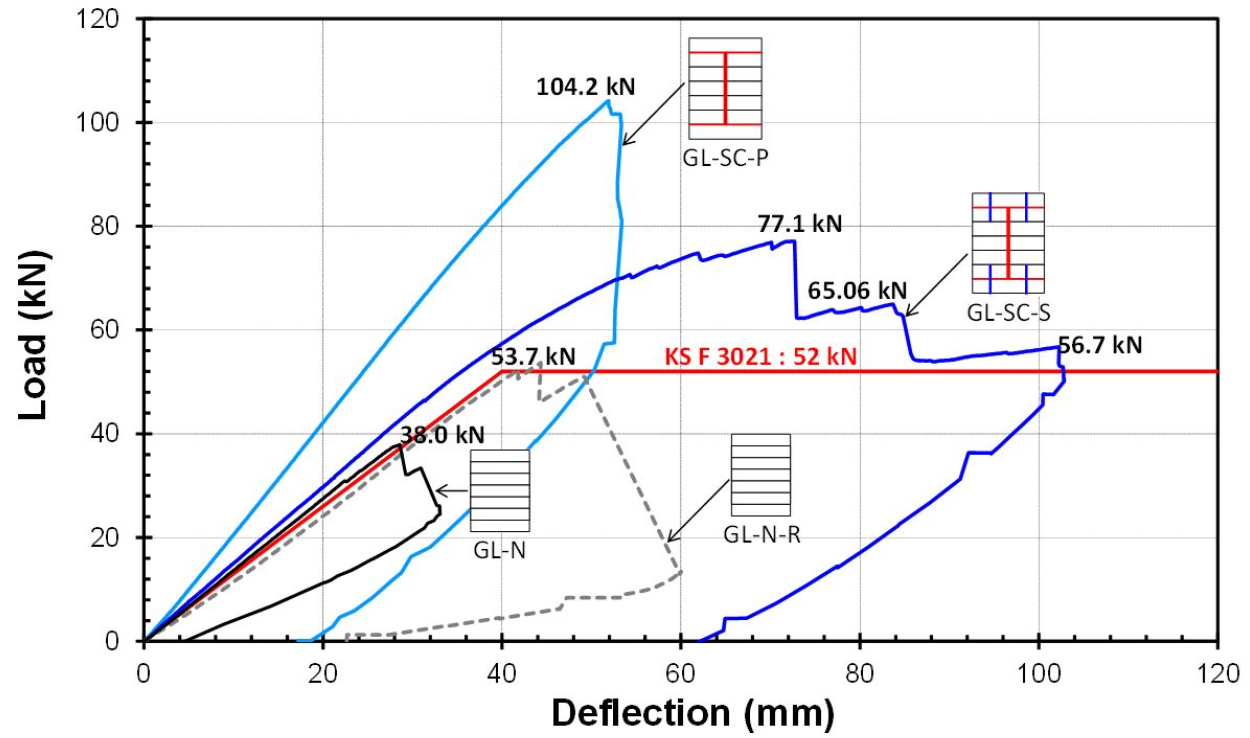
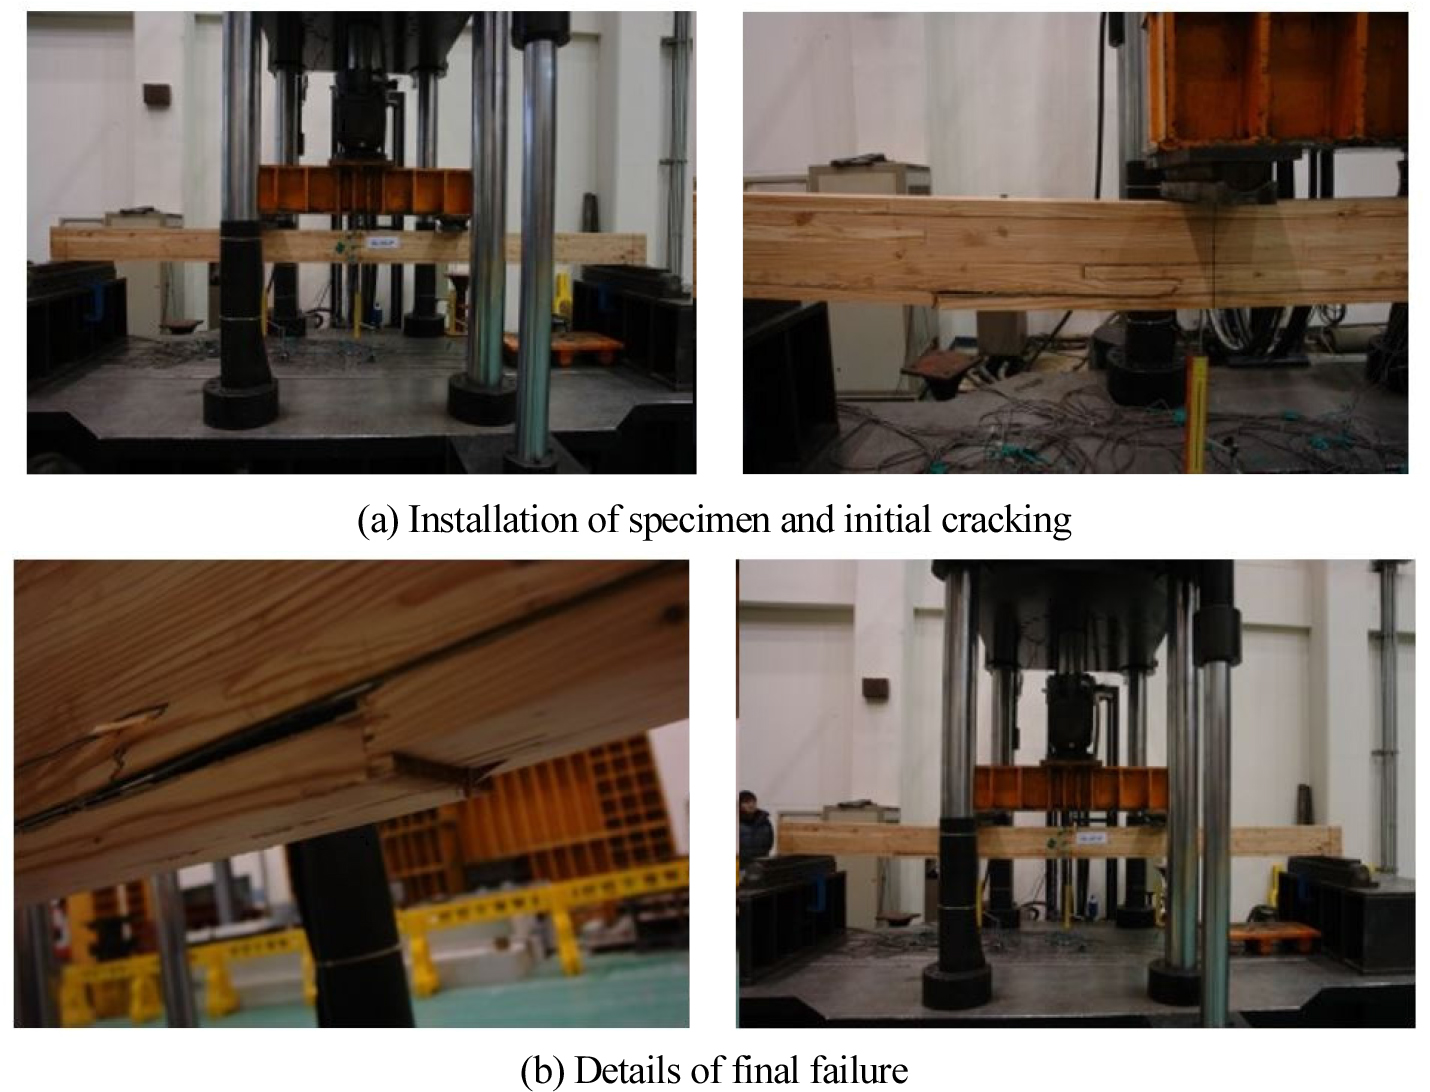
As shown in Figure 8, The fracture of the specimen occurred owing to the fracture of the finger joint located 600 mm from the left loading point to the specimen point under a load of 104.2 kN. Then, the separation of the steel material and the outermost layers proceeded at the same time. This specimen showed no cracking until reaching the maximum load, and the steel and outermost layer exhibited an integrated behavior.
As shown in Figure 7, The experimental maximum load of 104.2 kN for the specimen far exceeded the theoretical maximum load, indicating a fully composite behavior.
Evaluation of strength and stiffness
Table 2 shows the strength and stiffness of the steel-wood composite beams in comparison with the pure GLT. The flexural elastic modulus and flexural strength in the Table 2 can be calculated by Equations (15) and (16), as follows, according to KS F 3021 (Structural GLT).
Here, I denotes the moment of inertia (GLT beam: 115,762,500.0 mm4 and composite beam: 184,491,093.0 mm4), Z denotes the modulus of section (GLT beam: 1,102,500.0 mm4 and composite beam: 1,766,582.0 mm4), Pm denotes the maximum load of experiment, Pe denotes the load of proportional limit, and denotes the displacement at proportional limit.
Table 2.
Flexural performance of composite beams
In Table 2, the flexural elastic modulus and flexural strength were calculated in two ways: and were calculated using the moment of inertia and the modulus of section for the steel-wood composite beam, and and were calculated using the moment of inertia and the modulus of section for the steel-wood composite beam for the pure GLT beam, as in Equations (17) and (18) below.
Here, Ic denotes the moment of inertia for the composite beam, Iw denotes the moment of inertia for the GLT beam, Zc denotes the modulus of section for the composite beam, and Zw denotes the modulus of section for the GLT beam.
The flexural strength and flexural elastic modulus calculated based on the flexural test of the composite material were 30.8 and 10,515.0 N/mm2, respectively, which met the flexural strength and flexural elastic modulus of 30.0 and 10,000.0 N/mm2 of the strength grade 10S-30B for GLT. Then, the flexural strength obtained from the experimental results was calculated based on the results of GL-N-R in a previous study [10], and the flexural modulus was calculated from the experimental results of GL-N in this study.
For the calculation of the flexural strength, GL-N did not properly exhibit the strength because of poor adhesion, but the initial stiffness was not affected. For the calculation of the flexural stiffness, the initial stiffness decreased owing to the influence of pre-generated cracks on the compressive side of GL-N-R. Because there was no effect on the strength, it was reflected in the calculation.
As a result of testing the steel-wood composite beam, the self-drilling screw-connected composite beam (GL-SC-S) demonstrated the maximum load and initial stiffness of 1.44 and 1.13, respectively. Although it failed to achieve a fully composite behavior, an improvement in flexural performance was observed because the steel could sufficiently reach the yield strain with adequate adhesive strength between the steel and embedded GLT.
The polyurethane-adhered composite beam (GL-SC-P) demonstrated a performance significantly exceeding the theoretical maximum load of 84.0 kN. Compared with the pure GLT beam, the maximum load and initial stiffness were 1.52 and 1.94 times greater, respectively, demonstrating an excellent improvement in the strength and stiffness considering the amount of steel reinforcement. The steel and GLT were deemed to have exhibited a fully composite behavior until the final failure.
Evaluation of strain and composited behavior
Figures 9 and 10 show the change in strain according to the change in load for each specimen. In the figure, the horizontal axis represents the strain, and the vertical axis represents the strain measurement points for the beam depth.
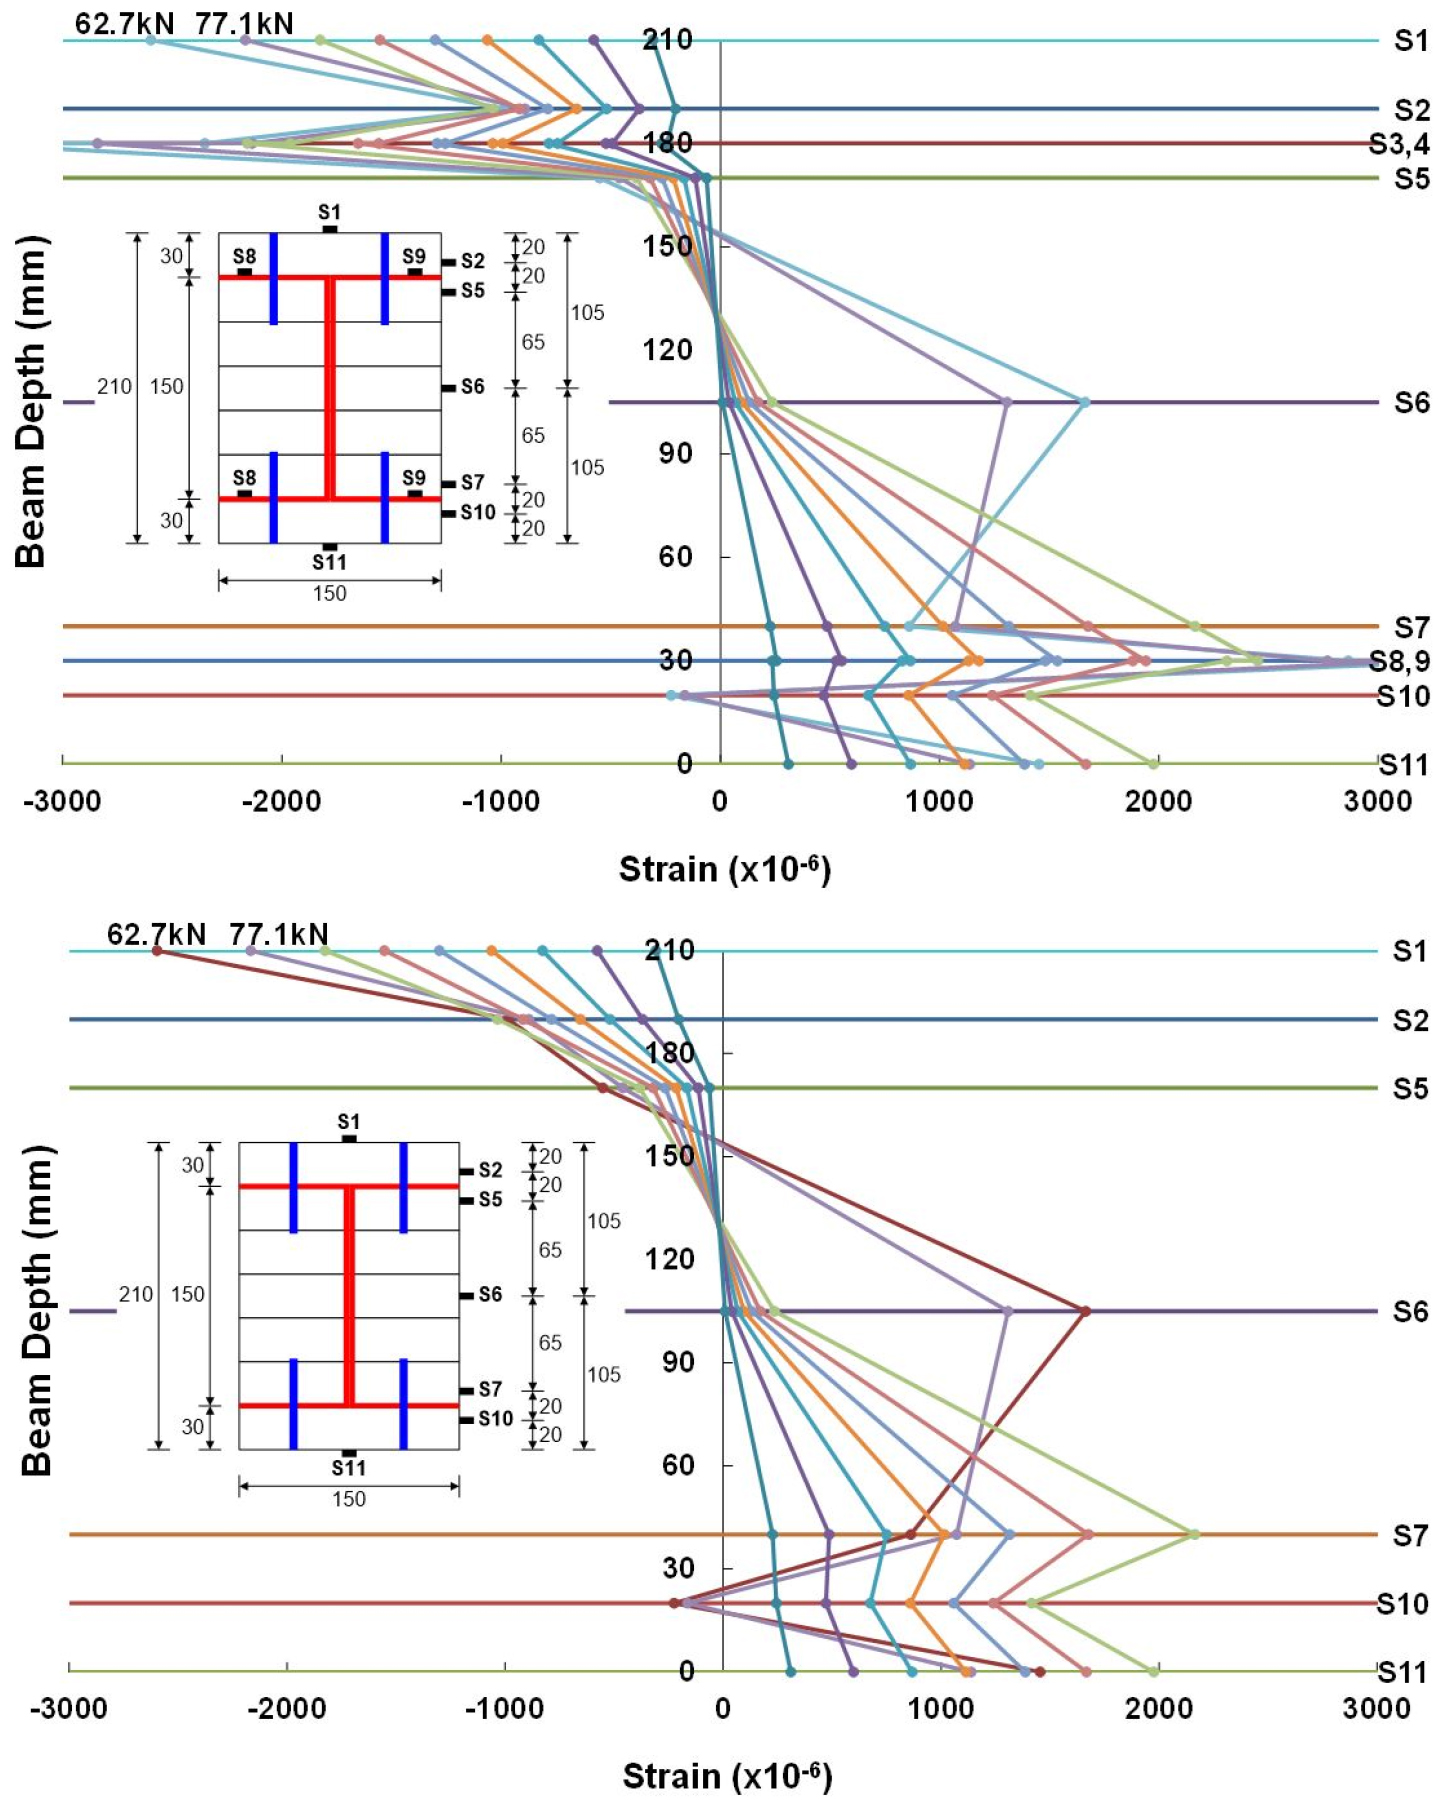
Figure 9 shows the strain distribution of the GL-SC-S specimen, indicating that the relative slip between the steel and GLT is gradually progressing from the initial stage of loading. During the experiment, there was no significant change in the load owing to cracking until the maximum load was reached; therefore, the strain of the section exhibited a constant trend until the maximum load.
While the compressive-side strain demonstrated a strain distribution close to that of a fully bonded composite, the tensile-side strain demonstrated a partially composite behavior because of the effect of cracking, and the neutral axis moved upward rapidly after reaching the maximum load.
The maximum strain in the outermost layer of GL-SC-S was 2,148 × 10−6 and 2,118 × 10−6 on the compressive side and the tensile side, respectively. It was 2,842 × 10−6 and 3,152 × 10−6, respectively, for steel, indicating that it reached a partial yield.
Figure 10 shows the distribution of strain in GL-SC-P, indicating a fully composite behavior until reaching the maximum load. With the neutral axis located in the center of the section until the end of loading, the compressive and tensile strains appeared in symmetry.
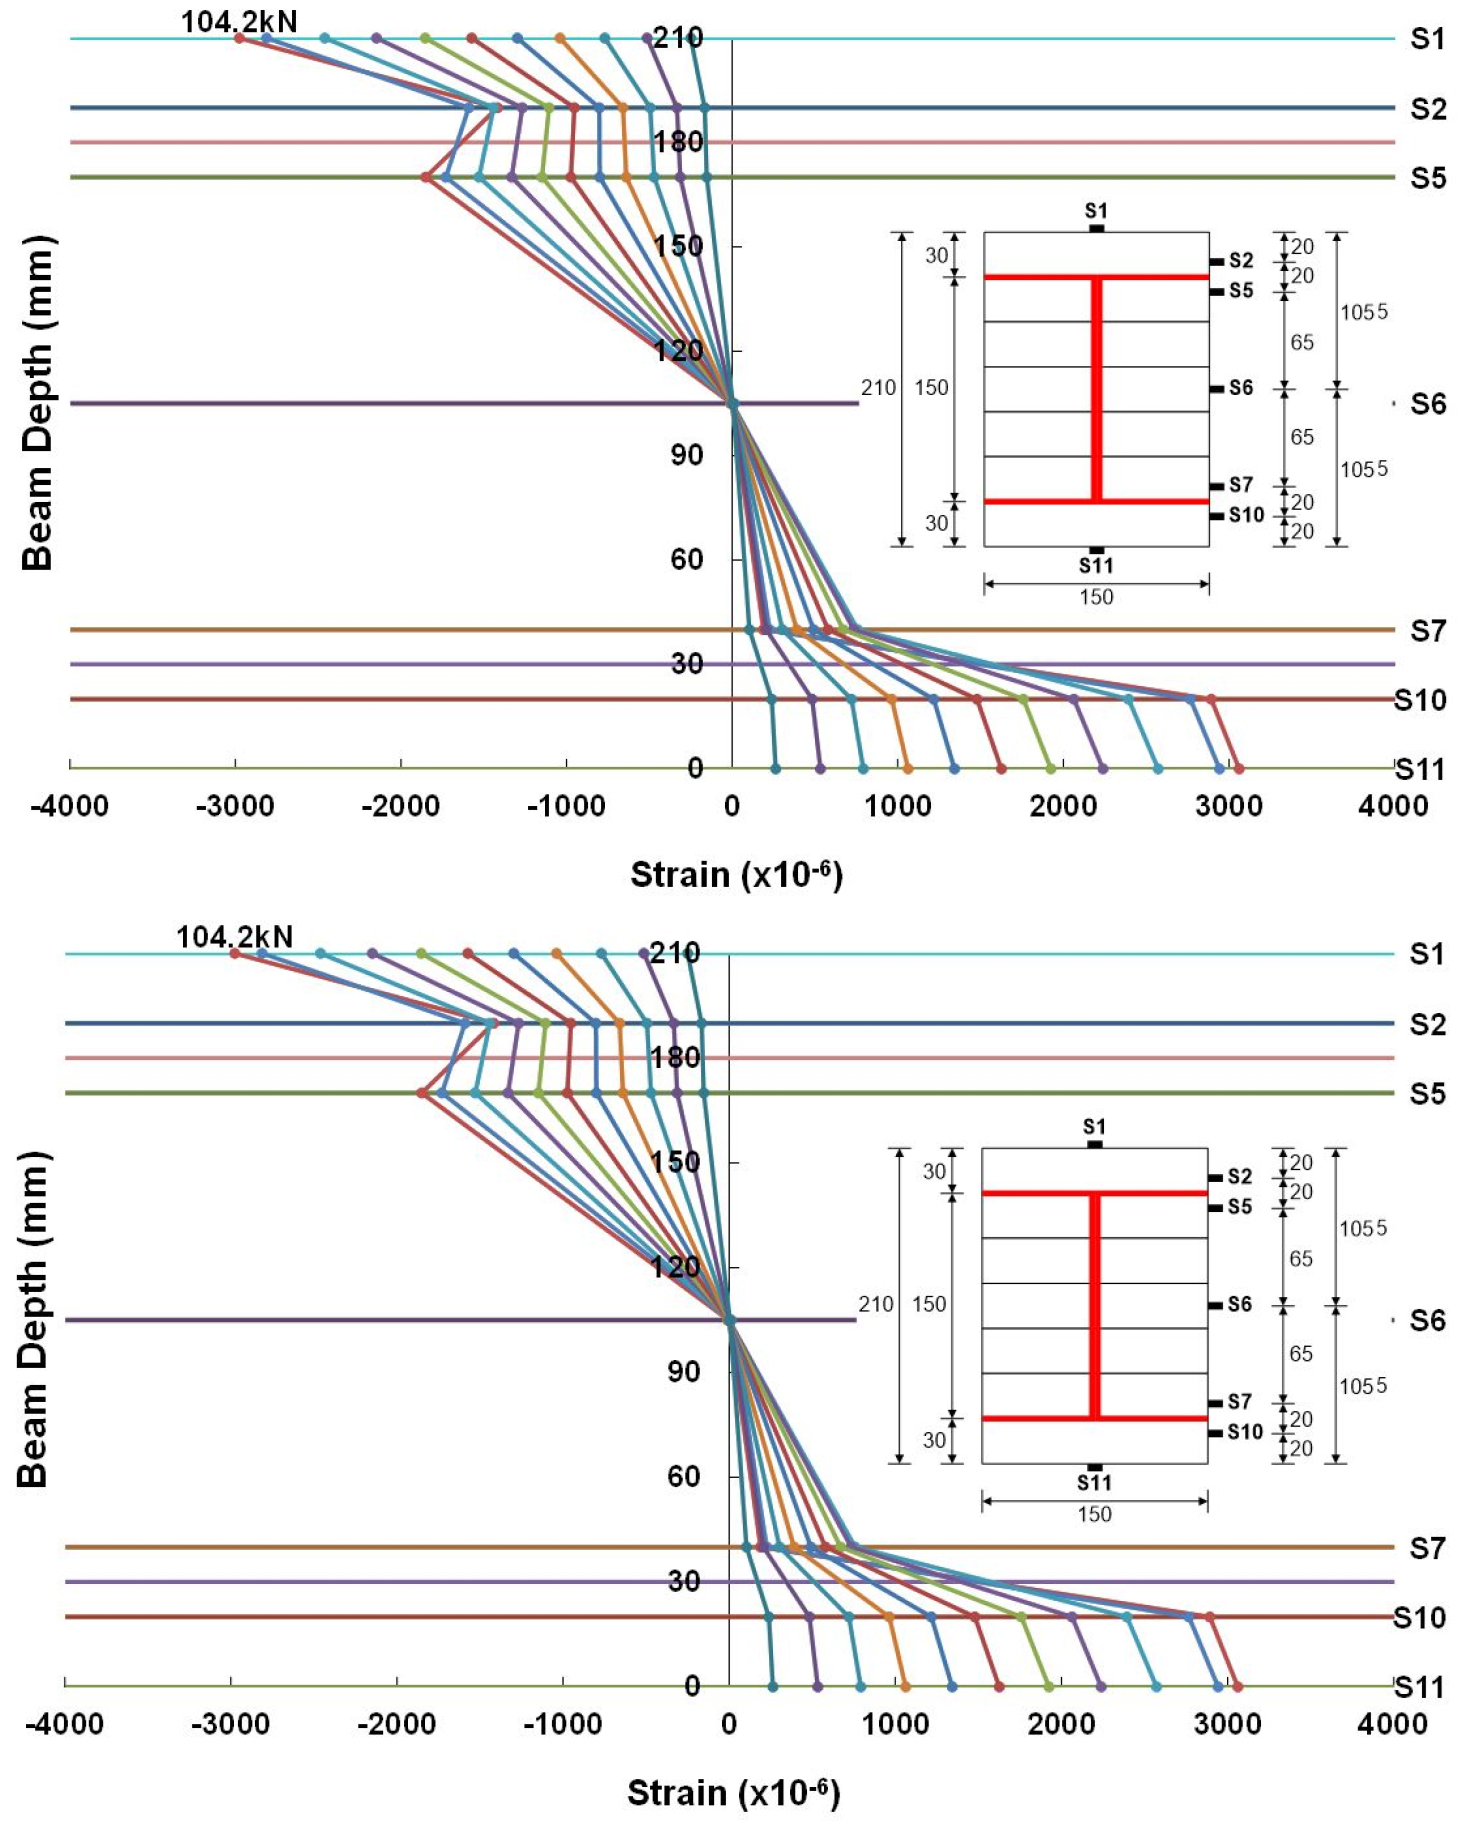
The maximum strain in the outermost layer of GL-SC-P was 2,977 × 10−6 and 3,063 × 10−6 on the compressive and tensile sides, respectively. It was 10,771 × 10−6 and 9,485 × 10−6 for steel, respectively, indicating that both wood and steel reached a yield.
Conclusions
The following conclusions were drawn as a result of developing steel-wood composite beams with two C-channel-type steels embedded in GLT and testing their flexural performance.
1) The predicted theoretical maximum load of the self-drilling screw-connected steel-wood composite beam (GL-SC-S) was 68.0 kN based on the yield strength of steel, assuming a fully composite behavior. It was 84.0 kN based on the flexural strength of wood. The experimental maximum load was 77.0 kN. It demonstrated that the adhesive strength for the steel material reached the yield stress but failed to achieve a fully composite behavior.
2) The maximum load and initial stiffness of the self-drilling screw-connected steel-wood composite beam (GL-SC-S) were 1.44 and 1.13, respectively. Although it failed to achieve a fully composite behavior, an improvement in flexural performance was observed because the steel could sufficiently reach the yield strain with sufficient adhesive strength between steel and embedded GLT.
3) The polyurethane-adhered steel-wood composite beam (GL-SC-P) demonstrated a fully composite behavior until reaching the maximum load. It exhibited a strength far exceeding the theoretical load of the specimen at 84.0 kN. Compared with the pure GLT beam, the maximum load and initial stiffness were 1.52 and 1.94 times greater, respectively, demonstrating an excellent improvement in the strength and stiffness in consideration of the cross-sectional area.
4) The maximum strain in the outermost layer of the polyurethane-adhered composite beam (GL-SC-P) was 2,977 × 10−6 and 3,063 × 10−6 on the compressive and tensile sides, respectively. It was 10,771 × 10−6 and 9,485 × 10−6 for steel, indicating that both wood and steel reached a yield.
