

Introduction
Background and objectives
Scope and methodology
Literature review
Low-carbon urban design and policy
Development of spatial planning models: focus on the energy sector
Contribution and distinction
Analytical framework
Development of a neighborhood-scale carbon emission inventory
Emission and absorption coefficients and calculation methods for neighborhood-level carbon accounting
Identification of carbon-neutral spatial planning elements at the neighborhood scale
Synthesis of planning elements for neighborhood- scale carbon-neutral spatial design
Development of a carbon-neutral spatial planning model at the neighborhood scale
Development of a base model for neighborhood carbon-neutral planning
Scenario development and typology of neighborhood spatial planning models
Development of spatial planning models based on carbon-neutral scenarios
Quantification of carbon-neutral planning elements
Result and discussions
Assumptions and coefficients for carbon emission estimation
Carbon emission calculation formulas
Carbon emission estimation results
Discussions
Conclusions
Introduction
Background and objectives
As carbon neutrality becomes a core agenda at both global and national levels, the need to develop built and urban environments aligned with this has become increasingly urgent. The international community has made efforts to address climate change, including the Kyoto Protocol (1997) and the Paris Agreement (2015). In alignment with these efforts, South Korea has established the 2050 Carbon Neutral Roadmap for Land, Infrastructure, and Transport, which outlines emission reduction strategies across sectors such as buildings, transportation, land use, and international cooperation.
As the importance of managing carbon emissions at the regional and urban scales continues to grow, there is a growing need for carbon neutrality strategies to be applied across spatial units, including individual buildings. In addition, recent reforms in urban planning legislation call for proactive spatial strategies and institutional responses. At a macro level, the most fundamental approach to achieving carbon neutrality in national and urban territories involves designing efficient spatial structures and systematically integrating sector-specific components. At the micro level, key planning elements for carbon neutrality at the building scale include passive energy design, zero- energy buildings, and green remodeling techniques aimed at reducing on-site energy consumption. These strategies can be implemented across multiple spatial hierarchies—from the national level, to municipal governments and new town developments, to neighborhood districts, and ultimately down to individual buildings.
However, there remains a significant lack of knowledge and data to quantitatively assess carbon absorption and emissions, as well as the effectiveness of carbon neutrality policies, at national and urban scales. The complexity of quantification stems from variations in regional characteristics such as geographic scale, industrial composition, population structure, and lifestyle patterns. At the national and city levels, the scope of carbon inventories is often too vast to be effectively managed through urban design alone. Conversely, individual buildings, due to their limited scale, are unlikely to yield substantial carbon reductions on their own. This highlights the need to shift from a building-specific approach toward a more integrated perspective that treats groups of buildings as cohesive spatial units. There is a pressing need to develop empirically grounded carbon neutrality policies and institutional frameworks that reflect growing demands for new land uses, evolving functions in commercial and business districts, changes in public infrastructure needs and services, and the increasing multifunctionality of facilities within residential neighborhoods.
This study aims to identify the spatial characteristics of neighborhood units that are effective in reducing carbon emissions by developing hypothetical models of urban forms implemented at the neighborhood scale and estimating and comparing their emission levels. Based on these findings, the study seeks to propose key planning elements that should be considered in future urban development and planning projects to support carbon reduction goals.
Scope and methodology
A review and analysis of existing literature on low-carbon planning strategies and carbon emission estimation in urban contexts was conducted to identify relevant planning elements and compile foundational data, including emission calculation formulas and emission factors. Specifically, three steps were taken: first, a carbon inventory was developed to estimate emissions for neighborhood-scale planning models; second, methods for calculating both carbon emissions and absorption at the neighborhood level were examined; and third, key planning elements for carbon neutrality were identified to support the development of spatial models.
In the process of constructing neighborhood-scale spatial planning models for carbon neutrality, a base model was initially developed. Subsequently, six types of neighborhood scenarios were formulated by applying variations in planning elements. These were translated into spatial planning models, which were then used to estimate carbon emissions and conduct comparative analyses based on the characteristics of each scenario.
Literature review
Low-carbon urban design and policy
Since the early 2000s, a growing body of research has explored low-carbon urban planning and design strategies. For instance, Yu et al. [1, 2] identified urban design elements for greenhouse gas mitigation and analyzed the cost-effectiveness of environmentally friendly neighborhood development. They also examined policy measures to integrate low-carbon planning into existing urban improvement projects. Cho et al. [3] proposed planning and design strategies for low- carbon residential complexes and assessed both the costs and emission reduction potential of new technologies. Wang et al. [4] identified key planning elements for carbon-neutral eco-cities and proposed implementation strategies for pilot projects. In addition, Kim et al. [5] examined emission characteristics by zoning and building types, suggesting theoretical reduction rates and criteria for energy performance and emissions across building categories.
Development of spatial planning models: focus on the energy sector
Wang [6] proposed a model and planning framework for creating a zero-energy smart city, using Sejong City as a case study. Lim [7] conducted an R&D project on U-City spatial planning and design technologies, which included the development of district-level planning guidelines, master plans for pilot zones, and detailed system designs and prototypes. Lee [8] identified optimal passive design technologies tailored for multi-family housing and proposed a Korean-style net-zero housing model optimized for energy efficiency, energy cost, and carbon dioxide emissions. Jang et al. [9] suggested urban planning strategies and techniques for reducing energy consumption, incorporating smart and zero- energy technologies. Son et al. [10] conducted a study on integrated operation and management models for smart urban spaces and infrastructure. This research involved the classification and data development of smart urban facilities, proposing mobile technology applications and system-integrated management strategies based on R&D outcomes.
Contribution and distinction
Previous studies reveal that considerable research has focused on estimating carbon emissions from buildings and urban spaces, identifying low-carbon planning elements, and evaluating their effects when applied. These studies provided a valuable foundation and were frequently referenced in the present research, particularly in the process of identifying planning elements for carbon reduction and absorption at the neighborhood scale. However, relatively few studies have developed and presented spatial planning models at the design level that incorporate multiple planning scenarios. Most prior work has relied on regression- based models to estimate emissions, without translating these findings into visualized or scenario-based spatial forms.
This study distinguishes itself by selecting and applying planning elements specifically suited for neighborhood-level implementation and by constructing visualized spatial planning models under a range of scenarios. Through comparative analysis of these models, the study develops an optimized spatial planning framework that integrates both emission reduction and carbon absorption performance—offering a practical and spatially grounded tool that extends beyond the limitations of existing quantitative approaches.
Analytical framework
Development of a neighborhood-scale carbon emission inventory
This study focuses on identifying greenhouse gas (GHG) emission pathways at the neighborhood scale—one of the key spatial units within urban systems—with the aim of using this information to extract spatial planning elements that support carbon neutrality. To this end, existing literature on GHG emission pathways in urban spaces was reviewed and synthesized to construct a carbon emission inventory specific to neighborhood-scale contexts. The inventory serves as a foundational tool for identifying and linking spatial planning components that can be applied to carbon- neutral neighborhood development. In particular, the inventory was designed not only to document emission sources but also to guide the subsequent identification and integration of planning elements that support carbon mitigation and absorption.
Emission and absorption coefficients and calculation methods for neighborhood-level carbon accounting
To estimate carbon emissions based on neighborhood-scale spatial planning, this study identified relevant coefficients and calculation methods, as summarized in the Table 1. Emission-related coefficients are categorized into three sectors: buildings, transportation, and public facilities. Absorption-related coefficients are classified under green and open space, specifically urban parks and vegetation areas. These coefficients are used to quantify the carbon implications of specific spatial planning elements. The method for estimating carbon emissions is based on applying these coefficients within calculation formulas. In addition to the basic coefficients, specific assumptions and parameters are introduced during the spatial modeling process. These conditions—tailored to the characteristics of the hypothetical spatial configurations—are incorporated into the formulas to produce more context- sensitive estimates.
Table 1.
Carbon emission and sequestration coefficients and estimation methods at the neighborhood scale
| Category | Type | Activity Data (a) | Unit Energy Use (b) |
CO2 Emission/ Sequestration Factor (c) | Energy Conversion Factor (d) | Emissions / Sequestration (kgCO2) | ||
| Carbon Emissions | Public Facility Sector | |||||||
| Road area (m²) |
11 kWh/m2/yeara |
0.466 ㎏CO2eq/kWhd | - | (a) * (b) * (c) | ||||
| Park & green area (m²) |
2 kWh/m2/yeara |
0.466 ㎏CO2eq/kWhd | - | (a) * (b) * (c) | ||||
| Building Sector | ||||||||
| Electricity Use | Residential |
124 kWh/m2/yearb |
0.466 ㎏CO2eq/kWhd | - | (a) * (b) * (c) | |||
| Non-residential | 153 kWh/m2/yearb | - | (a) * (b) * (c) | |||||
| Gas (LNG) | Residential | 124 kWh/m2/yearb |
56,100 kgCO2eq/TJd, e |
0.0000036 TJ/Kwhf | (a) * (b) * (c) * (d) | |||
| Non-residential | 153 kWh/m2/yearb | (a) * (b) * (c) * (d) | ||||||
| District Heating | Residential | 124 kWh/m2/yearb |
0.1226 tCO2eq/Gcald | 0.000860421 Gcal/KWhg | (a) * (b) * (c) * (d) | |||
| Non-residential | 153 kWh/m2/yearb | (a) * (b) * (c) * (d) | ||||||
| Transport Sector | ||||||||
| Gasoline | 1,065Lc |
71,600 ㎏CO2eq/TJe |
0.0000304 TJ/Lg | (a) * (b) * (c) * (d) | ||||
| Disel | 2,029Lc |
73,200 ㎏CO2eq/TJe |
0.0000352 TJ/Lg | (a) * (b) * (c) * (d) | ||||
| LPG | 1,892Lc |
64,000 ㎏CO2eq/TJe |
0.0000584 TJ/Lg | (a) * (b) * (c) * (d) | ||||
| Carbon Sequestration | Park & Green Area (ha) | |||||||
| Neighborhood Park | - |
8tCO2eq /ha+++ | - | (a) * (c) | ||||
| Themed Park | - | - | (a) * (c) | |||||
| Facility Green Area | - | - | (a) * (c) | |||||
Identification of carbon-neutral spatial planning elements at the neighborhood scale
To identify planning elements that support carbon neutrality at the neighborhood level, a panel of 11 experts was assembled, consisting of professionals from academia, the private sector, and public institutions with extensive knowledge and experience in urban planning, architecture, landscape design, transportation, and energy. Conducted between May 31 and June 20, 2022, the survey was structured around five key domains of neighborhood-scale carbon-neutral spatial planning, which were previously identified in the study. Each domain included specific planning elements to be evaluated and validated by the expert panel.
Synthesis of planning elements for neighborhood- scale carbon-neutral spatial design
As summarized in Table 2, implementing carbon- neutral spatial planning at the neighborhood scale requires the refinement and integration of 19 planning elements across five domains identified through the literature review, ensuring their practical relevance to real-world applications. In the domain of spatial structure and land use, mixed-use development and compact, high-density urban forms should be considered complementary strategies. Rather than designating separate areas for renewable energy installations, such features should be incorporated within the architectural and energy planning domains. Climate- responsive urban design is also closely linked to the strategic expansion and distribution of green spaces. In the transportation planning domain, the central aim is to reduce fossil fuel use associated with daily mobility. Key measures include enhancing public transit, implementing road diets, and promoting modal diversification. Among these, prioritizing bicycle infrastructure and walkability stands out as a critical element of carbon-neutral mobility. From an integrated neighborhood planning perspective, architectural and energy strategies are best approached through the concept of energy-producing buildings, rather than as distinct categories. Finally, in the green and open space domain, planning should focus on expanding green infrastructure and establishing a connected green network throughout the urban fabric.
Table 2.
Carbon-neutral planning elements by sector at the neighborhood scale
Development of a carbon-neutral spatial planning model at the neighborhood scale
To develop a spatial planning model for carbon neutrality at the neighborhood scale, an appropriate spatial unit was first defined in line with the study’s objectives. Relevant case studies were then reviewed to inform the formulation of planning scenarios based on the characteristics of key planning elements. These scenarios served as the foundation for the development of spatial models that reflect carbon-neutral planning strategies.
Development of a base model for neighborhood carbon-neutral planning
As shown in Table 3, the base model for neighborhood-scale planning was developed using criteria for new town development and a review of land use and infrastructure case studies. Land use was allocated as follows: residential areas (40–45%), commercial zones (approximately 3%), green and open spaces (20–25%), educational facilities (4–5%), public facilities including cultural, welfare, and administrative uses (5%), with the remaining area designated for roads and other infrastructure. The population was set at 14,500, based on a density of 250 persons per hectare applied to the developable residential area, excluding green spaces, roads, and public facilities. The total neighborhood area was defined as 1.2 km by 1.2 km, totaling 1.44 million square meters.
Table 3.
Land use composition and population of the base neighborhood model
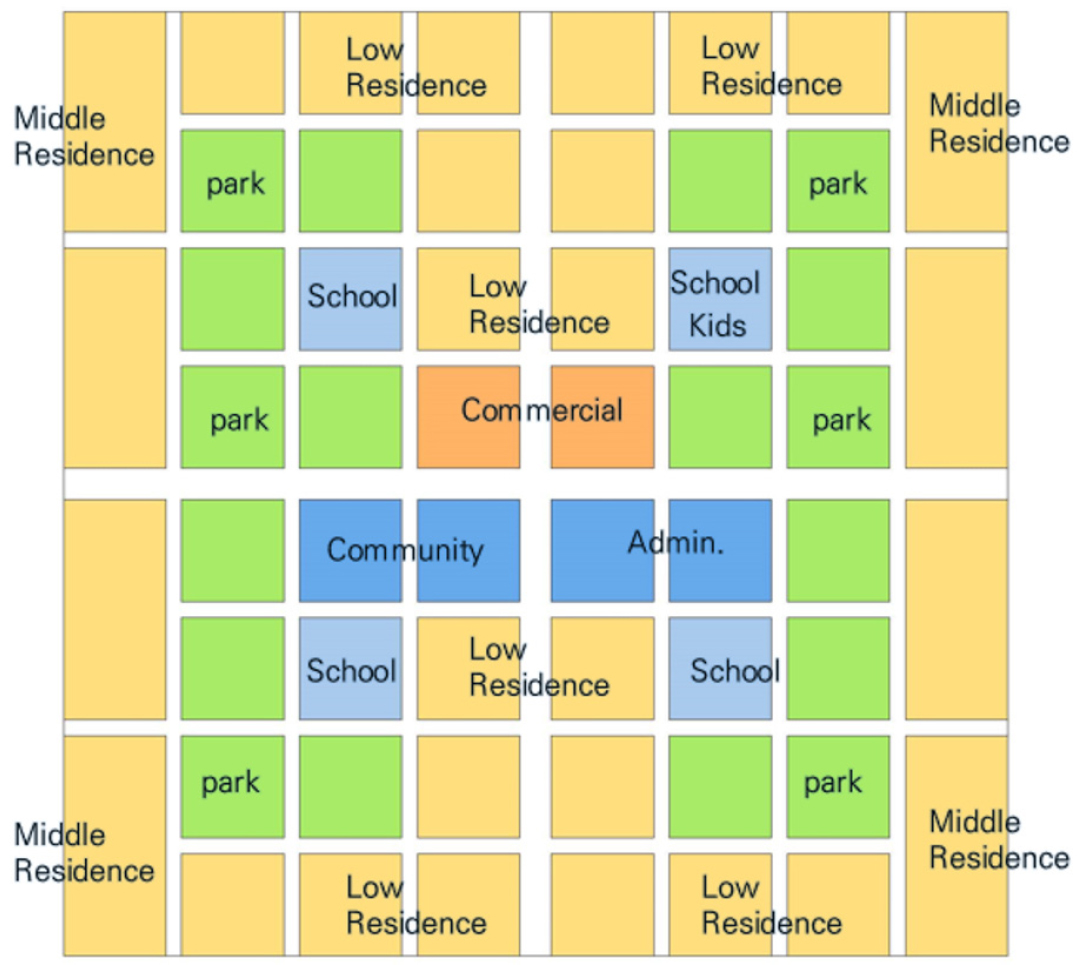
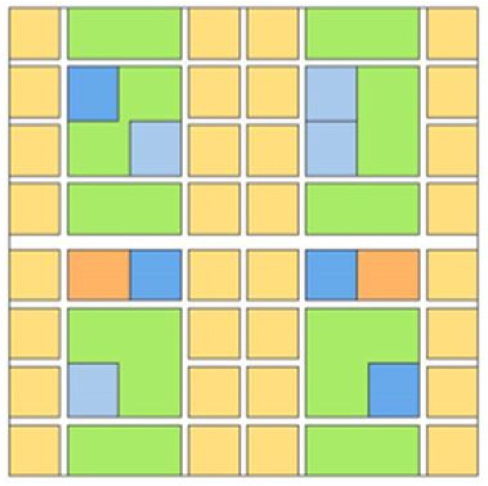
Figure 1 illustrates the spatial layout of the base neighborhood model developed for carbon emission estimation. The block size was established at 130 meters by 130 meters, and facilities were distributed in accordance with the designated land use ratios. Commercial and business facilities were allocated to two blocks. Educational facilities occupied four blocks, consisting of two elementary schools, one middle school, and one high school. Public facilities such as community centers were assigned to four additional blocks. The base model follows a planning principle in which commercial, business, public, and educational facilities are centrally located within the neighborhood. Surrounding these core areas, parks and green spaces are strategically placed to enhance accessibility and livability. Residential zones are differentiated by density—high-density housing is positioned closest to the center and adjacent to commercial and business facilities, medium-density housing occupies the intermediate areas, and low- density housing is allocated to the periphery of the neighborhood.
Scenario development and typology of neighborhood spatial planning models
To facilitate a comparative analysis of carbon emissions across different neighborhood planning strategies, a set of alternative scenarios was developed. These scenarios are derived from the base model and are distinguished by quantifiable variations in key spatial planning elements. Specifically, three planning dimensions—identified earlier in the study—serve as the basis for model differentiation: (1) land use strategies emphasizing compact and mixed-use development, (2) transportation strategies aimed at minimizing intra-neighborhood travel distances, and (3) the expansion of green and open spaces to enhance carbon absorption capacity.
By combining different levels of change across these three elements, five distinct planning scenarios were created. Each scenario reflects a unique configuration of spatial relationships and planning characteristics, as presented in Table 4. The methods used to classify each planning element are as follows. First, compact and mixed-use development is evaluated based on net density levels within each model; higher net densities indicate a stronger application of this planning element. Second, minimized travel distances are assessed by calculating the total distance traveled from residential zones to destinations such as commercial areas, workplaces, schools, and public facilities, based on population distribution; shorter aggregate distances correspond to a higher performance level. Third, the expansion of green and open spaces is measured by the total area of parks and open space within the neighborhood; larger areas indicate stronger implementation of this element.
Table 4.
Spatial planning scenarios incorporating carbon-neutral strategies
Development of spatial planning models based on carbon-neutral scenarios
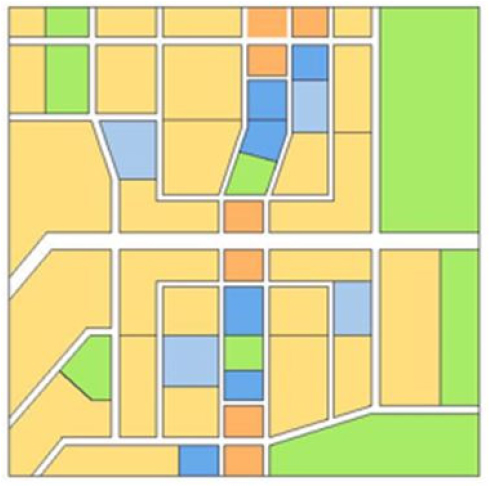
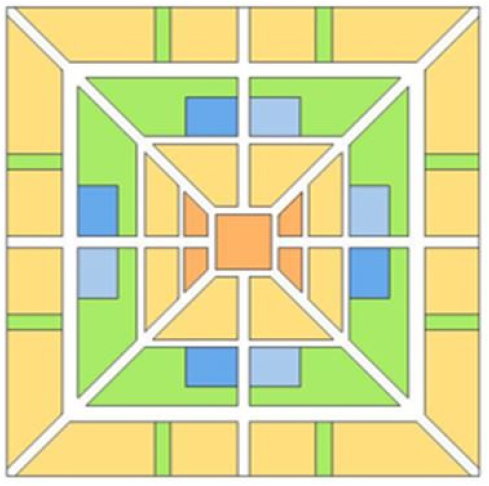
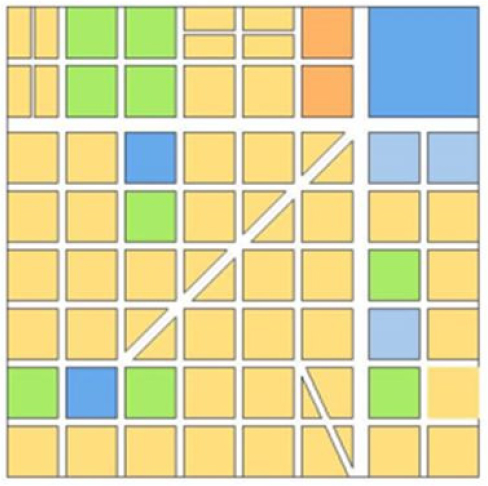
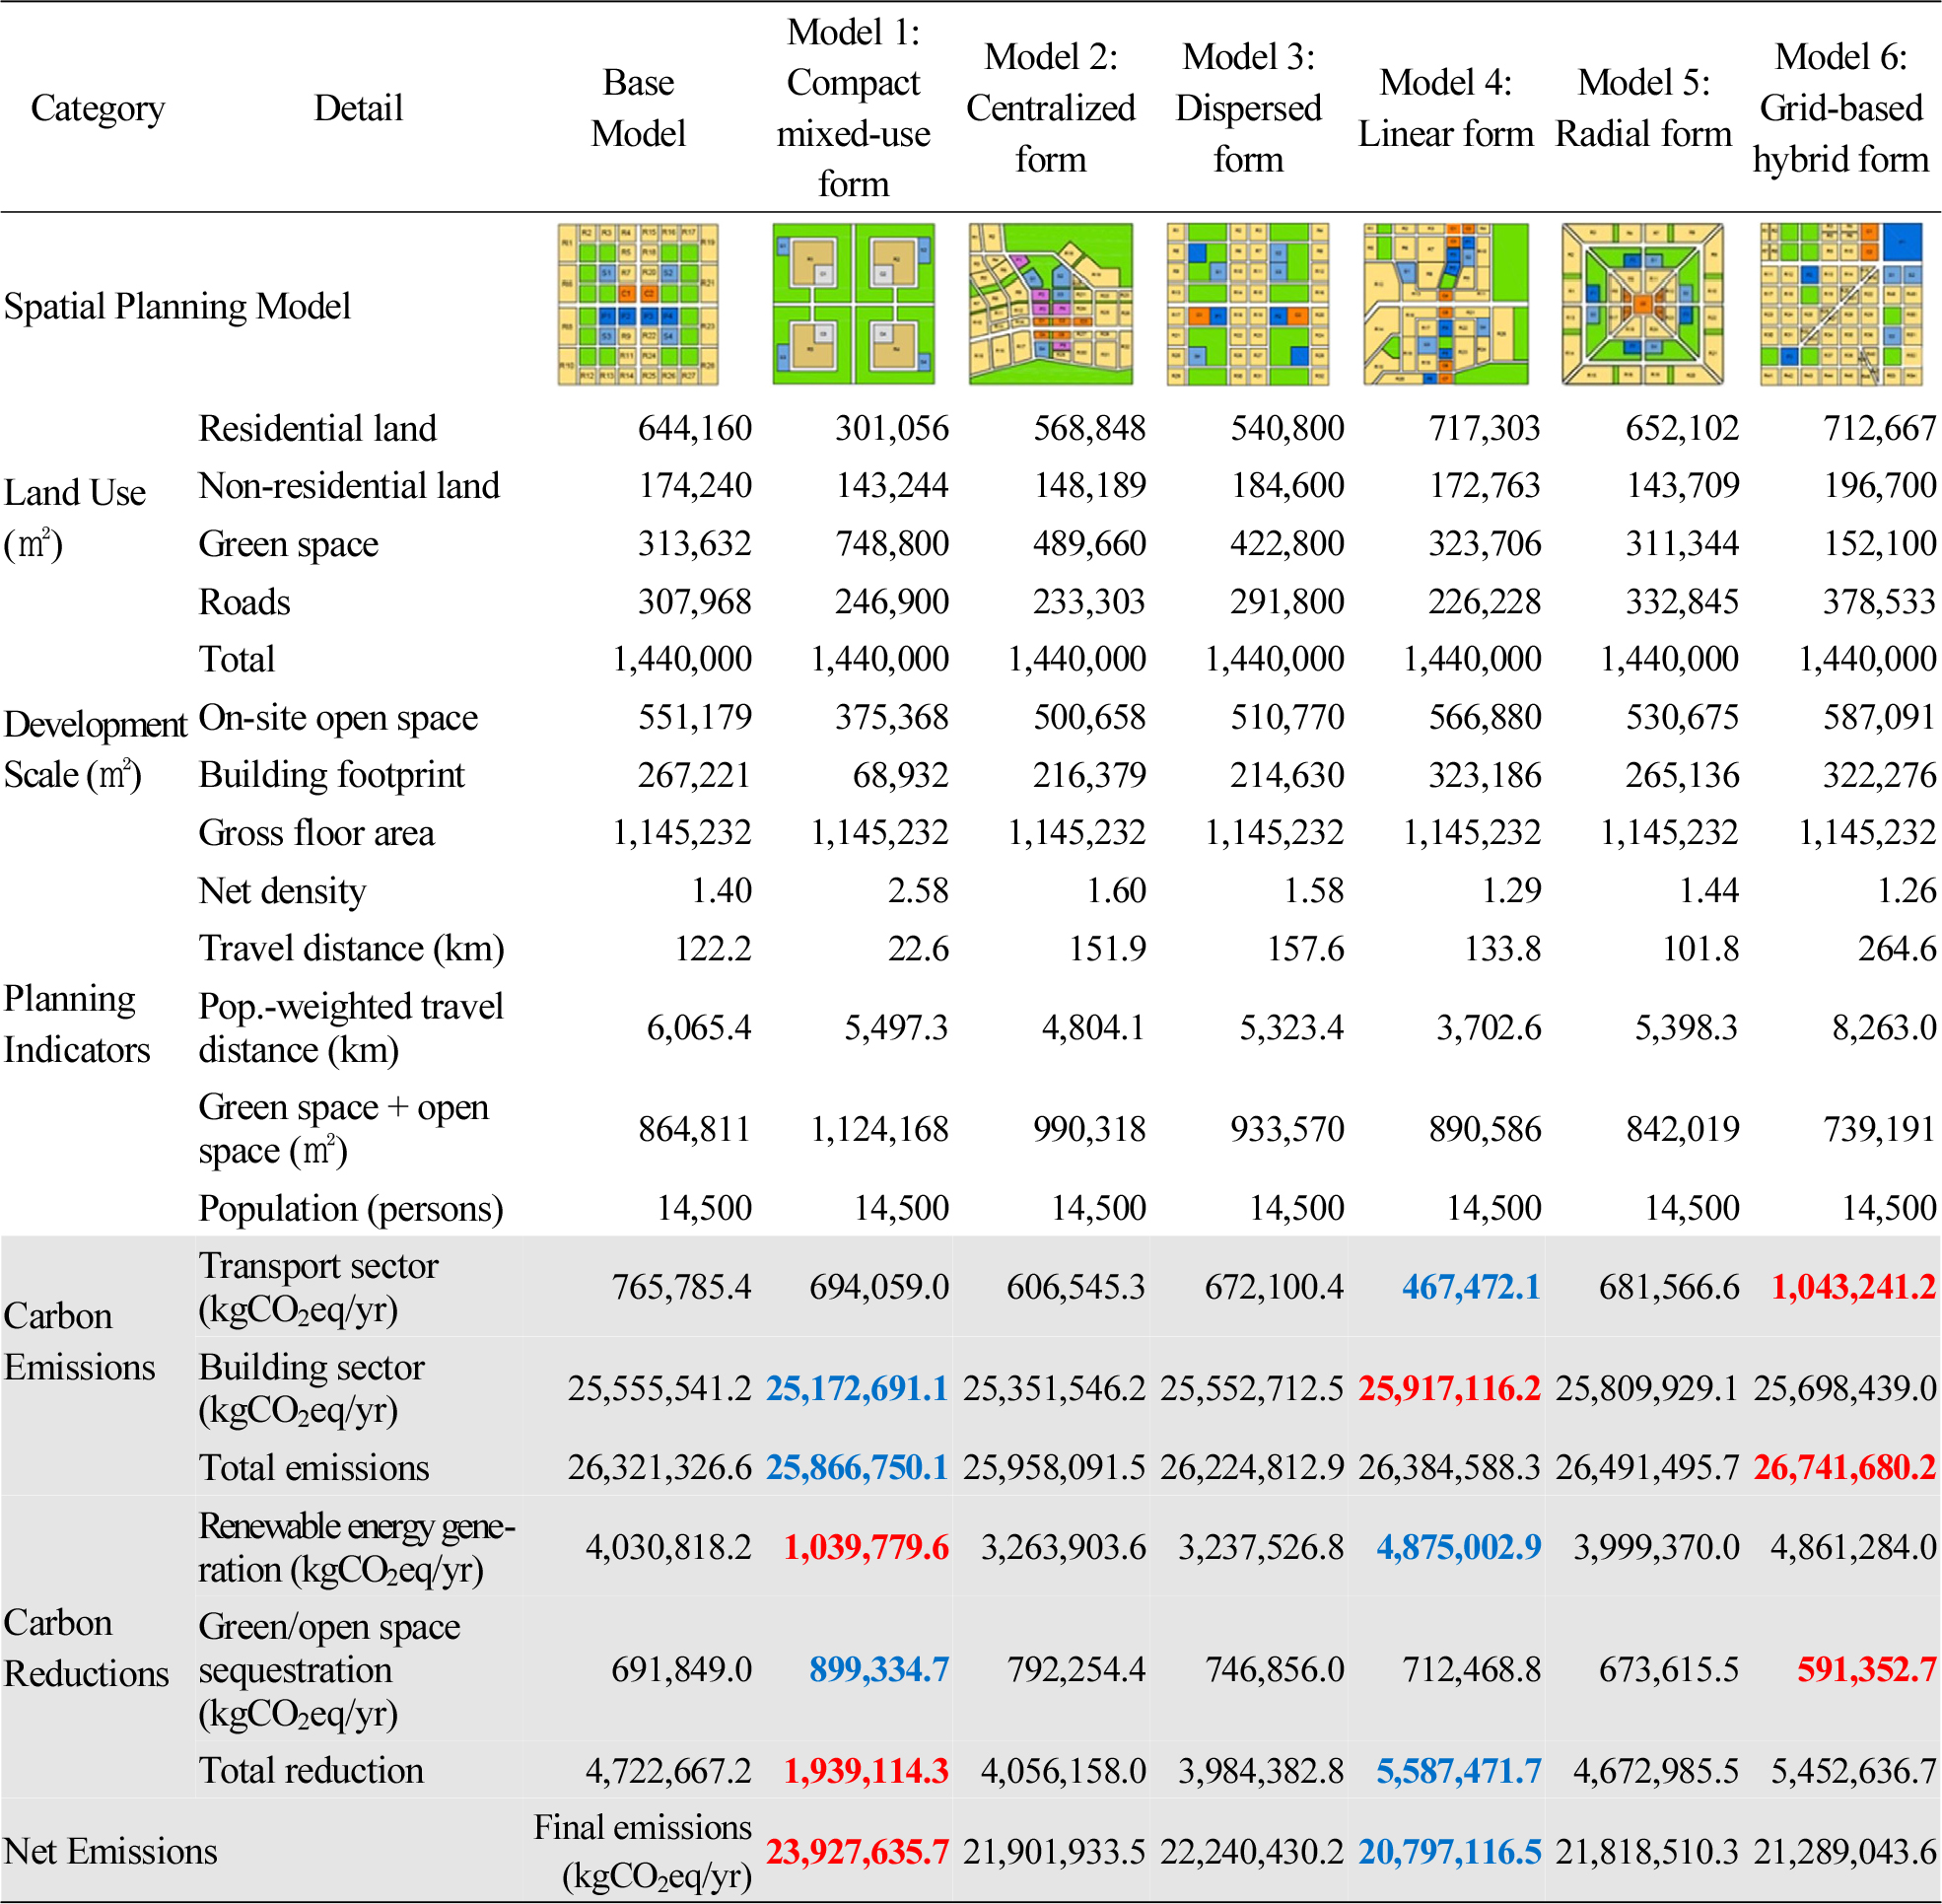
Building on the spatial planning scenarios, six alternative neighborhood-scale models were developed, referencing morphological patterns from both domestic and international precedents. As presented in Table 5, to represent a diverse range of urban forms, the models incorporate conceptual structures such as compact mixed-use, centralized, dispersed, linear, radial, and grid-based hybrid forms. The planning models were created using street network systems typically found in neighborhood units of major cities in Korea and other representative countries.
The characteristics of land use and planning elements for each model—including the base model—are summarized as follows. Model 1, which represents a compact city form, shows the smallest areas for most land uses aside from green space. Model 4, characterized by a linear and functionally dispersed layout, features the largest share of residential land. Model 6, a grid-based hybrid, has notably larger areas dedicated to non-residential uses and on-site open spaces within building plots.
Quantification of carbon-neutral planning elements
Net density
Net density is used in this study as a key planning indicator associated with compact and mixed-use development. It serves as a metric to describe the degree of urban compactness, which is central to carbon-neutral spatial planning. The formula used to calculate net density is as follows. FAR means total floor area of all buildings and Area means land area designated for residential, commercial/business, educational, and public facility use.
Travel distance
The neighborhood unit is defined as 1.2 km × 1.2 km, a size that accommodates a 600-meter radius circle. As previously noted, the maximum desirable walking distance within the neighborhood is set at 600 meters. This assumption informs the spatial extent of the neighborhood unit and serves as a planning reference for evaluating accessibility in carbon-neutral design.
However, this assumes a circular radius of 600 meters from the neighborhood center, which does not reflect the actual walking paths taken by residents. Euclidean distance, or the straight-line distance, may apply only in cases where pedestrians can traverse open spaces—such as parks or green areas—without obstruction. In most cases, however, walking occurs along the street network. Therefore, actual travel distances are more accurately represented by the Manhattan distance, which follows the geometric path constrained by the street grid.
Based on this network-based approach, the optimal route is identified, and whether to walk or bicycle—or to use a private vehicle or bus—is determined accordingly. The threshold for travel mode selection is defined by whether the Euclidean or Manhattan distance to a destination is below or above 600 meters. If open spaces allow direct access, Euclidean distance applies; otherwise, Manhattan distance is used, and decisions are made based on the shortest viable network path. represents the formula for Euclidean distance, while represents the formula for Manhattan distance.
Table 5.
Spatial planning models by scenario
Quantitative Analysis Results
The analysis of net density shows that Model 1 (compact mixed-use type) had the highest value at 2.58, while Model 6 (grid-based hybrid) recorded the lowest at 1.26, as presented in Table 6. The models ranked in the following order: Model 1 (2.58) → Model 2 (1.60) → Model 3 (1.58) → Model 5 (1.44) → Base Model (1.40) → Model 4 (1.29) → Model 6 (1.26). In terms of travel distance, measured as the total distance traveled by the neighborhood population, Model 6 recorded the longest distance at 8,263.0 km, whereas Model 4 had the shortest at 3,702.6 km. The order of travel distances is as follows: Model 6 (8,263.0) → Base Model (6,065.4) → Model 1 (5,497.3) → Model 5 (5,398.3) → Model 3 (5,323.4) → Model 2 (4,804.1) → Model 4 (3,702.6). These results suggest a notable correlation between net density, total travel distance, and population-weighted travel distance. Regarding green and open space, Model 1, which combines a relatively low building footprint with a large allocation of parkland, secured the largest combined area. Conversely, Model 6, despite having large amounts of both green space and built area, showed the smallest combined area of parks and on-site open space. This is primarily due to Model 6 allocating the least amount of land specifically for designated parks and green areas.
Table 6.
Quantitative land use and carbon-neutral elements by model
Result and discussions
Assumptions and coefficients for carbon emission estimation
To estimate carbon emissions from the hypothetical spatial planning models, it is necessary to define key assumptions, calculation methods, and relevant coefficients. These components include transport mode share, population movement by trip purpose, fuel consumption by vehicle type, and building energy use. The required inputs for emission estimation—both assumptions and coefficients—were established through the following procedures.
Walking/Bicycling vs. Private Car/Bus
In neighborhood units or local living zones, the design of blocks and street networks plays a critical role in supporting walkability. This study aims to promote spatial forms that encourage walking and bicycling within neighborhoods as a core strategy for carbon-neutral urban planning, thereby reducing reliance on fossil fuel-based transport modes such as private cars and buses. Accordingly, for the purpose of estimating carbon emissions from intra-neighborhood travel, it is essential to distinguish between fossil fuel-based and non-motorized transport modes. Travel distances and routes for walking and bicycling must be separately calculated from those involving private vehicles and buses, as they result in fundamentally different carbon emission profiles within the road transport sector.
Modal share between private cars and buses among fossil fuel transport modes
In the previous section, criteria were established to differentiate between walking and bicycling—which do not rely on fossil fuels—and private cars and buses, which do. To estimate actual carbon emissions from the transportation sector within the neighborhood, it is necessary to determine the modal share of fossil fuel-based transport modes. According to the Annual Transport Performance Report published by the Ministry of Land, Infrastructure and Transport in Korea, the modal share for fossil fuel-based transport modes is distributed as follows: 68% for private cars and 32% for buses. Based on these statistics, this study applies the same proportions to calculate emissions from road transport within the neighborhood.
Trip distribution by purpose: commuting/shopping vs. school trips vs. public services
In estimating travel related to trip purpose, several additional assumptions must be considered. Specifically, the total volume of movement must be disaggregated into the following categories: ① Trips to commercial and business areas for commuting and shopping, ② Trips to schools for educational purposes, and ③ Trips to public facilities for the use of public services. Because the distribution of trip purposes is highly dependent on land use configurations and resident behavior patterns within each neighborhood, it is not advisable to apply fixed national statistics to the model. Instead, the model is designed to allow for the input of customized trip distribution ratios, once actual neighborhood-level data become available during the planning or implementation phase. For the purpose of estimating carbon emissions in the base model, this study assumes the following distribution: ① 50% of trips for commuting and shopping, ② 25% for school-related trips, and ③ 25% for public service- related trips.
Fuel distribution for private cars and buses
The final assumption required to estimate carbon emissions for the base neighborhood model involves the distribution of fossil fuel types used in transportation. Currently, the major fossil fuels used in transport include: ① gasoline, ② diesel, ③ liquefied petroleum gas (LPG), and ④ natural gas (either LNG or CNG). In this study, private vehicles are assumed to use gasoline, diesel, or LPG, while buses are assumed to use diesel only. If other fuel types are to be considered in future applications, the emission calculation formula can be modified accordingly to incorporate additional fuel categories. The fuel mix ratio is determined based on vehicle registration statistics by fuel type, as reported by the Ministry of Land, Infrastructure and Transport as of August 2021.
Fuel consumption by transportation mode
Fuel consumption levels for private vehicles and buses—designated as fossil fuel-based transport modes within the neighborhood—must also be specified. These values are determined based on certified fuel efficiency data, differentiated by fuel type and vehicle category, to ensure rational and realistic emission estimates.
Population allocation by block within the neighborhood
Population distribution across residential areas must be established, as travel distances within the neighborhood are proportionate to the number of residents in each block. Because total emissions are calculated based on the aggregate distance traveled by the entire population, differences in population by block effectively serve as weighting factors in the model. These block-level weights are derived by applying a commonly accepted urban planning principle: higher population densities near the urban core and lower densities toward the periphery. This is operationalized by calculating each block’s share of the total floor area, based on its development intensity relative to the neighborhood’s overall gross floor area.
Energy consumption by building use
Carbon emissions from buildings are estimated based on energy consumption by building type. In the neighborhood model, building types are categorized as residential, commercial/business, educational, and public administrative facilities. Energy consumption data for each building type were obtained from the Korea Statistical Information Service (KOSIS), which provides annual statistics on building energy use. These data are classified according to building use categories defined by the Building Act. Specifically, energy use for residential buildings is based on combined data for multi-family and single-family housing; commercial and business uses correspond to Type 1 neighborhood living facilities; schools fall under educational and research facilities; and public administrative buildings are classified as office facilities.
Renewable energy production in the building sector
To enhance the feasibility of carbon-neutral neighborhood spatial planning, the integration of renewable energy production in the building sector is considered a key mitigation strategy. Solar energy, already widely adopted, is expected to play an increasingly important role as Korea’s Zero Energy Building (ZEB) mandate expands to cover both public and private construction sectors in the coming years. In this study, renewable energy production from buildings assumes the installation of rooftop photovoltaic (PV) systems. Estimating solar power generation requires setting several parameters, including the generation capacity of the PV panels, the usable rooftop area, the availability of solar radiation (sunlight exposure ratio), average daily generation hours, and the net system efficiency.
Carbon emission calculation formulas
Basic calculation formula
To estimate carbon emissions for each neighborhood planning model—including the base model—it is necessary to establish a basic calculation formula. As outlined in the development of the neighborhood- level carbon inventory, emissions during the operational phase of a city can be broadly categorized into two primary sources: (1) emissions from fossil fuel consumption associated with transportation, and (2) emissions from energy use in buildings. In addition to these sources, the framework for neighborhood-scale carbon accounting also incorporates the carbon reduction potential from on-site renewable energy production in buildings, as well as the carbon sequestration effect of parks and green spaces. Together, these elements form the foundational structure for calculating total emissions within a neighborhood. The basic equation for carbon emission estimation is presented below. In this equation, represents carbon emissions from the transportation sector, while refers to emissions generated by energy use in the building sector. The term denotes the carbon reduction achieved through on-site renewable energy generation in buildings, and represents the amount of carbon sequestered by parks and green spaces.
Carbon emissions from the transportation sector
In this study, fossil fuel–based travel within the neighborhood is estimated based on trip purposes, which are defined according to land use categories. Commuting and shopping trips refer to movements from residential areas to commercial and business zones; school trips represent movements from residences to educational facilities; and public service trips refer to travel from homes to public facilities such as community centers and welfare centers. The calculation of total travel distance, incorporating the assumptions described earlier, follows a multi-step procedure outlined as follows: First, trips with distances of 600 meters or less—assumed to be made by walking or bicycling—are excluded from fossil fuel–related calculations based on the modal selection criteria. Second, the total remaining travel distance is divided according to the modal share between private vehicles and buses. Third, travel is allocated by trip purpose, distributing total distances according to the expected destinations for commuting, schooling, and public service use.
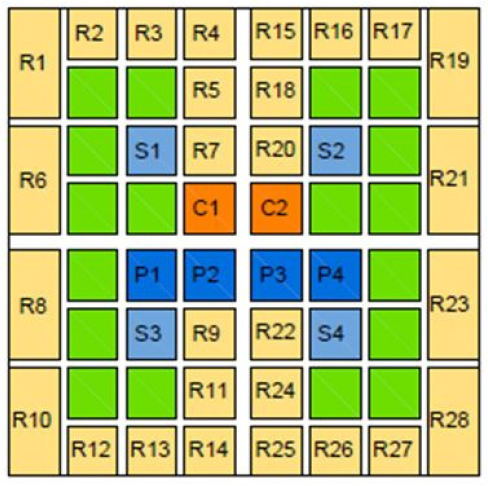
The total travel distance within the neighborhood is calculated as the sum of all purpose-based trips. The fundamental principle is to measure the shortest travel distance between each residential block and its corresponding destination by trip purpose. For elementary schools, which are provided in duplicate within the neighborhood, travel is assumed to occur toward the nearest school from each residential block. As an illustrative case, travel distances were measured between all residential blocks in the base model and the designated destination blocks for commercial/ business, elementary/middle/high schools, and public facilities. Where applicable, Euclidean distances were also presented—for example, in cases where open green spaces allow for diagonal, unobstructed paths. One such case was found where a distance originally exceeding 600 meters (R23↔S2) was shortened to below the threshold, thereby allowing for a switch to walking or bicycling. The longest travel distances between residential blocks and destinations were observed in R28↔S1 and R19↔S3, reaching 1,462 meters.
Based on the previously defined assumptions, the following equation is used to estimate carbon emissions from the transportation sector. First, total travel distance within the neighborhood is calculated. This total distance is then multiplied by the appropriate carbon emission factor to obtain transportation-related emissions. In the transportation emission calculation formula, the variables are defined as follows. represents the travel distance from residential area to destination , which includes commercial/business, school, and public facilities. denotes the visitation ratio for trip purpose , while indicates the population share of residential area , used as a weighting factor. The modal share of transport types is expressed through for private car use and for bus use. For private car emissions, fuel consumption per capita is combined with the fuel mix share and the emission factor by fuel type. Bus-related emissions are calculated using average fuel consumption per bus and the emission factor specific to bus fuels . The emission factors applied by fuel type are as follows: Gasoline (2.2 kgCO2eq/kWh), diesel (2.6 kgCO2eq/ kWh), LPG (3.7 kgCO2eq/kWh).
Carbon emissions from the building sector
The carbon emissions from the building sector are calculated by multiplying the total floor area by building type with the corresponding energy consumption, and then applying the emission factor for electricity. The energy use data, provided by the Korea Statistical Information Service (KOSIS), are reported in tons of oil equivalent (TOE). For the purpose of this study, these values are converted into kilowatt-hours (kWh) to estimate emissions from electricity consumption more accurately. In this study, carbon emissions from the building sector are calculated based on the floor area and energy consumption by building type, applying a uniform electricity emission factor of 0.459 kgCO2eq/kWh. Specifically, the variables include the floor area and energy consumption of multi-family residential buildings, and the floor area and energy consumption of single-family residential buildings. For non-residential uses, the model incorporates the floor area and energy consumption of commercial and business facilities, the floor area and energy consumption of educational facilities, and the floor area and energy consumption of public administrative buildings. These values are multiplied and summed across all building types to derive the total emissions associated with electricity use in the neighborhood.
Carbon reduction from renewable energy generation in buildings
In addition to emissions from the building sector, the amount of carbon reduced through renewable energy generation is a key component of emission estimation in the spatial planning models. The calculation focuses solely on solar energy and is based on annual generation potential. Key parameters include the proportion of rooftop area available for installation, solar access ratio, average daily sunlight hours, net energy conversion efficiency, and building coverage area, which is determined by the spatial configuration of the model. The amount of carbon reduction from renewable energy in the building sector is estimated based on solar photovoltaic generation and calculated on an annual basis. The calculation incorporates several key variables: the installed generation capacity of the solar panels , the proportion of rooftop area available for installation , the solar access ratio indicating the extent of unobstructed sunlight, the average number of effective sunlight hours per day , and the net generation efficiency of the system . These are multiplied by the total building coverage area and the electricity emission factor , set at 0.459 kgCO2eq/kWh. The result is then scaled to an annual figure by multiplying by 365 days.
Carbon sequestration from green spaces
The amount of carbon sequestration in the green and open space sector is calculated by incorporating both designated park and green areas, as well as the on-site open space areas within building plots—excluding the building footprint. This approach reflects a land use–based estimation method that accounts for all vegetated or permeable surfaces capable of contributing to carbon absorption within the neighborhood. In this formula, represents the annual amount of carbon sequestered through green and open spaces within the neighborhood. The variable denotes the total area designated as public parks and green space, while refers to open space within building lots, excluding building footprints. The sequestration potential is calculated using the coefficient , which indicates the carbon absorption capacity of vegetated land, set at 0.8 kgCO2eq per square meter per year, based on data from the Korea Forest Service and the Ministry of Environment.
Carbon emission estimation results
Total carbon emissions estimation results
The carbon emissions and sequestration levels for the base neighborhood model and the six typified models were calculated based on the defined assumptions and equations, as summarized in Table 7. When considering both emissions and absorption, the total net emissions were found to be highest in Model 1 (compact mixed-use type) and lowest in Model 4 (linear type). In the case of Model 1, building-related emissions were among the lowest; however, the substantial reduction in emissions due to on-site renewable energy production led to a relatively high net total. Conversely, Model 4 exhibited the highest building-sector emissions, but this was offset by a greater reduction from solar energy generation, resulting in the lowest net emissions among all models.
Transportation sector carbon emissions results
The carbon emissions from the transportation sector were estimated using two approaches. The first, aligned with the baseline methodology, excludes trips under 600 meters on the assumption that such short distances are covered by non-motorized modes (e.g., walking or cycling). The second includes the entire travel distance regardless of trip length. Both results are presented for comparison.
Under the baseline approach (excluding trips under 600 meters), Model 4 (lineal type) showed the lowest transportation emissions, while Model 6 (hybrid type) showed the highest. This outcome suggests that the evenly distributed urban functions in the linear model support improved accessibility and shorter travel distances. In contrast, the high emissions in Model 6 can be attributed to its layout, in which key functions are concentrated near the periphery of the neighborhood, resulting in longer intra-neighborhood travel and increased fossil fuel use. To assess walkability across models, the proportion of total travel distance occurring within 600 meters—assumed to be completed by walking or bicycling—was calculated for each neighborhood model. Model 4 (linear type) recorded the highest share at 42.6%, indicating a strong pedestrian orientation, while Model 6 (hybrid type) had the lowest at 19.1%. When these results are compared with transportation-related carbon emissions, the base model ranks higher in walkability than in emissions, while Models 5 and 1 rank lower in walkability relative to their emissions performance.
An additional analysis was conducted to examine carbon emissions by trip purpose and building type. For trips to commercial and business facilities, Model 1 (compact mixed-use type) yielded no horizontal travel distance due to its high degree of functional integration between residential and commercial uses. In contrast, Model 6 (hybrid type) generated the highest emissions due to greater separation between functions. Similarly, emissions associated with travel to educational facilities (e.g., elementary schools) and public administrative buildings (e.g., community centers) were determined by the distance resulting from functional distribution—whether integrated or located at the neighborhood periphery. Overall, Model 4 (linear type) exhibited the lowest carbon emissions across all trip purposes, while Model 6 (hybrid type) showed the highest.
Building sector carbon emissions results
In terms of emissions from building energy use, Model 1 (compact mixed-use type) exhibited the lowest levels, while Model 4 (linear type) showed the highest. This outcome reflects the relationship between building type and energy demand, whereby reducing the share of building types with higher energy intensity can effectively lower overall carbon emissions, even when the total floor area remains constant. For example, Model 1 includes a higher proportion of multi-family housing, which is associated with relatively low energy consumption per unit area. At the same time, it minimizes the floor area allocated to single-family housing and commercial/business functions—both of which are typically more energy- intensive. As a result, the building-sector emissions in Model 1 are the lowest among all configurations.
Carbon reduction through renewable energy generation in buildings
This study incorporates two spatially controllable carbon mitigation mechanisms within the neighborhood model: carbon sequestration through parks and green spaces, and emission reduction via rooftop solar photovoltaic (PV) systems that offset electricity consumption. Since renewable energy production from buildings is directly proportional to the available rooftop area, models with a higher proportion of low-density housing—characterized by larger building footprints—are structurally more favorable for solar installation. Accordingly, Model 4 (linear type) showed the highest level of carbon reduction from rooftop PV systems, while Model 1 (compact mixed-use type) exhibited the lowest. In the context of neighborhood-scale planning, renewable energy–driven carbon mitigation strategies should be pursued as supplementary measures, aimed at further reducing net emissions beyond what can be achieved through transportation and building energy efficiency alone. When carbon neutrality targets become more stringent, spatial configurations that support such strategies—such as a shift from vertically oriented, high-rise buildings with low coverage ratios to horizontally distributed, low-rise buildings with higher coverage—may become necessary from both an energy and urban design perspective.
Carbon sequestration through green spaces
Although carbon sequestration through parks and green spaces is the only feasible absorption mechanism within neighborhood-scale spatial planning, its capacity remains relatively limited. Nevertheless, such green areas are essential to ensuring a livable and comfortable urban environment. Therefore, the securement and appropriate distribution of green space must be integrated into carbon-neutral neighborhood planning frameworks. Carbon sequestration is proportional to the total area of public green spaces and on-site open spaces within building lots. As a result, compact, high-density developments with lower building coverage ratios are more favorable for increasing green space availability. The analysis showed that Model 1 (compact mixed-use type) exhibited the highest level of carbon sequestration, while Model 6 (hybrid type), which had the smallest area of vegetated land, showed the lowest. From a spatial design perspective, the area of on-site open space is influenced by both the building coverage and the overall plot size. In general, larger lot sizes tend to reduce the share of land available for public green space. Accordingly, neighborhood planning must carefully consider these interrelated factors when aiming to balance development intensity with environmental sustainability.
Discussions
Emission share by sector
Within the neighborhood-scale carbon inventory, emissions from the building sector account for the largest share by a considerable margin. This is followed by emission reductions achieved through on-site renewable energy generation in buildings. Carbon sequestration from parks and open spaces and emissions from the transportation sector contribute a relatively similar and comparatively minor portion. Given that neighborhoods are primarily residential spaces—with public facilities and commercial services playing a supporting role—the emission profile at this scale is structurally different from that of the national inventory. While the transportation sector represents approximately 13.7% of total emissions at the national level, its contribution within neighborhood-scale models is minimal due to the limited scope of travel and modal diversity. As such, the neighborhood carbon inventory can be characterized by a relatively simplified structure dominated by building-related emissions.
Site selection based on density
Even within a single neighborhood unit, residential density is typically differentiated: higher-density housing is generally concentrated near the center or core areas, while lower-density forms such as single-family homes are located toward the periphery. If high-population residential areas are spatially distant from key destinations, the resulting increase in travel distances can lead to significantly higher transportation-related emissions. This highlights the critical role of both travel distance and trip volume by purpose in determining transportation emissions. Accordingly, concentrating population density in areas with shorter access distances—and aligning land uses to minimize the need for long-distance travel—should be a core strategy in low-carbon neighborhood planning.
Low-energy-intensity building types
Building energy consumption within neighborhoods varies significantly depending on how different use types are distributed. In particular, residential buildings account for the majority of energy use. Among residential types, multi-family housing tends to have lower energy consumption per unit area compared to single-family housing. Therefore, when energy reduction is a key objective, careful consideration should be given to the allocation of building use types to favor more energy-efficient forms.
Carbon neutrality strategies through on-site renewable energy in buildings
Among renewable energy options in the building sector, solar photovoltaic (PV) systems increase in potential as the building footprint expands. This implies that pursuing carbon neutrality through sufficient rooftop solar production may not be compatible with purely compact, high-density development. Instead, a strategic balance with low-rise, European- style urban forms that offer larger building coverage areas may be more effective in enhancing energy autonomy and achieving climate targets.
Neighborhood environmental planning through securing carbon sinks
As discussed earlier in the section on carbon sequestration through green spaces, an increase in designated park and green areas often reduces the space available for buildings, which in turn limits on-site open space. However, this reduction can be offset by promoting compact development with lower building coverage ratios, which helps preserve more open space within building plots. This design approach should be actively considered as a strategy for securing carbon sinks within the neighborhood environment. The synthesized results of the preceding analyses are presented in Table 8.
Table 8.
Planning directions for carbon neutrality in neighborhoods
Conclusions
This study aims to propose a spatial planning framework for achieving carbon neutrality at the neighborhood scale—a key planning and development unit closely tied to human habitation—complementing existing strategies at the national, regional, and building levels.
The main findings of the study are as follows. First, a carbon emission inventory specific to neighborhood units was established, and key spatial planning elements for carbon neutrality were identified. Through a combination of literature review and case analysis, a comprehensive pool of planning elements was developed. This led to the categorization of carbon-neutral spatial strategies across five domains: spatial structure and land use, transportation, green space, buildings, and energy planning. Second, a set of alternative planning models was developed to compare carbon emissions resulting from different neighborhood spatial configurations. Scenario-based modeling was employed using the previously developed base model as a reference point. The scenarios incorporated quantitative changes in spatial planning variables and reflected the following core strategies: (1) compact and mixed-use land development to promote efficient spatial structure, (2) minimization of travel distances within the neighborhood to reduce transportation- related emissions, and (3) expansion of green areas to secure local carbon sinks. By combining these elements in different configurations, spatial planning scenarios were formulated and used to construct a set of typified neighborhood models.
This study employed a simulation-based methodology involving the development of hypothetical neighborhood models and the application of spatial planning scenarios and assumptions to explore carbon-neutral planning strategies. While this approach enabled systematic analysis, it also introduced several limitations. First, the use of virtual spatial models means that the results for carbon emissions and sequestration are inherently sensitive to the assumptions, conditions, and coefficients applied. Variations in these parameters could significantly affect the outcomes. Second, by restricting the analysis to emissions occurring strictly within the neighborhood boundary, certain transport- related emissions—such as those associated with regional rail systems or arterial roads used for through-traffic—were excluded. As a result, transportation-sector emissions in the neighborhood models appear lower than those typically reflected in national or regional carbon inventories.
Several future research directions have emerged from the course of this study. First, there is a need to develop carbon-neutral spatial planning models that can be applied at broader spatial scales. Expanding the modeling framework to include regional transport systems and through-traffic—elements excluded from this study—would improve the overall applicability and policy relevance of carbon-neutral strategies. Second, further research focused specifically on achieving carbon neutrality in the building sector is critically important. Within neighborhood-scale spaces, building-related emissions constitute the vast majority of total emissions, underscoring their centrality as a reduction target. Moreover, in dense urban areas where human activities and built functions are concentrated, strategies such as energy self-sufficiency in buildings become even more essential. In-depth investigations into building-sector decarbonization are therefore a high priority. Lastly, future studies should incorporate empirical data to strengthen the validity of carbon- neutral spatial planning research. One of the key limitations of this study is its reliance on hypothetical spatial models. Building on the inventory structure and emission estimation methods developed here, future research should aim to apply these methods using measurable, real-world urban data to produce more actionable and context-specific insights.
