

Introduction
Methodology
The design of Taguchi’s plan
Artificial neural networks completion
Result and Discussions
Analysis of variance (ANOVA)
Conclusions
Introduction
Expansive soils are one of the most costly and globally widespread geological hazards. In Algeria, as in many parts in the world, engineering problems due to soil swelling have been reported. Soil swelling depends on the type and quantity of clay minerals, generally of the Montmorillonite group, the water content, and surcharges weight [1, 2, 3]. Soil swelling is especially noted in regions with arid and semi-arid climates; the soil undergoes high volumetric deformations due to the variation of the moisture content, which poses problems in the geotechnical and civil engineering fields [4, 5, 6, 7]. Bases constructed on these types of soil are exposed to the high pressures caused by the swelling of these soils. These pressures cause damage in the form of fractures and fissures in the building foundations or floor components [8, 9]. The most obvious identifications on damage to buildings are doors and windows that get jammed, uneven floors, and cracked foundations, floor, masonry walls and ceilings. Moreover different crack patterns mean different causes for different foundation materials. In most cases, cracks due to expansive clay usually run from corner to wards adjacent opening and are uniform in width or v-shaped, wider at the top the foundation wall [10]. Therefore, these soils present significant geotechnical and structural challenges to anyone wishing to build on or in them. In this context, it is important to predict soils prone to swelling prior to construction to reduce costly damages and ensure the durability of different constructions.
According to several researchers [4, 11, 12], the estimation of soil swelling is determined by two main parameters: the swelling potential and the swelling pressure. These parameters are identified either by direct measurements in the laboratory using the Odometer, where such tests are costly in time and money, or by indirect measures which involve the use of soil properties and classification [2, 3, 7, 13]. Indirect methods are simple, rapid, and inexpensive compared to the experimental tests, but the prediction models established up to now by these types of methods, are often not universal. They are valid only for the soil of the region where it has been studied [7, 13]. In addition, they involve several parameters and often complicated approaches that achieve a plethora of results that are not always easily interpretable.
Generally, the typical expansive soils can be easily identified from their high plasticity, excessive heave, and high swell-shrink potential which are made up of clay, shale or marl [14].
Many researchers have indicated that clay content (Cc) and plasticity index (Ip) have an influence on soil swelling. They also related these parameters with simple empirical correlations [4, 11, 12, 15, 16, 17], also these two parameters are simple and easy to determine. Consequently, these parameters were selected as input parameters in this study.
The Taguchi method is an easy and economic statistical tool which can be used in a robust design, as it requires the use of a minimal number of experimental tests to study many variables [18, 19, 20]. Taguchi’s robust design differs from a classical experimental design, through the idea of designing special standard tables (orthogonal arrays) that estimate a maximum number of main effects in an unbiased manner of a set of controllable (dynamic) anduncontrollable (noise) factors, on definite levels, and this with the least number of experiments [18, 21, 22, 23]. These types of arrays are balanced such that all factor levels are weighted. Therefore, it identifies the influence of the factors independently of all the others, and also the impact of one factor does not influence the estimation of the others, thus considerably reducing the time and cost demanded in experimental studies [24, 25]. Moreover, Taguchi’s method has other advantages, including the optimization of the design parameters, model prediction, determining optimal factor levels and reducing noise sensitivity using robust parameter design, evaluating the effect of factors independently on the result [19, 20, 22, 23, 24]. To date, the Taguchi method has been successfully applied in civil engineering, notably in the studies of slope stability [24], soil erosion [20, 26] and liquefaction of soil [27], but never for completing and estimating geotechnical parameters.
For this, a new approach, reliable, inexpensive, short time and with universal application is applied in this article to study this type of soil. This approach involves using a type of experiment design ‘the Taguchi method’ to examine the effects and interactions with determining the optimal levels of selected factors on swelling potential and swelling pressure.
This study borrows the use of the experimental design of Taguchi established by a database that was collected from the area of Western Algeria, which gives an evaluation of the investigated parameters (clay content, plasticity index, swelling potential and swelling pressure).
Each factor has three levels chosen according to the BRE classification [28], (see Table 1). The available data did not correspond to those required for theorthogonal array design Taguchi L9 selected for this study, because of the non-orthogonality of the table. Therefore, an artificial neural network was created with the available experimental database to calculate the swelling pressure and swelling potential for clay content and plasticity index to complete the orthogonal array design Taguchi L9. For the table to be orthogonal, it is necessary that between each pair of columns, the combination of variables appears an equal number of times [18]. However, it was impossible to set the values of the first parameter (clay content) in one level and fix the second parameter (the plasticity index) in one of the other levels or the opposite level in this case.
Table 1.
Swelling potential after the Building Research Establishment
| (%) | < 2 um (% ) | (%) |
| > 35 | > 95 | Very high |
| 22–30 | 60–95 | High |
| 18–22 | 30–60 | Moderate |
| < 18 | < 30 | Low |
Recently, ANN has been widely applied successfully in the engineering in general, according to the authors [29, 30, 31]. This method has been used in many studies, including the liquefaction of soil [27, 32], slope stability and earth retaining structures [33, 34], prediction of soil swelling pressure [35], design of tunnels [36] and settlement of structures [37, 38].
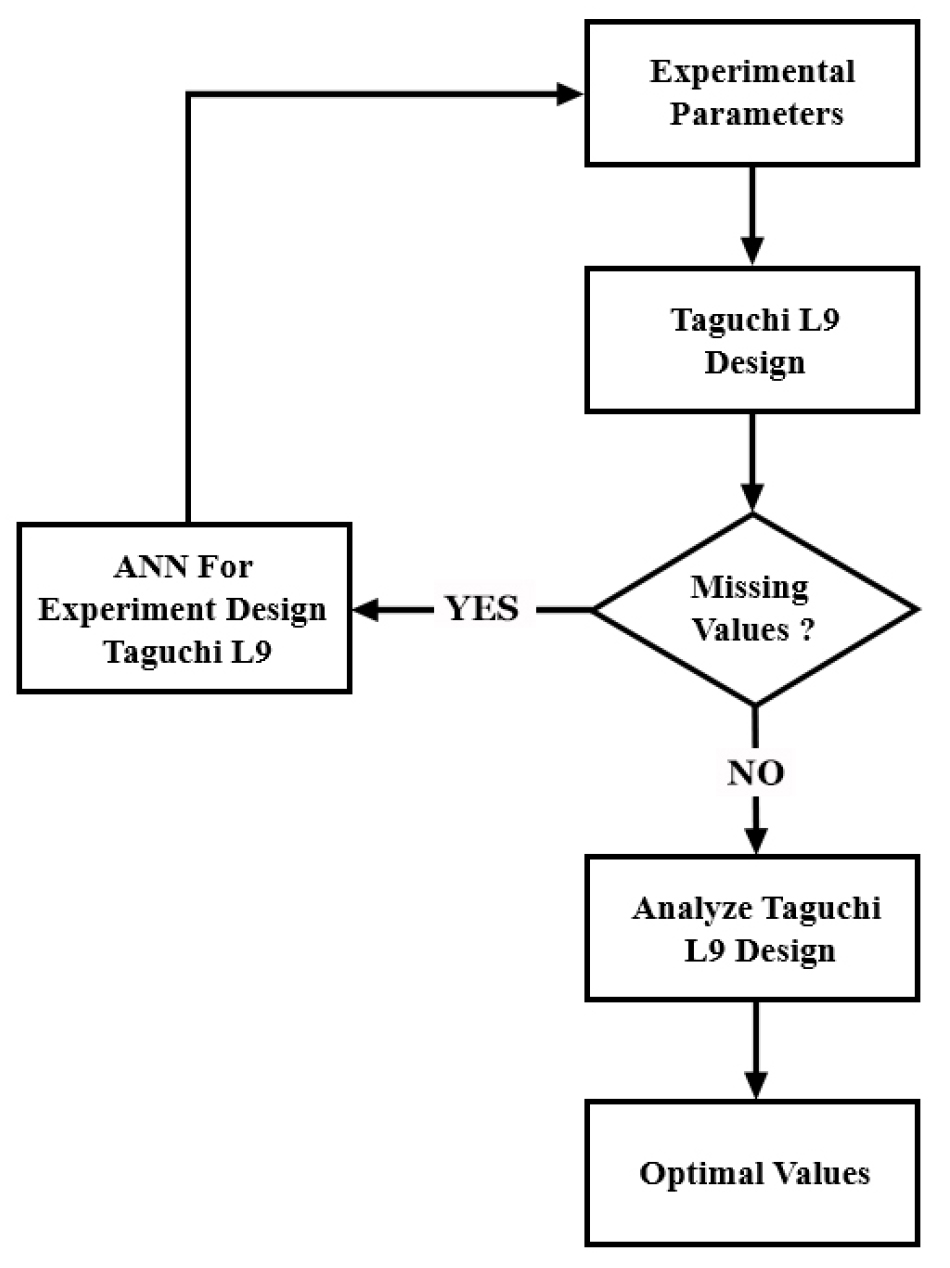
Finally, the orthogonal array design Taguchi L9 is completed and used to analyze and determine the different effects and interactions as well as the optimal conditions for the studied parameters. The structure of the suggested methodology is shown in Figure 1.
Methodology
First, an experimental database on soil swelling in the area of Western Algeria was collected [39, 40, 41, 42, 43, 44, 45, 46]. In each experiment, four parameters were determinate, in accordance with international ISO standards: the clay content Cc (NF P94-056, NF P94-057), the plasticity index Ip (NF P94-051), the swelling potential Sp (ASTM D 4546-90) and the swelling pressure Ps (XP P94 - 091).
The design of Taguchi’s plan
In this work, two three-level factors was selected, the clay content and the plasticity index as shown in Table 2: symbol 1, 2 and 3 indicate respectively low, moderate and high to a very high degree of swelling potential. The same levels of parameters were used for the estimation of the swelling pressure.
Table 2.
Factors and levels selected
| Factors | Levels | ||
| 1 | 2 | 3 | |
| : clay content (%) | 29 | 32 | 60 |
| : plasticity index (%) | 17.1 | 27.3 | 93.5 |
Estimating the swelling potential/pressure as a function of two factors and three levels using a complete classical experimental design would require 27 experiments (each (levels)factors=32 experiments with three repetitions for all combinations of parameters), whereas similar results can be obtained by the use of orthogonal plane Taguchi L9.
The use of orthogonal arrays in the Taguchi design ensures the equilibration of the experiments, where each factor is evaluated independently of the others. Table 3 shows the design of the Taguchi L9 plan, including the combinations of known variables, where the values of the swelling potential and the swelling pressure for two variables, the clay content and the plasticity index, are available at the database and that for the combinations (1,1); (2,2) and (3,3). A neural network was also created to calculate the responses to combinations of unknown variables, where the values of the swelling potential and the swelling pressure for two variables, the clay content and the plasticity index, were not available at the time in a database.
The Taguchi method requires the use of the Signal/Noise ratios (S/N) to estimate the influence of the factors on a response, such that the S/N ratio represents the measure of the mean square deviation to the ideal function. S/N ratios are calculated for three categories based on the objective of the problem: the higher-the-better (HTB), the nominal-the-better (NTB) and the lower-the-better (LTB) [20]. The most important in a study of soil swelling is to identify the optimal conditions in which soil swelling is maximal. Consequently, the higher-the-better analysis was used for this study. According to [47], the equation used to calculate the ratio (S/N) for the higher-the-better (HTB) is as below:
Where: y is the average of the observed data, n is the number of repetitions of trial i.
Moreover, the main effect plots are also used to determine which factors affect the response the most by examining the changes in the mean of each level, such that it defines the means of the responses of each factor level related by a line. There will be no main effect if this line is parallel to the X-axis; as each level of the factor affects the response in the same way. On the other hand, if the line is not horizontal, this shows the existence of the main effect and different levels of the factor affecting the response independently. In addition, the steeper the slope of the line the higher the value of the main effect [27].
Artificial neural networks completion
ANN has been developed for the modeling of complex problems for which the relationship between the model variables is unknown [30, 48]. Moreover, generalization, the universal approximation of functions, adaptation, parallel processing of data and robustness, are many other advantageous features of this technique that saves a lot of money and time [23, 49].
The ANN structure generally includes the number of hidden layers, the number of hidden nodes or neurons, the activation function (sigmoid, linear and tangent) and the number of output nodes. The neuron of the previous layer and the next layer are connected with adjustable weights (wi) so that each has a threshold value (baisi) that functions according to the input signal. This valueis added to the sum of the weights multiplied by the input of each processing element in the previous input layer, and the transfer function also processes this input to gives the output of the neuron [25, 35]. The Eq.(2) describes the weighted sum of the input components of each neuron where (j) indicates the number of neurons in the previous layer [25, 49].
For this study, 21 experiments were available for training the network, to predict the Sp and Ps values for the combinations levels unknown of the Cc and Ip in the Taguchi table. The complete set of data is divided into three subsets, 70% of the data set for training, 15% for validation, and 15% for testing. The training data set for the swelling potential values are presented in Table 4, and the training data set for the swelling pressure values are presented in Table 5. Furthermore, the inputs are processed from the beginning to the end of the network by a sigmoid transfer function in the hidden layer, and a linear transfer function in the output layer.
Table 4.
Training data set for the swelling potential
Table 5.
Training data set for the swelling pressure
The “back-propagation” learning algorithm was used for this study. This method essentially consists in adjusting the weights and the biases until the network stabilizes. In order to make the outputs very close to the target outputs of the network, iterative computations are completed which are updated to the mean squared error (MSE) between the calculated output and the desired targets with the transfer of the correction signal from the end of the network to its beginning [23].
Also, to evaluate the performance of the model ANN in this study, two statistical analyses involving the mean squared error (MSE) and the correlation coefficient R2 are used. The model estimate is more accurate when the mean squared error is very small, and the value of R2 is close to 1.
Result and Discussions
The ANN architecture selected for the prediction of the swelling potential is indicated in Figure 2. This final architecture was chosen after a few attempts. The network has only one hidden layer, and each hidden layer contains 12 neurons (2-12-1-1). The statistical values of the swelling potential obtained from the training, validation, and tests of the ANN model show the mean squared error (MSE) to be at a value of 6.67 10-09, and the correlation coefficient R2 is almost 1, between the calculated output and the desired targets of the learning set. These results indicate that a very good agreement between the production and the target has been achieved. Therefore, the model analysis gives good results in the validation and test set for the prediction of the swelling potential.
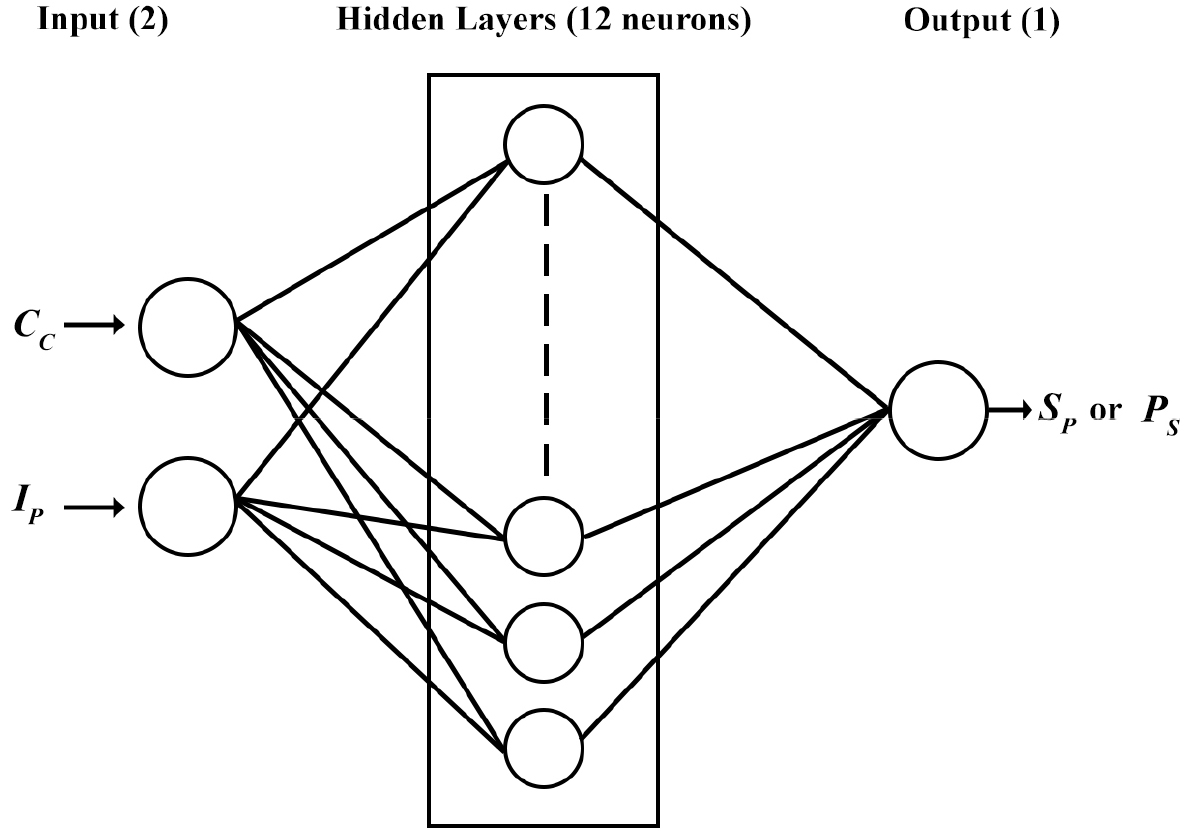
After a few attempts, the ANN analysis results for the prediction of the swelling pressure is shown that the selected architecture was (2-12-1-1), therefore, it is the same neural network architecture shown in Figure 2. The results of this task obtained from the training, validation and testing of this type of model indicate that a value of 1.82 10-10 of the mean squared error (MSE) and a correlation coefficient R2 is almost 1, between the calculated output and the desired targets of the training set, which means a good model for the prediction of swelling pressure. Table 6 shows the set of statistical values obtained by the proposed ANN model.
Table 6.
Results of Statistical values of ANN model
Finally, the unavailable data was calculated with this ANN modeling, and the Taguchi L9 plans were completed as shown in Table 7 and 8 respectively. These orthogonal arrays have been designated by the code L9, which are composed of 9 lines and 3 columns, such as presented above. Following this, an analysis of the Taguchi plans was executed to calculate the average ratios and S/N reports of each parameter (Sp and Ps). The results analysis is as follows:
Table 7.
Orthogonal array design Taguchi for the swelling potential
| 29 | 17.1 | 9.700 |
| 29 | 27.3 | 17.510 |
| 29 | 93.5 | 49.118 |
| 32 | 17.1 | 10.075 |
| 32 | 27.3 | 22.000 |
| 32 | 93.5 | 45.069 |
| 60 | 17.1 | 22.015 |
| 60 | 27.3 | 28.113 |
| 60 | 93.5 | 47.500 |
Table 8.
Orthogonal array design Taguchi for the swelling pressure
| 29 | 17.1 | 100.000 |
| 29 | 27.3 | 255.080 |
| 29 | 93.5 | 674.991 |
| 32 | 17.1 | 202.483 |
| 32 | 27.3 | 310.000 |
| 32 | 93.5 | 751.389 |
| 60 | 17.1 | 219.276 |
| 60 | 27.3 | 289.914 |
| 60 | 93.5 | 852.000 |
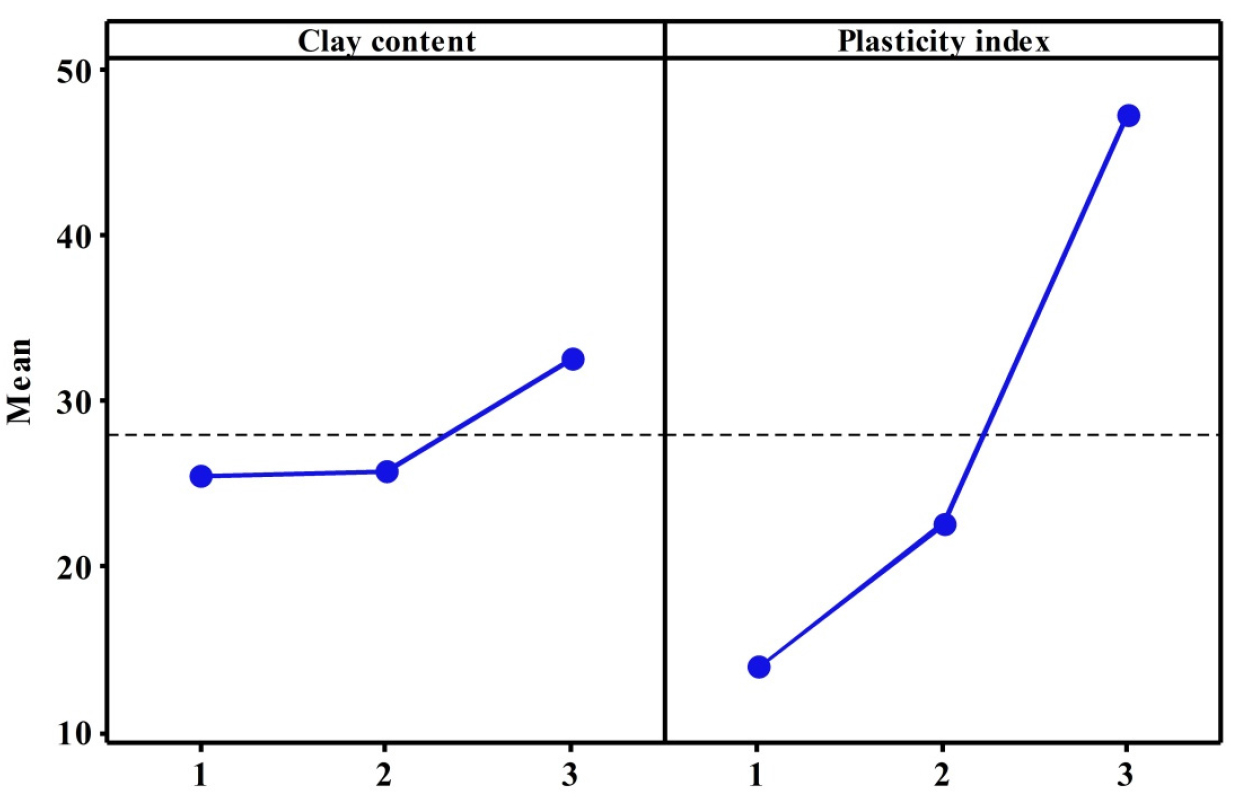
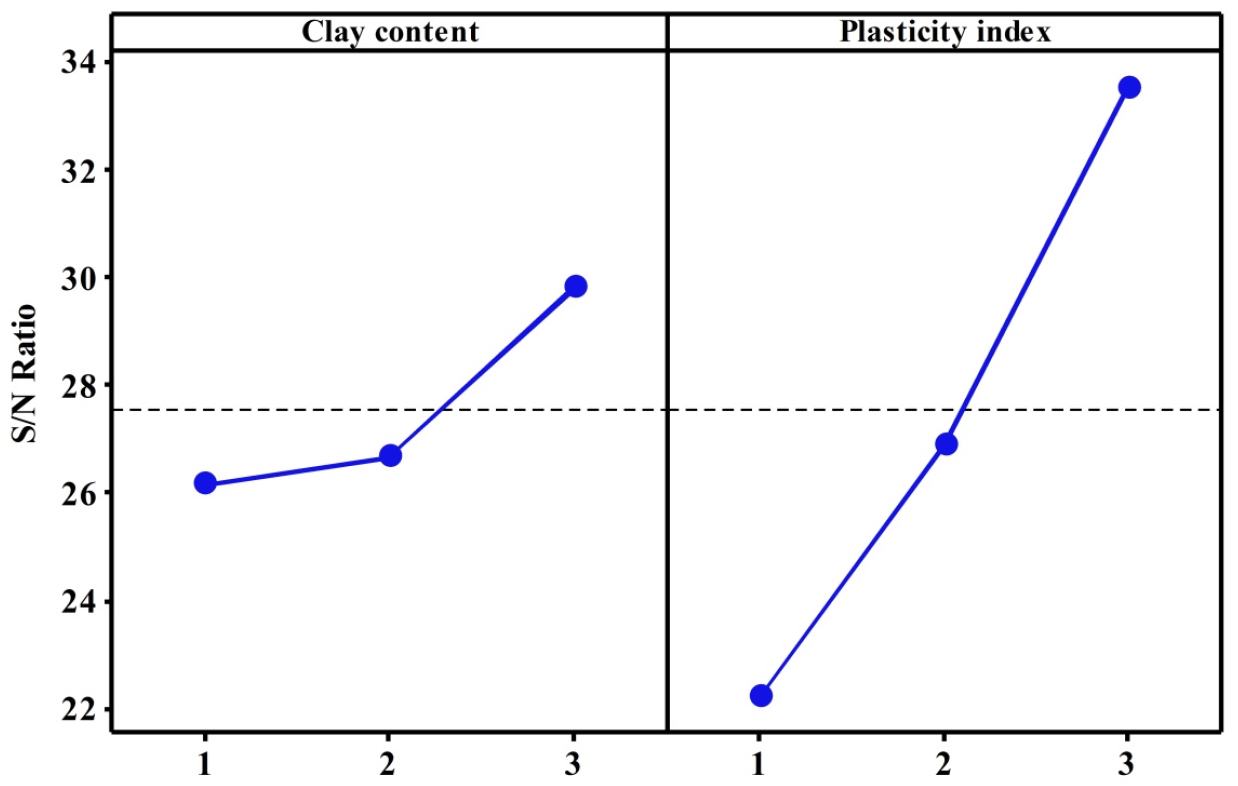
According to Figures 3 and 4, all parameters selected (Cc and Ip) affect theswelling potential. These results also showed that the swelling potential increases as the plasticity index and clay content increase, and that the plasticity index has the highest effect on the swelling potential followed by clay content. The highest levels (3,3) special to an effect on means and S/N ratios gave the excellent combination of levels, consequently, optimal swelling potential combination predicted for parameters examinedis the plasticity index Ip = 93.5%, and the clay content Cc = 60%. The greatest factor effect is noted for the plasticity index. These results can be confirmed in Table 7, where the greatest swelling potential value was atthe highest level (3,3), as well as the output of the neural network for the input (60,93.5) was Sp = 47.074%.
Figures 5 and 6 present the plot for mean and S/N ratio for the selected factors (Cc and Ip) on the swelling pressure. These results show that the swelling pressure increases as the plasticity index and clay content increase and that the plasticity index has the highest effect on the swelling pressure allowed by clay content. They further indicate that the highest levels (3, 3) special to an effect on means and S/N ratios gave the excellent combination of levels, therefore, optimal swelling pressure combination predicted for parameters examined is the plasticity index Ip = 93.5%, and the clay content Cc = 60%. These results can be confirmed in Table 8, where the greatest swelling pressure value was at the highest level (3,3), and where the output of the neural network for the input (60,93.5) was Ps = 873.969 kPa. In this case, the factors having the greatest effect are the clay content followed by the plasticity index.
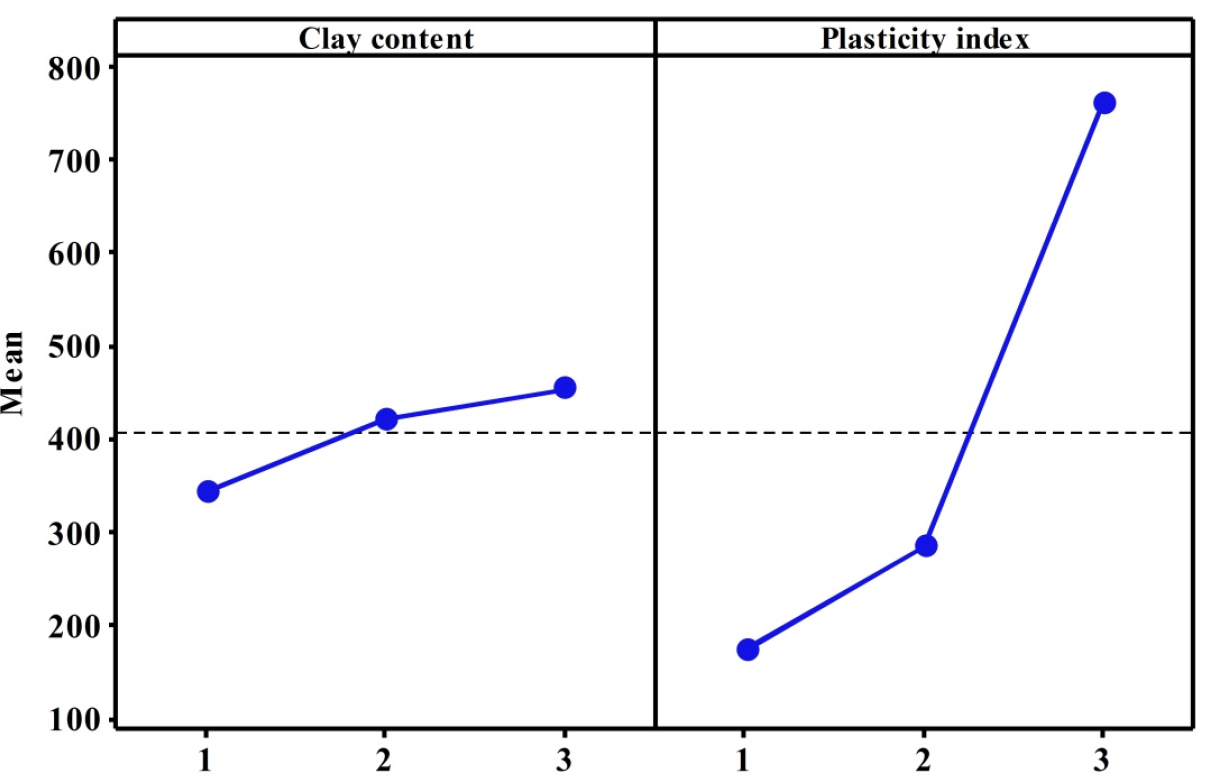
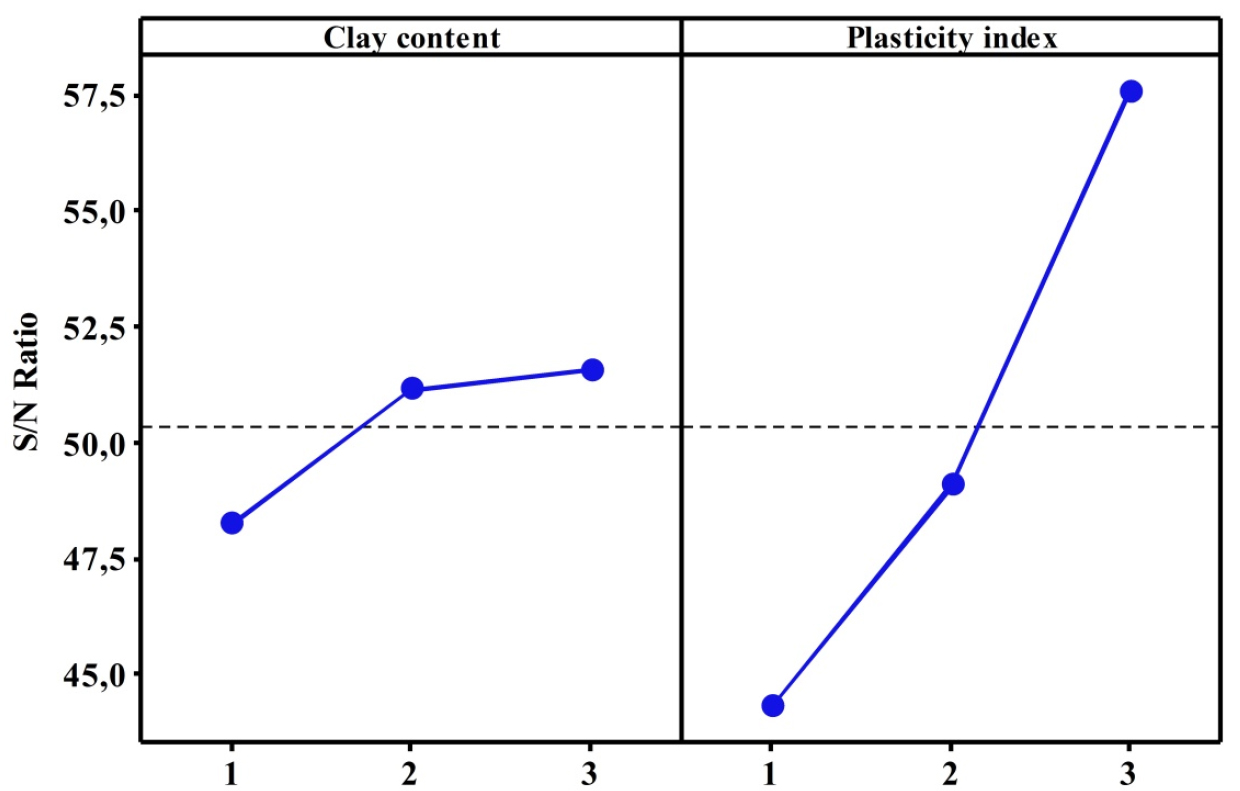
The results of the method used for this study (Taguchi L9) showed the strength of the effect of the two parameters, the clay content and the plasticity index, on soil swelling (swelling potential and the swelling pressure), so that the higher the percentage of clay content and the plasticity index, the greater the degree of swelling. In this study, soil swelling is observed from value Cc = 29% and Ip = 17.1%, and reaches a maximum value at Cc = 60% and Ip = 93.5%. These results are in agreement with those obtained by several researchers who studied and classified soil swelling from these two parameters (Sp and Ps). Moreover, the importance of the applicability of the Taguchi method in geotechnical engineering studies in general, and particularly in the prediction of soil swelling, is demonstrated as it ensures very high accuracy and comprehensibility of the effect and robustness of each parameter separately on the soil swelling, compared to the use of other conventional statistical methods.
Analysis of variance (ANOVA)
Analysis of variance (ANOVA) is a standard statistical technique that was used to determine the reliability of the results of the Taguchi experiment and provide information about the degree of effect of each factor of the orthogonal array on the result. This analysis was carried out at 95% confidence level and a significance level of α = 0.05. The percentage contribution for each factor is represented by the ratio of pure sum to the total sum of the squares [22]. The P-value in the ANOVA is a probability for determining the differences between the factors means are statistically significant.
Table 9 shows the ANOVA analysis results for the swelling potential with the percentage contribution of each factor to column 4. It is observed that the plasticity index has the highest significance (91.66%) followed by clay content (4.97%). Moreover, the “P” value for the plasticity index is less than 0.05 indicates that this factor had a significant effect on the swelling potential.
Table 9.
Analysis of Variance (ANOVA) for swelling potential
The results of ANOVA for swelling pressure in Table 10, indicate the percentage contribution of each factor. It was found that the most influential factor was the plasticity index representing about 95.77%, followed by the clay content with a percentage of 3.19%. Similarly, the “P” value for the plasticity index is less than 0.05, which means that this factor had a significant effect on the swelling pressure.
Table 10.
Analysis of Variance (ANOVA) for swelling pressure
The ANOVA analysis results show that the interactions between the selected factors have no statistical significance or contribution to the swelling potential or swelling pressure. In addition, the ANOVA analysis confirms the results predicted by the Taguchi analysis, which gave a very good result in determining the optimal conditions for estimating the swelling potential and pressure.
Conclusions
In this paper, a new integrated approach of ANN and Taguchi algorithms is presented to solve the soil swelling estimation problems. The quite well promising outcomes of this research provide that Taguchi L9 and ANN method can be widely efficient to predict two essential parameters for the engineer and difficult to determine (swelling potential and pressure) from two simply measurable parameters (clay content and plasticity index). Analysis of variance (ANOVA) has also demonstrated that the reliability of the results of the proposed algorithms is very acceptable. Finally, this approach has the capacity to predict and determine optimal conditions of swelling potential and swelling pressure in a very short time with inexpensive cost, in comparison to other methods, and this in response to different combinations of factors/levels by conducting a very small number of experiments with good accuracy. Further research can be carried out to advance this design methodology.
