

Introduction
Materials and Methods
Classification of various LULC classes
Post-classification corrections
Determination of Land Surface Temperature
Results
Land Use Land Cover Maps and changes
LST Distribution in the Lucknow District
Conclusions
Introduction
The Intergovernmental Panel on Climate Change (IPCC) claims that there has already been a considerable increase in the thermal readings, with the average worldwide surface temperature increasing by 0.73 Kelvin during the last hundredfold. According to observations, the Surface Urban Heat Island (UHI) formation leads to increased energy and water use [1]. During the summer, Surface UHI causes an increased demand for energy as well as a drop in outdoor air quality [1, 2]. The use of air conditioning/air cooling systems accounts for the majority of the increasing energy consumption [1, 2, 4]. Together with higher thermal readings and energy consumption, Surface UHI increases pollutant accumulation across city centers along with an impact on microclimate by influencing provincial wind trends, altering perspiration rates, elevating moisture levels, and creating fog and cloud cover [1, 2]. Smog (ozone) formation accelerates as a result of the heated air, which accounts for a significant environmental and health hazard [1, 2, 4]. As a result, the extent and distribution of Surface UHI phenomena have been one of the main issues in several metropolitan climatological researches [1, 2, 4].
Urbanization results in the substitute for natural land cover with impermeable urban components, as well as changes to the ecological system and land surface radiation dynamics. Changes in land use and land cover are significantly ubiquitous in the way they determine the identity of an area when accounted for. The conserved resources such as greenbelts, floodplains, and open spaces, are vulnerable and fragile as a result of the massive urban process in the center and adjoining urban area edge [2, 5]. It will also cause massive resource and amenities shortages in the coming times, surpassing administrations’ and responsible stakeholders’ capabilities [6].
The most noticeable consequence of urbanism is the Surface Urban Heat Island (Surface UHI), which is a degree of the relatively close ambient temperature disparity amid urban areas and adjacent rural areas. When urbanization alters the characteristics of the surface of the earth, the urban heat island is an instance of inadvertent climate alteration. The kind of land cover has a significant impact on the city’s surface and air temperature patterns [3, 4]. Furthermore, quantifying urban-led Land Use Land Cover (LULC) shifts allowed researchers to conclude the influence of trends in the urban environment on temperature fluctuations [2, 4]. Effects of LULC’s geographical arrangement and biophysical composition on urban warming, for example, might be examined. These landscape ecology influenced studies attempted to investigate the causes and implications of thermal variability at various extents and supplied a wealth of data for correlating trends with dynamics in ecological research in the cities [2, 5]. LANDSAT thermal infrared (TIR) data from satellites applied in the calculation of Land Surface Temperature (LST) has been an important factor for the determination of the effects of sprawling suburbs on land usage and land cover. Alterations in Land Use Land Cover (LULC) appeared to have connections with the thermal trends of cities in numerous cases [2]. Moreover, thermal properties may fluctuate with change in form of buildup over time following changes in land cover and hence become unrestrained, such as the average and annual magnitude of LSTs [7, 8]. As a result, a temporal assessment of thermal regions must take into account time-varying thermal features. Land usage and land cover have been shown to change at a rapid rate over time. Previous studies have often evaluated land use land cover change from a decadal viewpoint; however, due to fast urbanization, land use land cover scenarios are showing considerable changes only in half a decade of time duration.
This study has analyzed Land Use Land Cover (LULC) modifications and their effect on the land surface temperature readings from the year 2014 to 2019. The present investigation attempts to analyze and quantify the spatial and thermal changes during a period and to understand the interrelation between spatial and thermal properties of a region. The result of this study will be very useful for predicting the thermal behavior of a region and overall climate change triggered due to urbanization. The results of the study will help in the sustainable urban development and designing the policy recommendations to harmonize the anthropogenic factors. The study area of Lucknow is one among the districts of India, facing rapid urbanization and their serious consequences. The present investigation will provide a prototype trend of formation of urban heat island in a region, for further necessary policy implementations which in turn will protect the environment and human health.
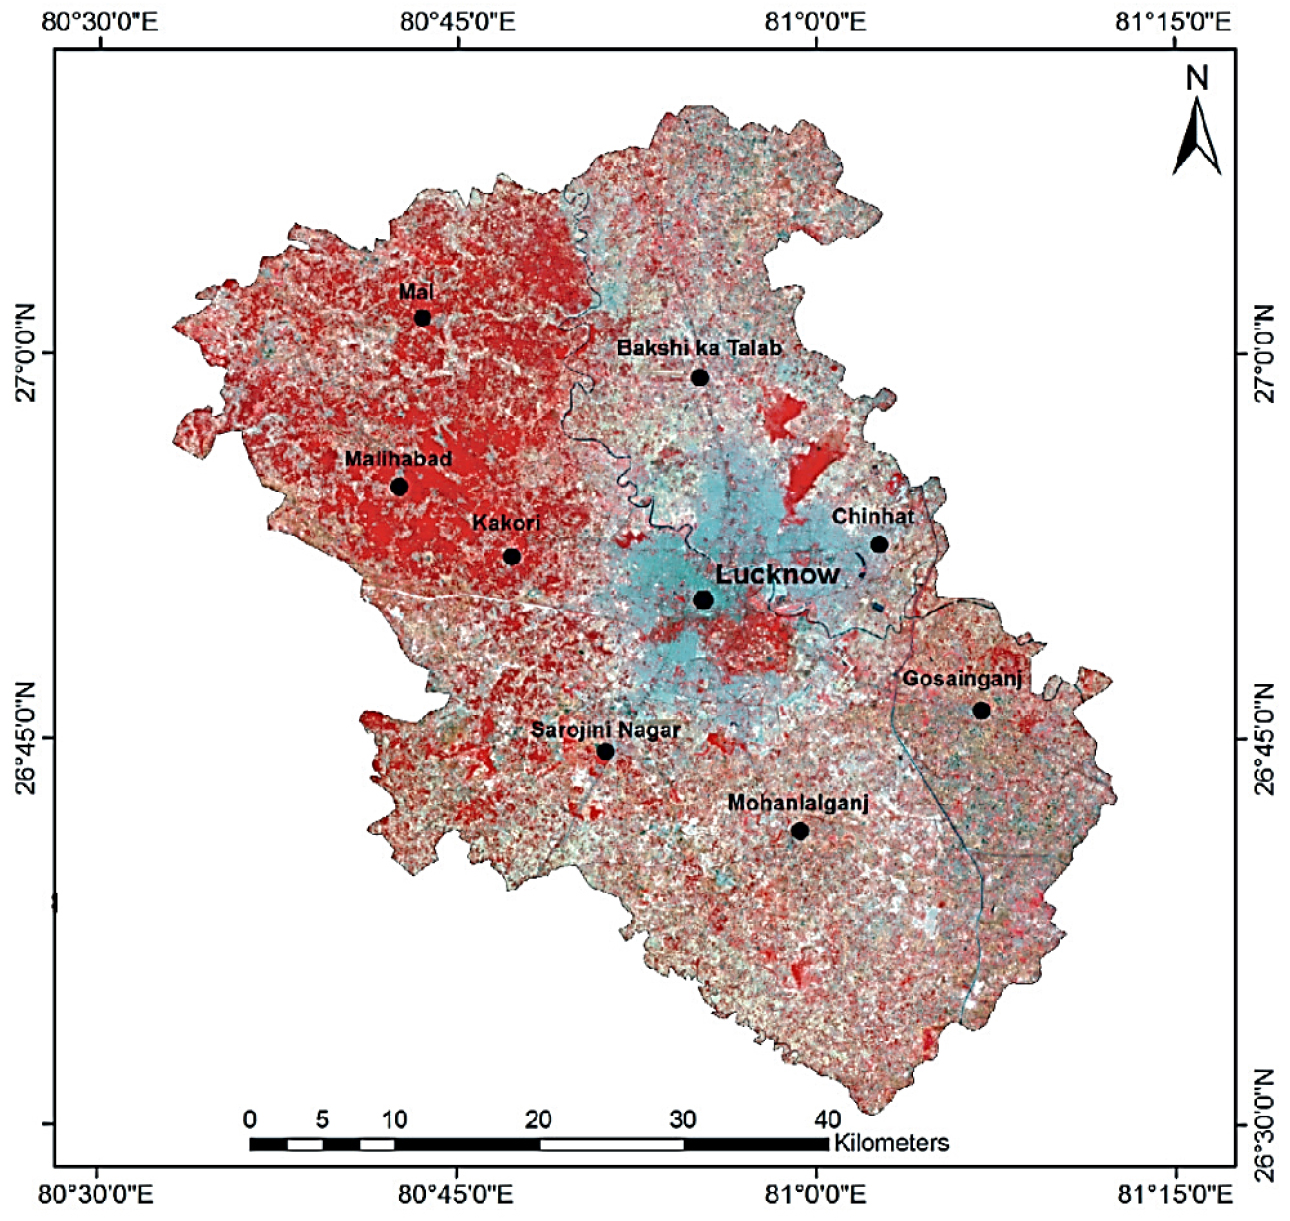
The study area, Lucknow, is the fifth most populous district in the state of Uttar Pradesh, India, as well as the second-most densely populated urban agglomeration in the state and ninth within the country, with 2528 sq km of aggregate area (Figure 1). Corresponding to the 2011 Census, it has a population density of 1816 people per square kilometer [9]. The population density varies from 600 to 1000 persons per square kilometer within current compact neighborhood regions [9, 10]. It lies in the northern hemisphere, between Longitude 80.30 degrees and 81.13 degrees east; and between Latitude 26.30 degrees and 27.10 degrees North. The river Gomati, which is a tributary to river Ganga’s left bank, divides the district in two parts.
The climate of Lucknow is humid subtropical, experiencing hot. It experiences a dry, scorching summer season beginning in the latter half of March to the whole of June, followed by a rainy season that begins July to the middle of September, while the district experiences an average of 896.2 mm (35.28 in) of rainfall caused by the southwest monsoon winds, with frontal rains occurring once in a while in January. Winters occur in the city from the middle of November to February as severely cold and dry. The maximum temperature in the winter is about 24 degrees Celsius (76°F), and the low is between 2 degrees Celsius and 6 degrees Celsius. June (26.4°C) is the month featuring the greatest average low temperature. January (7.4°C) is the coldest month (consisting of the lowest average low temperature). May (42°C) is the hottest months (having the largest maximum temperature). The month of January acquires the lowest average maximum temperature (21.5°C) [11].
Materials and Methods
This research applies remote sensing data from satellite Landsat8 featuring OLI and TM sensors have been used in this study. During the study period, the city has undergone significant transitions and transformations. Thus, the spatial mapping of LST w.r.t. LULC has been done and analyzed thoroughly [12]. The resampling of data has been done so that the resolution matches for all of the dataset for generating the green index using weighted overlay. Furthermore, this data was chosen because they are all openly available to the general public domains. It was important to use several methodologies to build a reference dataset for training samples and accuracy assessment in this land use/land cover alteration research. This data set is used to verify the information retrieved from satellite imagery. The reference data was gathered from a variety of sources, including Google Earth Pro, the US Geological Survey website, and the Bhuvan website, among others (Table 1) [13, 14]. All of this background information has been used to improve image classification, accuracy evaluation, and change analysis. The data from Lucknow Development Authority Master Plan-2031 has been utilized to evaluate the area and zonal boundaries in the research region by digitizing [15]. Other maps and data have been collected from [9]; Census map (Census, 2011, India), the mango belt gazette-1985, Lucknow municipal corporation CDP and reports [16].
Table 1.
Data Specifications
The GIS software from ESRI has been utilized to quote land use/land cover information and do a subsequent assessment of interrelationships and structures to store, examine, and visualize the data. In addition, Microsoft Office add-ons for tabulations and graphical representations were used to display, describe, and analyze land use/ land cover behavior and trends in the district. Using ArcGIS 10.3 software, LST images have been derived from spatial data for the research region.
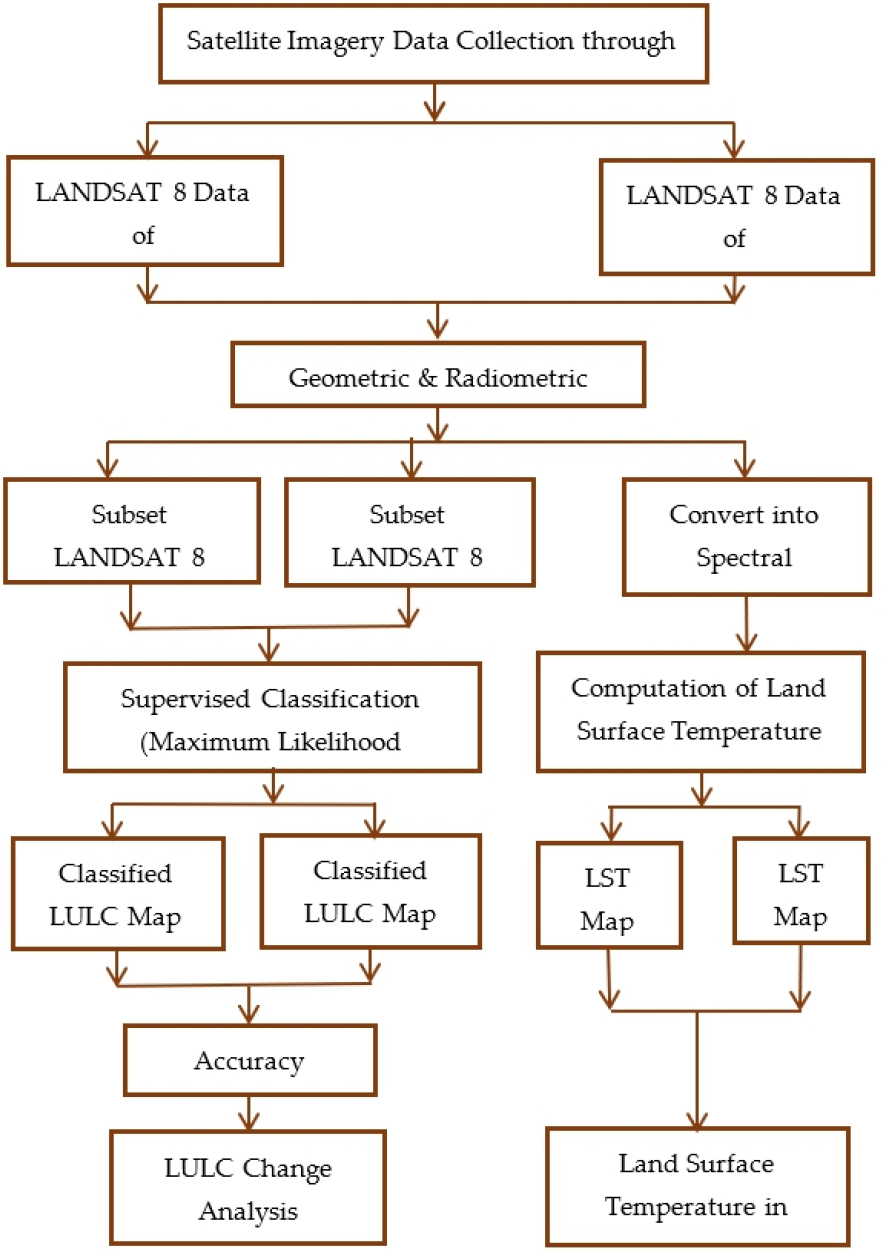
The entire study has been performed into three phases to meet the study’s objectives: land use/land cover categorization and mapping; estimation of land surface temperature; and analysis of the rural-urban transition that culminates in the establishment of Surface Urban Heat Islands throughout time (Figure 2).
Classification of various LULC classes
Visual image inference of satellite imageries, for instance, is a time-consuming, labor-intensive, exorbitant, and impressionistic form of land use/land cover classification. Given the heterogeneity of the urban environment and differences in understanding, individuals’ outcomes differ. As a result, researchers are switching to semi-automated methods [17]. Consequently, a semi- automatic or supervised classification strategy was employed to classify distinct LULC classes in this classification study. Supervised classification is an image processing tool that enables components in an image to be identified based on their spectral characteristics.
The results demonstrate that in bands 5, 6, and 7, all classes have good separability, considerable separability in bands 3 and 4, and poor separability in bands 1 and 2. Based on the findings of spectral signatures and training samples, this group of training samples can be used in the classification process.
A supervised classification approach, the maximum likelihood classifier (MLC), was adopted to classify the satellite picture into a classified LULC map of the research area. It’s a pixel-based parametric statistical classifier that uses training samples to calculate the average and standard deviation of every category. Maximum likelihood classification uses Bayes’ theorem to assume considering the values for every category in every band are multivariate usually scattered and determines the likeliness that a particular pixel attaches to that class. As a result, MLC can detect those elongated classes by using both the mean vectors and multi- variate spreads of every class [18].
This research focuses on five important categories: water bodies, built-up areas, vegetation, agricultural, and vacant land. All developed surface regions, such as paved surfaces, asphalt roads, buildings, rocks, mixed surface characteristics, and other people made structures are classified as built up. Rivers, water in the wilderness, wetlands, ponds, swamps, canals, and marshy ground are all examples of water bodies. Vegetation includes farmland, forest, grassland, and whereas open areas, fallow land is incorporated in vacant. Subsequently, we achieved accurate LULC maps for 2014 and 2019, provided that was then contrasted to the considered information to determine categorization precision [19].
Post-classification corrections
Several materials (e.g., exposed soil and built-up, or forest and several crop varieties) have identical spectral signatures, which might affect classification accuracy. Several spectral indices and masks were employed for post-classification corrections to manage relevant features that may be spectrally identical but belong to separate LULC classes to improve the findings. Masking is one of the approaches that have been created to counteract the risk of misinterpretation. Various misleading features can be easily differentiated from one another and reclassified in their original class by employing different masks.
Because the research area’s sun angles are often low during the winter, the reflectance of natural vegetation is misclassified as two independent classes during the classification, resulting in an error in the classification. As a result, a supplemental data set, the Normalized Differential Vegetation Index (NDVI), was employed to validate natural vegetation in the research region. The Normalized Differential Vegetation Index is calculated using Landsat 8 satellite data in the red and near-infrared bands (NIR). It’s usually used to keep track of how much flora is present and how healthy it is in a certain area. The NDVI scale runs between +1 to 1, with +1 representing the green vegetation and -1 representing non-vegetated cover. For Landsat 8 OLI images, NDVI is defined by the following equation, and its value ranges from 1 to +1.
The surface reflectance of Landsat 8 OLI’s Red (Band 4) and Near Infrared (Band 5) bands are ρ4 and ρ5, respectively. Variance among the two data sets: acquired data vs reference data are commonly viewed as inaccuracies in the remote sensing satellite data- dependent land use/land cover map. To detect and measure this mistake, accuracy assessment or validation is a key stage in the interpretation of remote sensing data.
Determination of Land Surface Temperature
Any satellite image data is kept in the format of Digital Numbers (DN) that represents the spectral radiances of terrestrial materials in an indirect manner. Band 10 data of Landsat-8 are employed to compute the land surface temperature. Even though Landsat 8 has two thermal bands (bands ten and eleven), the 11th band was not utilized because of the considerable ambiguity of the LST obtained. As a result, just the 10th band was employed in this study’s LST evaluation (Landsat 8 calibration notice, 2017). The radiance conversion from a digital number has been the first step towards LST determination [2, 20]. Then, the brightness temperature has been obtained from the radiance once it has been converted to DN values [2, 20, 21]. The proportion of vegetation (Pv), and the collective magnitude of soil and vegetation emissivity (n) has been determined. Finally, the research area’s land surface emissivity (ε) is obtained [2, 21]. By applying the equation to the surface reflectance of the NIR and red bands (ρNIR and ρRED) of the Landsat 8 OLI sensor (bands 4 and 5), the normalized difference vegetation index (NDVI) is calculated [2, 22]. Lastly, the LST was computed over the research region using Landsat pictures, applying satellite brightness temperature (Tb) and surface emissivity (ε), and changed to degrees Celsius [2, 23].
Results
Land Use Land Cover Maps and changes
The biogeochemical cycles; deterioration of sustainable habitats; ecosystems; reduction of ecological character; depletion of agrarian field; degradation of wildlife and aquatic ecosystem; and exhaustion of water bodies have all become issues that require consciousness of land use/land cover. The rural-to-urban migration; rapid population increase; the transformation of rural areas to urban areas; deprivation; inadequate awareness of biophysical boundaries; lack of consideration of ecological resources; and the use of environmentally unsustainable technologies are some of the key reasons for Land cover/land use changes.
The core part of the research region is mostly comprised of built-up land use, whereas the rest is mostly composed of vegetation and bushes. The River Gomti meanders through the center of the centralized developed study region and the built-up spaces. The research area’s periphery is made up of either agricultural or vacant land. Because the northwestern section of the research area is located in Lucknow’s Mango tree belt, the vegetation class may be noticed prominently in the area. The extensive vegetation is also due to a reserve forest located on the outskirts of the built-up area in the north direction.
The division of land surface temperature in the urbanized region had been negatively impacted by changes in land cover and land use. Agriculture, vegetation, and shrub land contribute to the cooling of surfaces of the earth through evapotranspiration, whereas impermeable surfaces and vacant land promote the rise in the LST [24]. Barren fields are typically left undomesticated for more than one or only one season, when a crop cannot be sustained further than just propagating along with sprouting in a single or maybe additional harvest spell. Such effects are attributed to synthetically alter topsoil productivity, the impact of ground salinity, runoff, and erosion, among other factors [24].
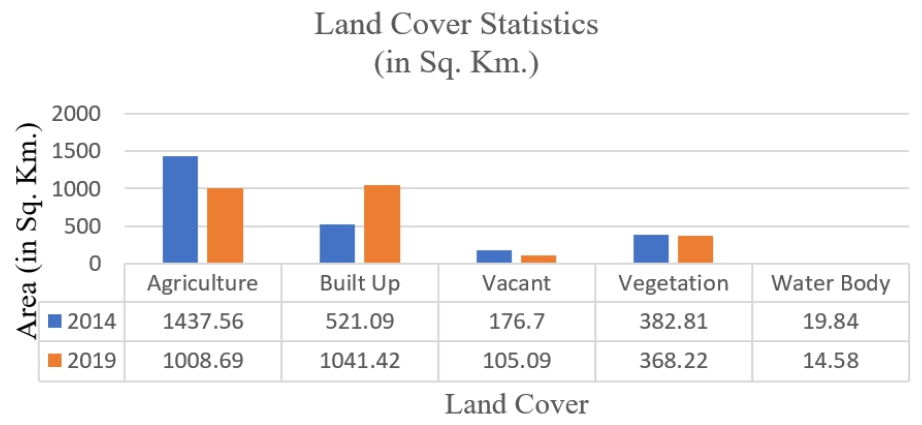
Overall, all land use types in Lucknow city have changed, with the urban area showing an indicatively elevating tendency and the remainder of the land-use types showing a declining tendency. Over the study period, the urban constructed region has grown from a preliminary extent of 521.09 km2 in 2014 to 1041.42 km2 during 2019. Only in the last five years has agricultural (1437.56 km2 to 1008.69 km2), water bodies (19.84 km2 to 14.58 km2), vegetation (382.81 km2 to 368.22 km2), and fallow land (176.7 km2 to 105.09 km2) shown a drastically decreasing pattern. Most of these land-use groups appear to have been altered to build up sites over time (Figure 3 & 4).
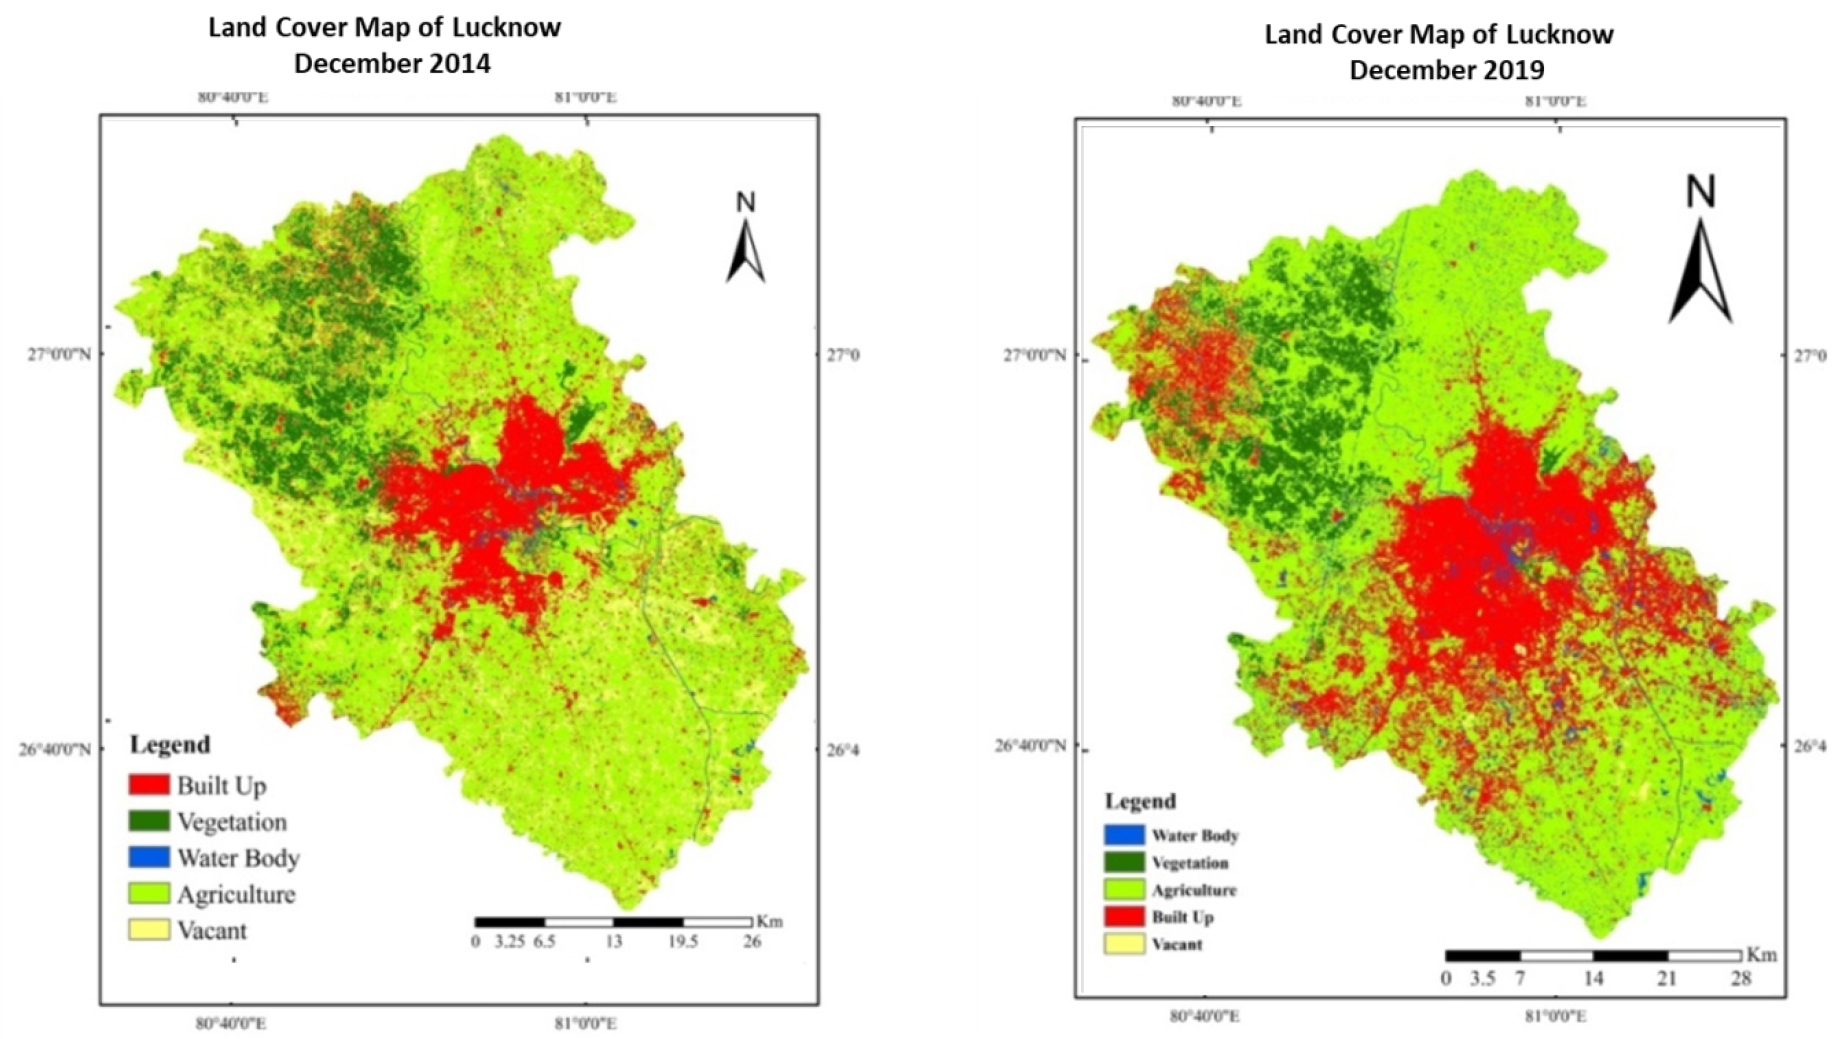
The built-up area, which includes human settlement adopted for non-agricultural purposes such as buildings, and transportation, has expanded significantly from 21 per cent in 2014 to 41 per cent in 2019, a net gain of 20 per cent (Figure 3). This is owing to the research area’s urbanization and population growth throughout the study. The agricultural area utilized in the harvest of food and paddy, groceries, and additional varied kinds like mango horticulture as well as other indigenous trees has decreased dramatically from 57 per cent (2014) to 40 per cent (2019), a net drop of 17 per cent. The south pocket of the research region is agricultural or vacant ground with minimal vegetation, which is within the boundaries of the Lucknow Industrial Development Authority Area (LIDA) for industrial activity. The barren land will be left for future city expansions for built-up purpose.
In the research area, large areas of agricultural land were turned into communities, thus additional developmental occurrences were seen. The highly and sparsely dense constructed regions have shown growth substantially. Perhaps this might be due to large-scale increasing migration to these locations, which has resulted in the city’s physical expansion. The zones of water circulation, which include natural and artificial water infrastructures, like rivers/streams, lakes, dams, along with the section of the Gomti River and miniature lakes (Kathauta Lake and Rajajipuram Lake) have decreased from 0.78 per cent in 2014 to 0.57 per cent in 2019, a net decrease of 0.21 per cent. The gradual change of the area of water distribution into a built-up region, such as, apartments by builders, has culminated in depletion in the areas of water bodies, predominantly ponds (Figure 4 & 5).
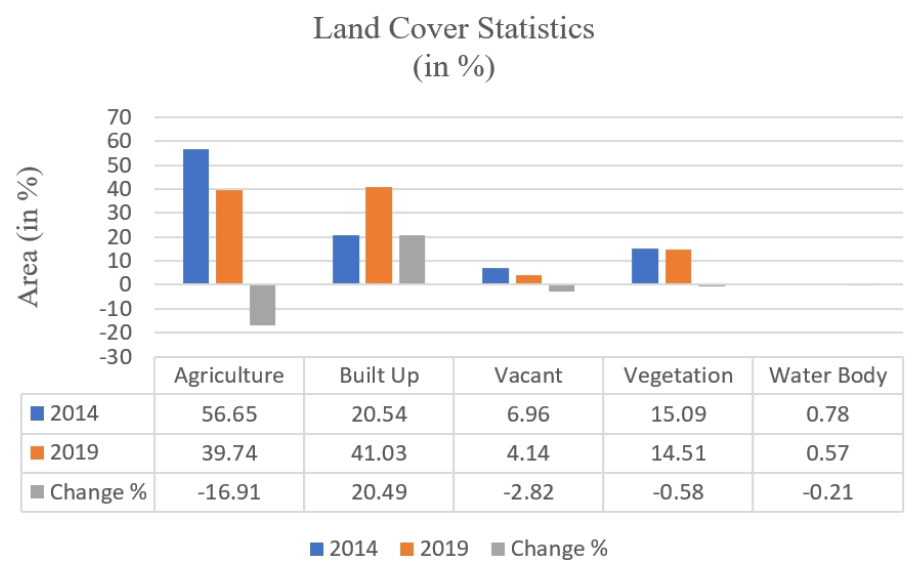
The reduction of land cover/ deforestation increased significantly from 15.09 per cent in 2014 to 14.51 per cent in 2019, especially, within the mango growing region, being the principal agrarian cash crop in the research site. The mango orchards and flora alongside the west stretch connecting the Agra-Lucknow expressway and the railway thoroughfare to the NCR were significantly responsible for this. According to U.P. Promotion and Protection of Fruit Trees (Regulation of Harmful Establishments and Housing Schemes) Act, 1985, the housing construction and harmful establishments are emphasized to be restricted from the vicinity of the mango belt, which helped in keeping away the environmentally harmful businesses, such as brick kilns [25]. Anthropogenic activities; degradation of forests; population expansion; and abrupt urbanization could all be leading to the shift in land usage and cover [5, 6, 26]. Another explanation for Land use/Land cover variation is climate change, which affects temperatures; patterns of precipitation; and intolerable weather occurrences; are causes of change in the land usage and cover [5, 6].
LST Distribution in the Lucknow District
The assessment of the LST (Land Surface Temperature), which requires the utilization of thermal remote sensing information, is the study’s key goal. The thermal readings of the junction between the planet’s surface and its atmosphere are known as Land Surface Temperature (LST), and so it is a critical factor for understanding surface-atmosphere dynamics as well as a major component in meteorological and hydrological research that involves energy exchanges.
In the electromagnetic spectrum, the thermal infrared TIR area spans 3.00 m to 12.0 m (EMS). The radiation in this spectral region is primarily emitted (rather than reflected) radiation from the planet’s surface (Figure). The frequencies 3-5 m (MIR) and 8-12 m (TIR) are the most widely used since the atmosphere is quite clear and the signals are just slightly reduced by atmospheric absorption. A surface’s emission is proportional to its temperature. Because thermal remote sensing doesn’t rely on reflected sunlight, the radiated energy can be measured at any time of day or night.
As the maximum of the signals received through the sensors in this wavelength range is straight away released by the ground, thermal infrared (TIR) remote sensing offers an alternative way for gathering LST statistics on a domestic and international level. The LST used here is a Band-10 LST value in degrees Celsius. The figure shows the LST over the research region of 2014 and 2019 using the equation from the preceding section. During this winter month of December, the temperature variance was studied for 5 years and established that it elevated from 14.27°C to 16°C as the low thermal reading, whereas maximum temperature has shown almost to be the same as 25°C. The significant temperature change during these years has been recorded (Figure 6).
The land surface temperature (LST) across the study site in 2014 and 2019 is depicted in the temperature profile displayed in the Figures below. In 2014, it was discovered that the surface temperatures in Lucknow’s core areas were the greatest, ranging between 23° and 26°C. The temperature figures in the research region ranged from 19.52°-22.05°C in areas bordering the built-up and some other open spots or bare land, whereas the majority of the area had surface temperature figures between 14.27°-20.71°C (Figure 6).
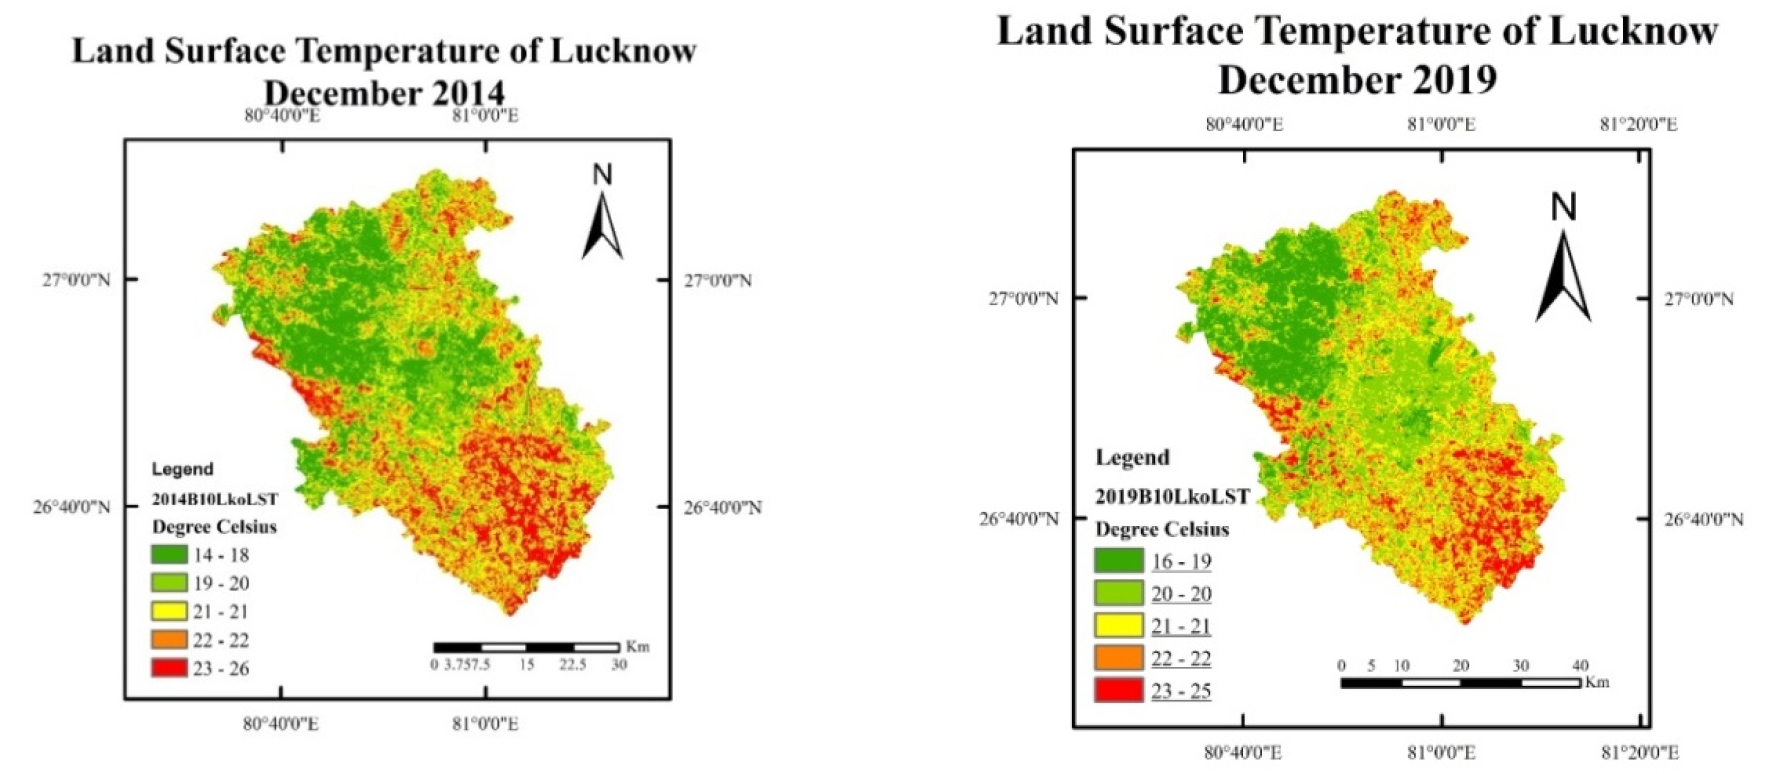
When the above-mentioned land cover findings were compared to the Land Surface Temperature findings, it was discovered that high temperatures were integrated with built-up regions and regions of anthropogenic activity such as buildings, roads, and so on. The lowest temperature is found in the densely vegetated sections of Malihabad’s mango orchards, which also include a water body. The annual average low and high temperatures, as well as the degree of their variances, are summarised in the table below. The lowest temperature has risen by 2°C between 2014 and 2019. The maximum temperatures, on the other hand, have stayed consistent in both years but areas experiencing hotter temperatures have increased in the five years. The annual average low and high temperatures, as well as the degree of their variances, are summarised in the table below. The lowest temperature has risen by 2°C between 2014 and 2019. The maximum temperatures, on the other hand, have stayed consistent in both years but areas experiencing hotter temperatures have increased in the five years. In 2019, not only have the temperature values risen, but the core areas in the research region have also expanded outwardly, indicating that there are more thermal properties as a consequence of human activities than in the previous image. The centre areas’ temperatures have risen dramatically over the years, rising from 23° to 25°C. The surface temperature has risen substantially over the last five years, with the lowest temperature in 2019 being 16°C and the highest being 25°C (Table 2). The minimum surface temperatures increased from 14°C in 2014 to 16°C in 2019, whereas the spots with the greatest land surface temperatures increased from 2014 to 2019 (Table 2).
Table 2.
The temperature values of the study area for years 2014 and 2019
| Temperature | Year 2014 | Year 2019 |
| Lowest value (°C) | 14 | 16 |
| Highest Value (°C) | 25 | 25 |
The rising temperature represents the impact of population outbursts in key locations of the study area, which originate in urban heat islands. As a result of urbanization, Surface UHI reveals a significant degree of susceptibility at particular locations on the planet. Whereas there has been a discreet minor alteration in land cover, there is a no or small increase in temperature. The greatest temperature is seen in the Lucknow Industrial Development Authority Area (LIDA) division, which is mostly agricultural or vacant land, according to the LST map of Lucknow city. The higher temperature readings are related to industrial activities in the LIDA region, not to the agricultural sector. The temperature in the central section of the city, which is made up of built-up areas, is higher, although not as high as in the LIDA area. This effect could be accredited to the existence of conserved woods as well as dense vegetation in the cantonment area.
All of the city’s water bodies, whether the Gomti River or the two lakes, are located within densely populated neighborhoods. The increased built-up temperature could be attributed to higher readings at regions containing water bodies in the research region, considering the legibility of the data utilized in the research is only moderate range (30 m). Agricultural land and vacant land-use class study areas have a lower LST value, which is their inherent ability to absorb radiation and radiate it as heat. As urban green space over built-up pixels depicts existing reachability towards vegetation for an urban area, however green space representation over fallow and agrarian fields’ pixels depicts the city’s long term expansion potential, areas along major connecting roads in the region may anticipate further urban development in the coming years. Such an assumption of growth is apparent because these places have a better approach to green space, which increases the likelihood of improved health habits.
If planners are considering built-up settlements in the future, they will resort to Chinhat, Ashiyana, and cantonment because its barren pixels have better access to the flora concerning urban green space. The greater land surface temperature of developed and vacant pockets pixels compared to foliage/water pixels can be ascribed to the fact of closeness to highly dense built-up, the existence of tall buildings, and lower density of greenery. It is more effective to be close to a densely vegetated area than to be close to a densely built-up area. Additionally, based on the patterns of LST fluctuation, a deduction may be considered that in the presence of a highly dense green area, the increase in a built-up area is less critical than in the presence of a highly dense built-up.
In Lucknow, 60 per cent of the developed area is in the medium-rise range. Pixels in high-rise built-up stretch have greater LST values in comparison to pixels in the lowly heightened urban regions, although comparatively pixels in zones of tall buildings exhibiting lower LST values, that might be because of the larger shaded area generated surrounding the tall buildings [26]. Building elevation and vegetation covering both have a considerable negative impact on LST, whereas building density has a considerable strong influence, as evidenced by earlier research [16, 26]. The high mean Land Surface Temperature values occurred within the city centre, in other words, inside the cis-Gomti area in the years previous to 2019, while it steadily expanded towards the trans-Gomti area in 2019 as revealed by rural-urban gradation evaluation. Another place with elevated LST readings is the airport’s enormous extent. The airport’s massive expanse of land, which is mostly exposed, or concrete, and deficit of natural cover make it particularly vulnerable to Surface UHI. As a large surface open to radiation and is made of concrete, the airport heats up quickly and promotes the development of Surface UHI. The remaining locations were in the old city’s residential neighborhoods. Urban sprawl is still active along outer ring roads of Lucknow, with numerous new and speedy projects being built in the vicinity. Vast swaths of land are in the process of being built, leaving them exposed to the elements, resulting in excessive heating. The majority of houses in the slum areas of the study area contain asbestos as the roofing material. The neighborhood is tightly bound, amidst little in the way of greenery. This location develops a Surface UHI tendency as a result of these two variables.
The majority of the locations were discovered in low-density industrial zones (LIDA) that are mostly devoid of any green cover and consist primarily of high-density built-up. Concrete structures abound in the industrial world, where they serve a wide range of purposes. These structures receive more radiation and emit less due to their thermal characteristics and poor emissivity. Furthermore, the uncovered vegetation- deficit areas of industrial setup have moisture absence, contributing to the temperature increase. The prevalence of asbestos roofs in these locations raises vulnerability to Surface UHI even further. As a result of the combined effects of all of these causes, heat builds up in the region, eventually transforming it into heat islands. Other sites are either densely built-up residential lands with weak thermal insulations, or regions with strong commercial activity. The cool islands appeared over the agricultural grounds, as well as neighboring villages and forests in the Cantonment areas, proving that vegetation areas are milder than built-up regions. Because these land surfaces have greater shadow and humidity, they capture less heat and produce more heat owing to evaporation.
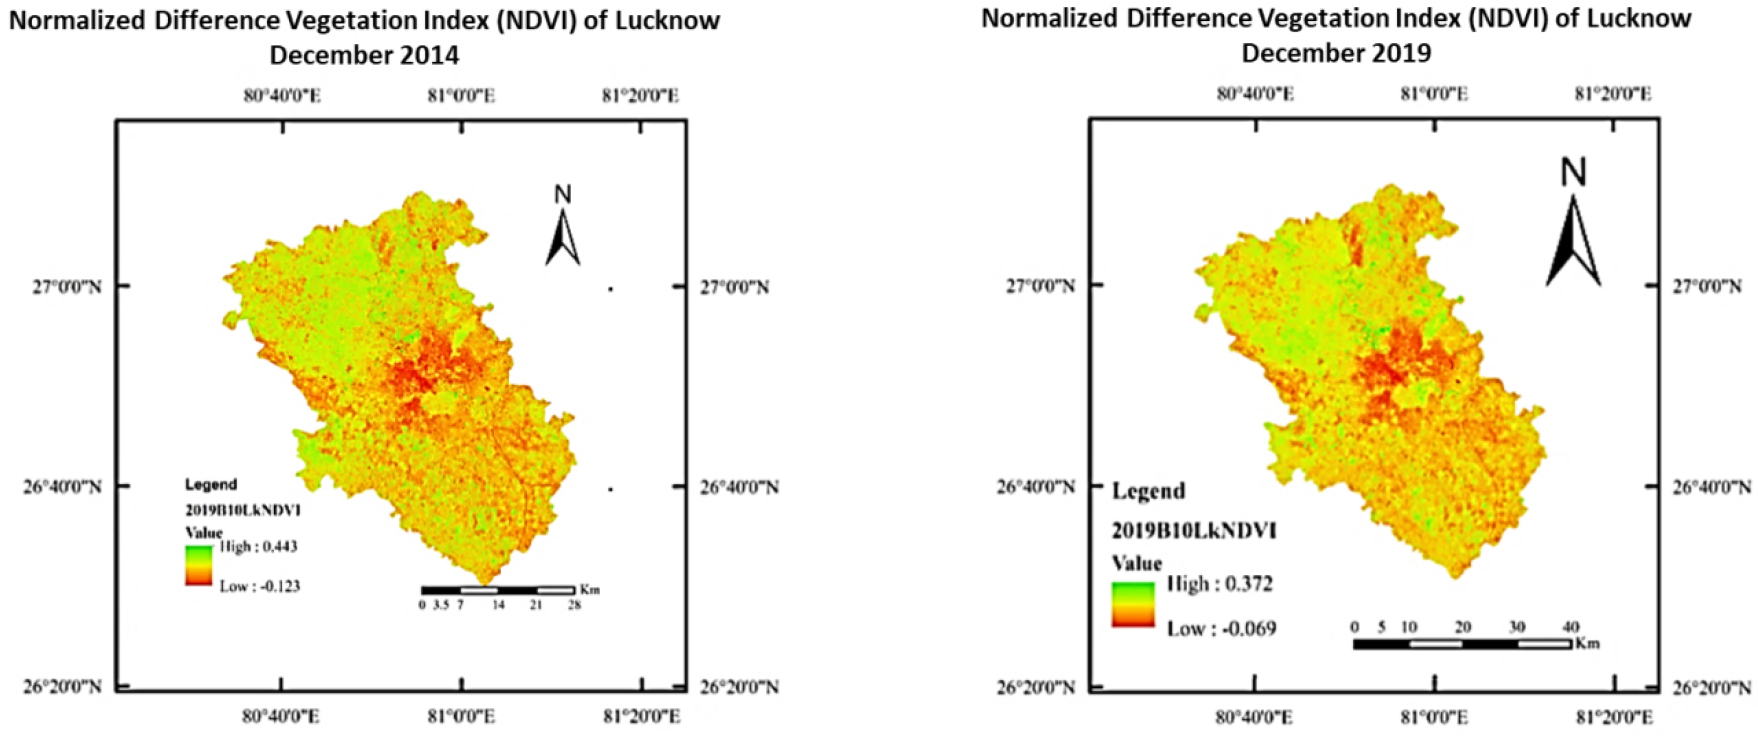
Different land cover patterns contribute to the Surface UHI in different ways, depicting the status of greenery, the spread of urban areas, and agrarian fields. For illustration, the Normalized Difference Vegetation Index (NDVI) has a contrary relationship concerning LST. The lowest NDVI values are seen in the study area’s central region, which corresponds to the prevalence of the built-up category in Lucknow’s core spaces. Due to the existence of heavy vegetation or shrub in such locations, the mango belt and Reserve forest regions have the highest NDVI values (Figure 7). A larger greenness density indicates a positive environment at the city’s outskirts, where limited impervious intensity and mean LST have been recorded. According to the findings, rural-urban interfaces are still in environmentally friendly condition than inner-city surrounds. These patterns show the city’s unsustainable development difficulties, which result in environmental deterioration. There is a rise of more than 2°C in the minimum temperature during the last five years. The locations where particularly severe changes are occurring are the built-up region, vegetative cover, and vacant terrain. The LST map shows that regions encountering the largest thermal readings are encompassed by town centre regions, enduring highly dense population. The edges of these crucial zones are spreading away from the city core. According to LST research, the Urban Heat Island phenomenon had prevalence in the district centre, i.e., in the cis-Gomti region, in 2014, consistently expanded to the trans-Gomti area in 2019 (Figure 6). The educational institutions of the study area have significant impact on the growth of the city. The developed region around parks and playgrounds appears to be growing faster.
Environmental engineers and decision-makers can use the data gathered through UTFVI to help preserve the city’s eco-environment. To maintain Lucknow’s eco-environment, the city’s urban centres that are more subject to severe Surface UHI occurrences must be considered in the city’s growth prospects. Owing to the gradual decline of flora, the results of land surface temperature also revealed that the existing urban thermal environment isn’t really good. The findings showed that the majority of existing urban areas are in the core and that high LST readings are likewise correlated in respect to the district’s core area, featuring Lucknow’s central city setting and has a high-density population. When analyzing LULC alterations, NDVI, and UTFVI, it is obvious to find key areas that reflect high temperature are predominantly connected with sites where changes in urban areas, vegetation, and vacant lands are occurring. As a result, it is noticed that urban development pattern and the city’s thermal environment are interrelated.
Conclusions
The current research is based on the topic of analyzing high-temperature zones and alterations in usage patterns of land in the Lucknow area utilizing GIS tools and remotely sensed thermal data in an inclusive approach. The spatial variation of the land use/ land cover and its impacts on land surface temperature has been analyzed. The results reveal the optimal area in which land use/ land cover classes influence surface temperatures, ensuing in the development of Surface UHI, which could be of great importance to stakeholders and policymakers interested in environmental climatological.
This study reveals how humans and their built-up growth comprehend a substantial influence on land use/ land cover. The agriculture, water bodies, and vacant land regions are shrinking. The land surface thermal reading of the land covers is analyzed. It reestablishes the existence of strong link between higher impervious density and higher LST. Furthermore, the analysis reveals a considerable rise in land surface temperature from 2014 to 2019. The intensity of heat of the surface is comparable with the land- usage categories, according to the temperature analysis. Surface heat variation was found to be low in zones with less rising temperatures, but LST surged higher in all four directions in zones with higher human activity.
The findings of the land use and land cover and LST assessments indicate the possibility of the city containing Surface UHI. The underlying reason for Surface UHI formation in the district is infill encroachment, according to the research. The research identifies the places experiencing serious ecological challenges. Altogether, the findings show that landscape layout has a considerable impact on land surface temperature fluctuation and Surface UHI development in Lucknow. Urban greening plays an important role in minimizing Surface UHI impacts, according to the study. As a result, urban planners and policymakers should include vegetation richness as a fundamental concern in urban development. The study certainly implies that cities should optimize abundant flora (e.g., trees, grass, and shrubs) with scattered urban constructions (e.g., structure, highways, and garages) to create a healthy built environment.
The city’s temporal NDVI was also examined, and it revealed a declining trajectory in vegetation cover from 2014 to 2019, which is crucial for rising temperatures in the city. As a result, observation was made about Lucknow demonstrating the predominant urban heat island occurrence and miserable environment, implying the need for more rational city planning and urban future development. Considering Surface UHI is affected by various elements, the results of this study open up new paths for upcoming analyses of the domain of ecological implications of built-up sprawl with slope or elevation. Further research is needed to investigate the variance in ambient temperature in the research region, that itself has been influenced through LST and has a substantial influence on the Surface UHI. The current study’s findings serve as a methodological basis for the imperishable use of land resources. This study is likely to be significantly useful for stakeholders and decision-developers in analyzing the existing state of development and enhancing their choices to make cities smarter and more sustainable in the future. Although urbanization cannot be avoided, it can be steered in a sustainable way by adequate planning, administration, and policy implementation, and this work is an attempt in that regard.
