

Introduction
Material and Methodology
Literature Review
Overview of Project
Result and Discussions
Direct Outcomes
Efficiency Analysis
Regional Categorization and Characteristics
Discussion
Conclusions
Introduction
Along with the advancement of ICT, the smart city, a concept that has appeared in discussions since the early 2000s, is now a topic of discussion in countries across the globe [1, 2, 3]. Many countries have conceptualized smart cities of their own and tried to construct models of smart cities. There are various concepts of smart cities pursuing different goals [2]. Diverse definitions of smart cities have been established, wherein the following concept commonly resides: The city is to be operated and administered by an exploitation of urban information. In conclusion it is explained as a data-driven smart city [4, 5].
The importance and exploitation of data for smart cities have been discussed in journals, books, and conferences for 10 years [5]. One may find approximately 2,000 search results of data associated with smart cities through SCOPUS [5, 6]. The results focus on IoT technologies, collecting information necessary for measurement of mobile events occurring in urban environments and for construction of database of such information. That is, contrary to past environments, wherein the securing of quantified data was difficult due to limitations in measurement technologies for traffic systems, energy consumption in or outside of buildings etc., the databases resulting from an advancement of IoT technologies, etc., have enabled quantitative analyses of data. The results emphasize the necessity—as well as possibilities and effects of—the exploitation of urban data, which has expanded its area of application. Few previous studies have delved into verification of efficiencies of smart cities through the use of actually established urban databases [5, 6].
This study thus intended to examine the possibilities of efficient operation and administration of smart cities. And I would analyze characteristics thereof associated with information systems through an exploitation of the analyses of big data to be created in urban environments by comparing the two hypotheses spontaneously established for this study.
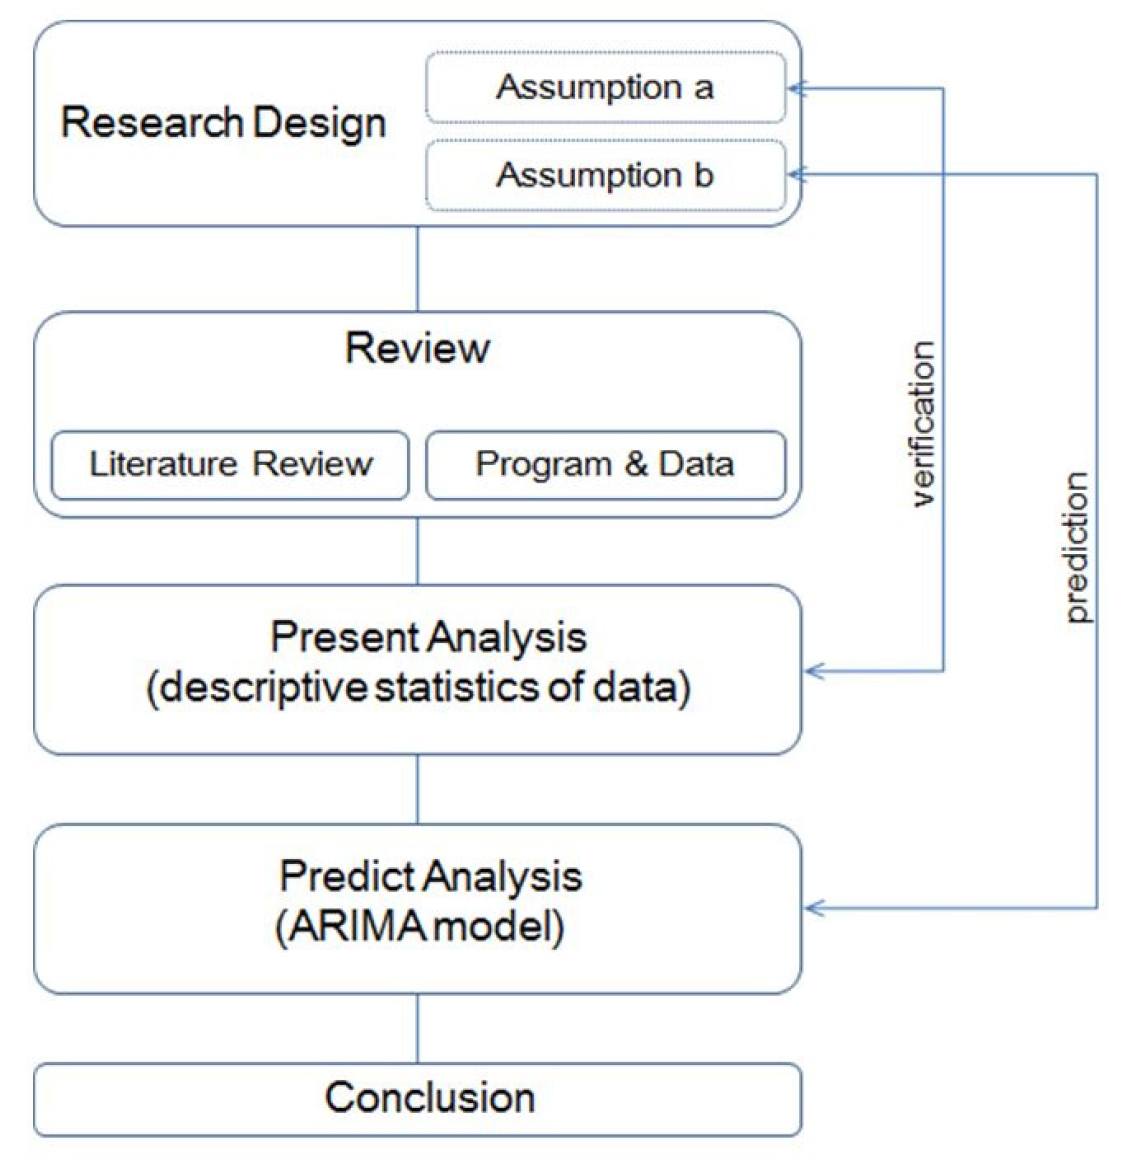
The first assumption is “the smart cities associated with urban information systems are in efficient operation and administration”. Basic statistical analyses of the database of big data of existing smart cities established and collected thereby will be carried out to identify characteristics of existing smart cities and the effects of their operation and administration. The second assumption is “the operation and administration of future smart cities will be enabled through the analyses of big data of smart cities”. Regional categorization and time series prediction models based on the database of big data of smart cities will be employed to find ways of operation and administration of future smart cities and to examine the possibilities thereof. The process flow and framework employed for this study are as illustrated in Figure 1.
Material and Methodology
Literature Review
Representative previous studies, that have delved into an exploitation of big data for smart cities, were the ones conducted (Kourtit et al. [7]; Bibri [8]; Giest [9]; Giordani et al. [10]). The study explained the use of computerized data as an essential element of urban economy of cities, the mass of an integration of internet connection of users, as well as of things realized through an advancement of wireless communication technologies [7].
The agora in ancient cities played key roles in core transactions or interchanges in politics and the economy. The ICT in current society plays roles similar to those of the ancient agora in that technology enables real-time sharing of diverse information in complex urban systems.
Besides, it has been suggested that an exploitation of big data of cities can help secure efficient and effective use and control of complex urban spaces. In particular, with the analyses of data-based spatial mobility of people and things micro urban spaces (which were realized by ICT that enabled the phenomenological urban understanding on patterns of movement of people in urban spaces as well as of consumption of energy therein, etc.), the authors explained the introduction of efficient urban organizations for both the private and public sectors and for residents and visitors to each city in terms of the exploitation of urban facilities to be directly connected with an implementation of high-dimensional smart city policies.
Bibri (2018) [8] took a position similar to that of Kourtit et al. (2017) [7] and explained that the IoT is an important element of the ICT infrastructure of smart cities and plays key roles for the analyses of big data. The author also examines the platforms capable of processing and analyzing data with installations of diverse kinds of equipment collecting big data for the construction of sustainable urban environments. Besides, the fields which could exploit big data are illustrated thereby. The fields comprise the traffic control and optimization of traffic signaling, an optimization and control of energy consumption complying with environmental protection regulations, control of air quality, control of buildings and facilities, and control of natural resources and wastes. In particular, the author emphasizes the collection and exploitation of the data of real-time mobility enabled by an advancement of ICT as a means to conduct an investigation into urban situations and phenomena in order to secure a sustainable urban environment beyond conventional limitations of the information collected through interviews, observations, or questionnaires, which are characterized by uncertainty, obscurity, and disagreement.
Giordani et al. (2015) [10] explained the data science that derives significant suggestions based on data, and indicated that infrastructure management is one of the target fields to which data science can be applicable. In particular, the authors identify the sectors of network-based energy, waterworks, and public transportation systems as key fields to which data science can be applied. The authors also commented on the necessity of systems to be exploited for making decisions through software systems capable of collecting and analyzing diverse data available from social network services as well as the unstructured data.
In the meantime, Giest (2017) [9] explained the decision making based on the assertion that big data can improve efficiencies of urban administration and resource consumption. The author also pointed out limitations in the implementation of policies due to the silo effect, which is ascribable to a lack of specialties in the people developing policies and a lack of communication between developers of policies. This results in inflexible reactions to problems. The author also offered case studies of policies established and implemented to reduce carbon emissions in metropolises in European countries. These highlight the potential of problems appearing in the process of developing policies based on data. The author commented on the need for standardization and integration of data to be collected from diverse sectors in administrative hierarchies, such as local and national governments. It is also necessary to use professional specialists capable of managing such data to solve such problems.
Researchers in prior studies have commented on improving efficiency of urban administration based on big data by employing conceptual explanations of effective reduction in times, costs, and ineffectiveness in diverse sectors comprising traffic control systems, energy management systems, policies development, implementation systems, building management systems, etc., ascribable to the analyses of broad spatial and temporal big data.
However, though these studies presented empirical evidence of the potential for improvement in efficiencies of urban administration through the use of big data, they are few. And they have only commented on the possibilities improvements, using bibliographic examinations or regional case studies. Currently, most empirical studies postulate the efficiency of urban administration based on the exploitation of big data but focus on improvement in technological efficiencies of systems or algorithms designed for the processing of big data, and they are mostly concerned with presentations of empirical analyses on the ways to reduce data processing times in systems or algorithms designed to reduce circuit load.
Most previous studies, which conducted empirical analyses of the efficiency of urban administration beyond the improvement in efficiencies of algorithms or systems, have delved into issues associated with the control of energy consumption. The studies conducted by Moreno et al. (2014) [11] and Mahapatra et al. (2017) [12] are representative of these. Moreno et al. (2014) [11] presented a platform using IoT sensor technology as a means of controlling indoor humidity and temperature in buildings according to varying positions of the buildings’ occupants. They demonstrated that this platform would allow the control of heating energy for each building. The authors employed the indoor space of a subject building as a test bed and demonstrated that IoT technology can reduce the level of energy consumption for the building by controlling the flexibility of the indoor temperature and humidity according to varying positions of occupants therein. They compared their results with those of conventional methods for controlling indoor temperature and humidity of a building uniformly.
Mahapatra et al. (2017) [12] and Moreno et al. (2014) [11] calculated the hourly demand for energy consumption in a day based on the data of unit amount of energy consumption and actual time of use of each home electronic device in a housing unit measured through sensors of IoT technology, and presented the methods to reduce the peak demand for energy consumption through the energy control system presented in the study.
In most instances, the authors have presented ways to raise the level of efficiency of the control of energy consumption and demonstrated the application of IoT technology to achieve this end. However, the authors have only rendered the possibilities of exploiting data collected through sensors of IoT technology but have not suggested how to use this exploitation to elevate the efficiency of energy consumption in the practical urban administration.
Most of the studies reported so far have either delved into issues focusing on the improvement of efficiencies of systems controlling big data or issues in the elevation of efficiency in urban administration through algorithms or systems. And yet, few studies have delved into quantitative empirical analyses of improvements in efficiencies of urban administration based on the use of actual database developed. Thus, the present study was intended to provide practical verification of the effects of urban administration, which were supposed to result from an exploitation of big data of the subject city, wherein urban administration systems are established and in actual operation. Predictions will also be made based on observations of the subject city in order to present the possibilities of efficient urban administration.
Overview of Project
The subjects of this study are the Daejeon Smart City Project (wherein the advanced information systems have been established and in operation) and the big data associated with the project. Daejeon consists of five administrative districts, with a total population of 1.5 million (2018). In Korea, the U-City projects have been promoted since the early 2000s as an implementation of policies developed for the introduction of smart cities. In the national R&D projects that began in 2013, the integrated platform of a smart city was introduced in Daejeon City, and the platform currently provides the city’s residents with integrated safety service [13]. The integrated safety service, applied to Daejeon, is a smart city service associated with the integrated urban administration center, police stations, fire stations, the socially vulnerable, the disaster safety information system, etc. It was established in Daejeon in 2015 as a demonstration. The service is currently connected to CCTVs installed in administrative organs in local government and in public agencies involving social safety (police, fire, disaster, socially vulnerable) and with information of administration and safety to secure efficient urban administration [13, 14].
Result and Discussions
Direct Outcomes
With the introduction of the integrated safety service, Daejeon harvested direct outcomes comprising 62 arrests of flagrant offenders, 790 cases including prevention of drunken people and guidance of adolescents, 1,980 cases of the provision of emergency video images of prevention of crimes, fire, rescue of people, etc., through an association with information systems and analyses of big data during the second half of 2016 (July ~ December, 2016) [13, 14]. The achievement based on the outcomes led to Daejeon winning the Annual Great Award for two consecutive years in the competition of excellent cases of the construction of smart city services held by the central government of Korea. In 2017, it was also recognized as the best project for public safety in smart cities in an evaluation hosted by IDC, the well-known global institution for market analysis [13].
Efficiency Analysis
The database of the monitoring of integrated safety service comprised the data collected during the period from November 26, 2015 to October 25, 2017 (23 months) in Daejeon [13]. It includes event data associated with activities of police stations, fire stations, disaster centers, and socially vulnerable. The data exhibit 14 attributes comprising the times of event occurrences, descriptions of events, places of events, times to an execution of necessary measures pertinent to events, etc. The statistical information associated with population, housing unit, and household were selected among administrative information to characterize each event for which the Population and Housing Census and Investigation on Household Trend of National Statistical Office (NSO), and the Population of Registered Residents of the Ministry of Public Administration and Security were used (Statistics Korea 2000, 2005, 2010, 2015; Statistics Korea 2015) [15, 16]. The databases of integrated safety service and other administrative efforts were readjusted according to regional codes with the aid of GIS.
Among the data in the database of the integrated safety service, the attributes determined to be unnecessary for the analyses conducted in the present study were removed through data cleaning of the event data. After this, data on 157,097 events remained. The deleted DB included 1,929 records comprised of outside of subject area (1,488) and address unknown (208) etc. The monthly average occurrences of each event per 1,000 citizens in Daejeon appeared in the following order: 4.329 (associated with fire stations; FS), 0.108 (associated with police stations; PS), 0.093 (associated with disasters; DS), and 0.006 (associated with the socially vulnerable; SV). From a regional standpoint, the events associated with fire stations appeared higher than other events in the East District (ED), whereas the events associated with police stations and with the socially vulnerable appeared higher in the Middle District (MD). The events associated with disasters appeared higher in the Daeduck District (DD). Total occurrence of events in regions appeared in the following order: West District (WD), Yusung District (YS), ED, MD, and DD, wherein the districts of ED and DD, comprising dense floating population and residents, showed high levels of event occurrence (Table 1).
Table 1.
Frequency of event (event/population1000⋅month)
With respect of the frequency of events in each time zone, the time zones of 9:00-11:00 and 13:00-15:00 showed the most frequent occurrence of events. The occurrence of events in the level of districts shows patterns quite similar to those of the occurrence of events throughout the entirety of Daejeon (Figure 2).
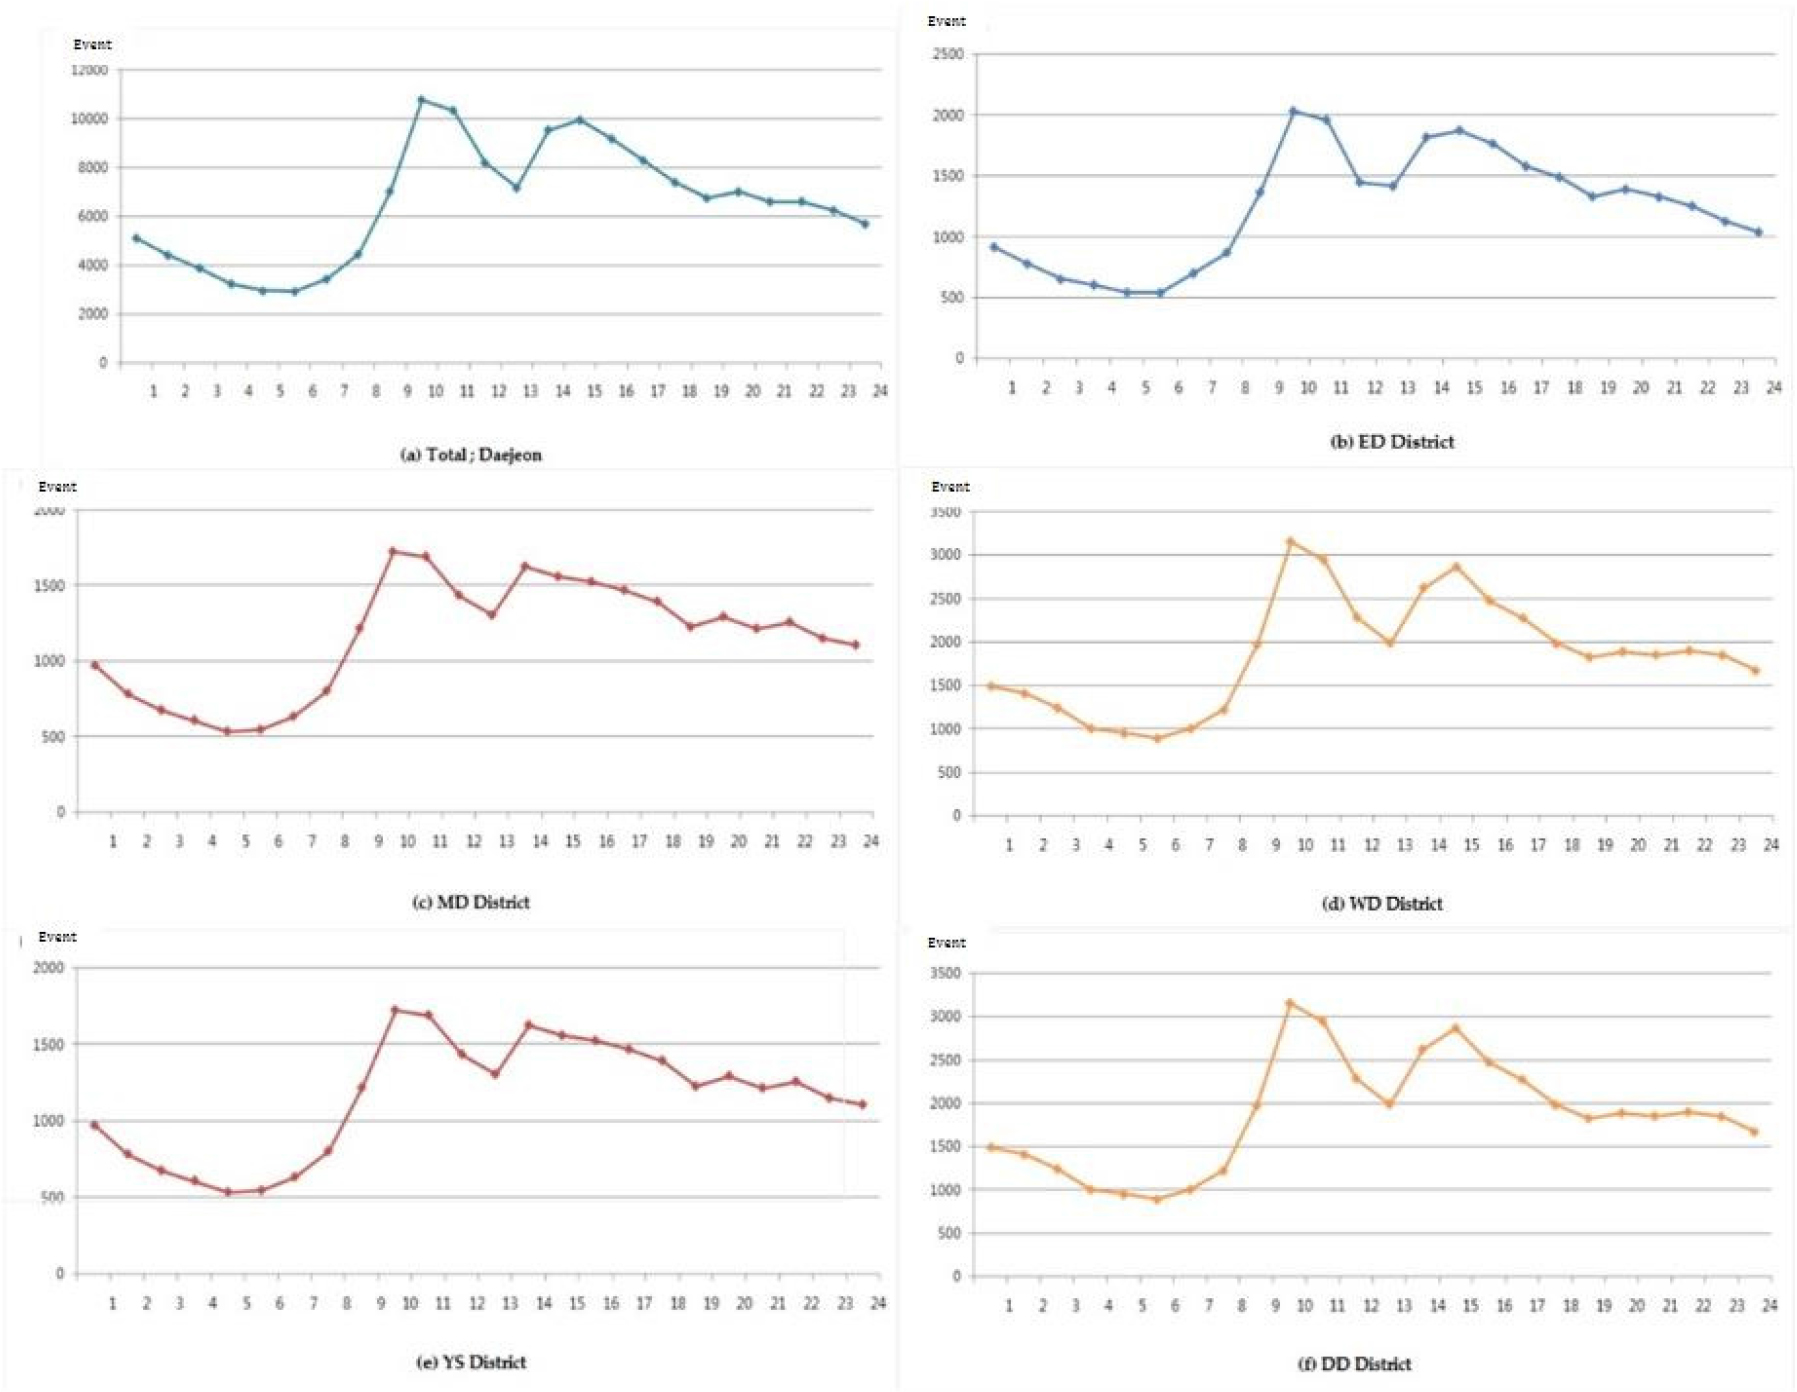
Among the entirety of events in the integrated safety service, the events associated with FS appeared in times zones of 9:00-11:00 and 13:00-15:00; the effects thereof were found absolutely dominant over the occurrence of all events. The events associated with PS appeared in the time zone of 14:00-17:00, while events associate with DS and SV were concentrated in the times zones of 13:00-19:00 and 10:00-18:00, respectively. The occurrence of events during weekdays (234.2 events/day) were more frequent than those during days of the weekend (200.0 events/day). From a seasonal standpoint, the occurrence of events in summertime was dominant because the events associated with fire stations are normally concentrated in summertime. The occurrence of events associated with PS was concentrated in spring, whereas the occurrences of events associated with disasters (DS) were concentrated in spring and summer. Most events relevant to the socially vulnerable (SV) were concentrated in summer.
Regional Categorization and Characteristics
The factor analysis and cluster analysis were carried out to distinguish types of the occurrence of events of the integrated safety service. The confirmatory factor analysis was carried out in this study, for which the principal component analysis and varimax rotation were employed. An exploratory factor analysis of the sub-items of the characteristics of event occurrence was carried out, by which the types of occurrences of events were divided into those associated with police stations (PS) and fire stations (FS). The factor loadings of sub-factors belonging to the two factors, which were used as factors associated with event occurrence of Daejeon, mostly exceeded 0.5, showing a very large significance with the accumulated variance of 72.0%, a very high explanatory power (Table 2).
Table 2.
Categorization of event characteristics variables of Daejeon
The scores of factors, derived from factor analysis in association with the occurrence of events were used as variables to conduct the K-means cluster analysis, the method of non-hierarchical clustering. Through the cluster analysis, all 79 Dong (the administrative neighborhood) in Daejeon were arranged in the nine clusters by crossing frequencies of events associated with PS and FS. As a consequence, the eight regional categories were matched with the districts, except for the Group D of the event occurrence associated with PS of middle and high of the event occurrence associated with FS. With respect to the characteristics of the occurrence of events in the 79 Dong of Daejeon, the category of Group I (38.0%) of low frequency of occurrence of events associated with both the PS and FS, and the category of Group F (30.4%), the frequency of mid-level of occurrence associated with police stations and of higher level of frequency of occurrence of events associated with FS, occupies the majority. This suggests that the 30 Dong (38%) are the area of low frequency of occurrence of the events associated with PS and FS, wherein the 19 Dong of dense population of residents and the 10 Dong of a larger number of housing units than that of CCTVs are dominant (Table 3).
Table 3.
Types of regional characteristics in Daejeon and distribution of groups
Discussion
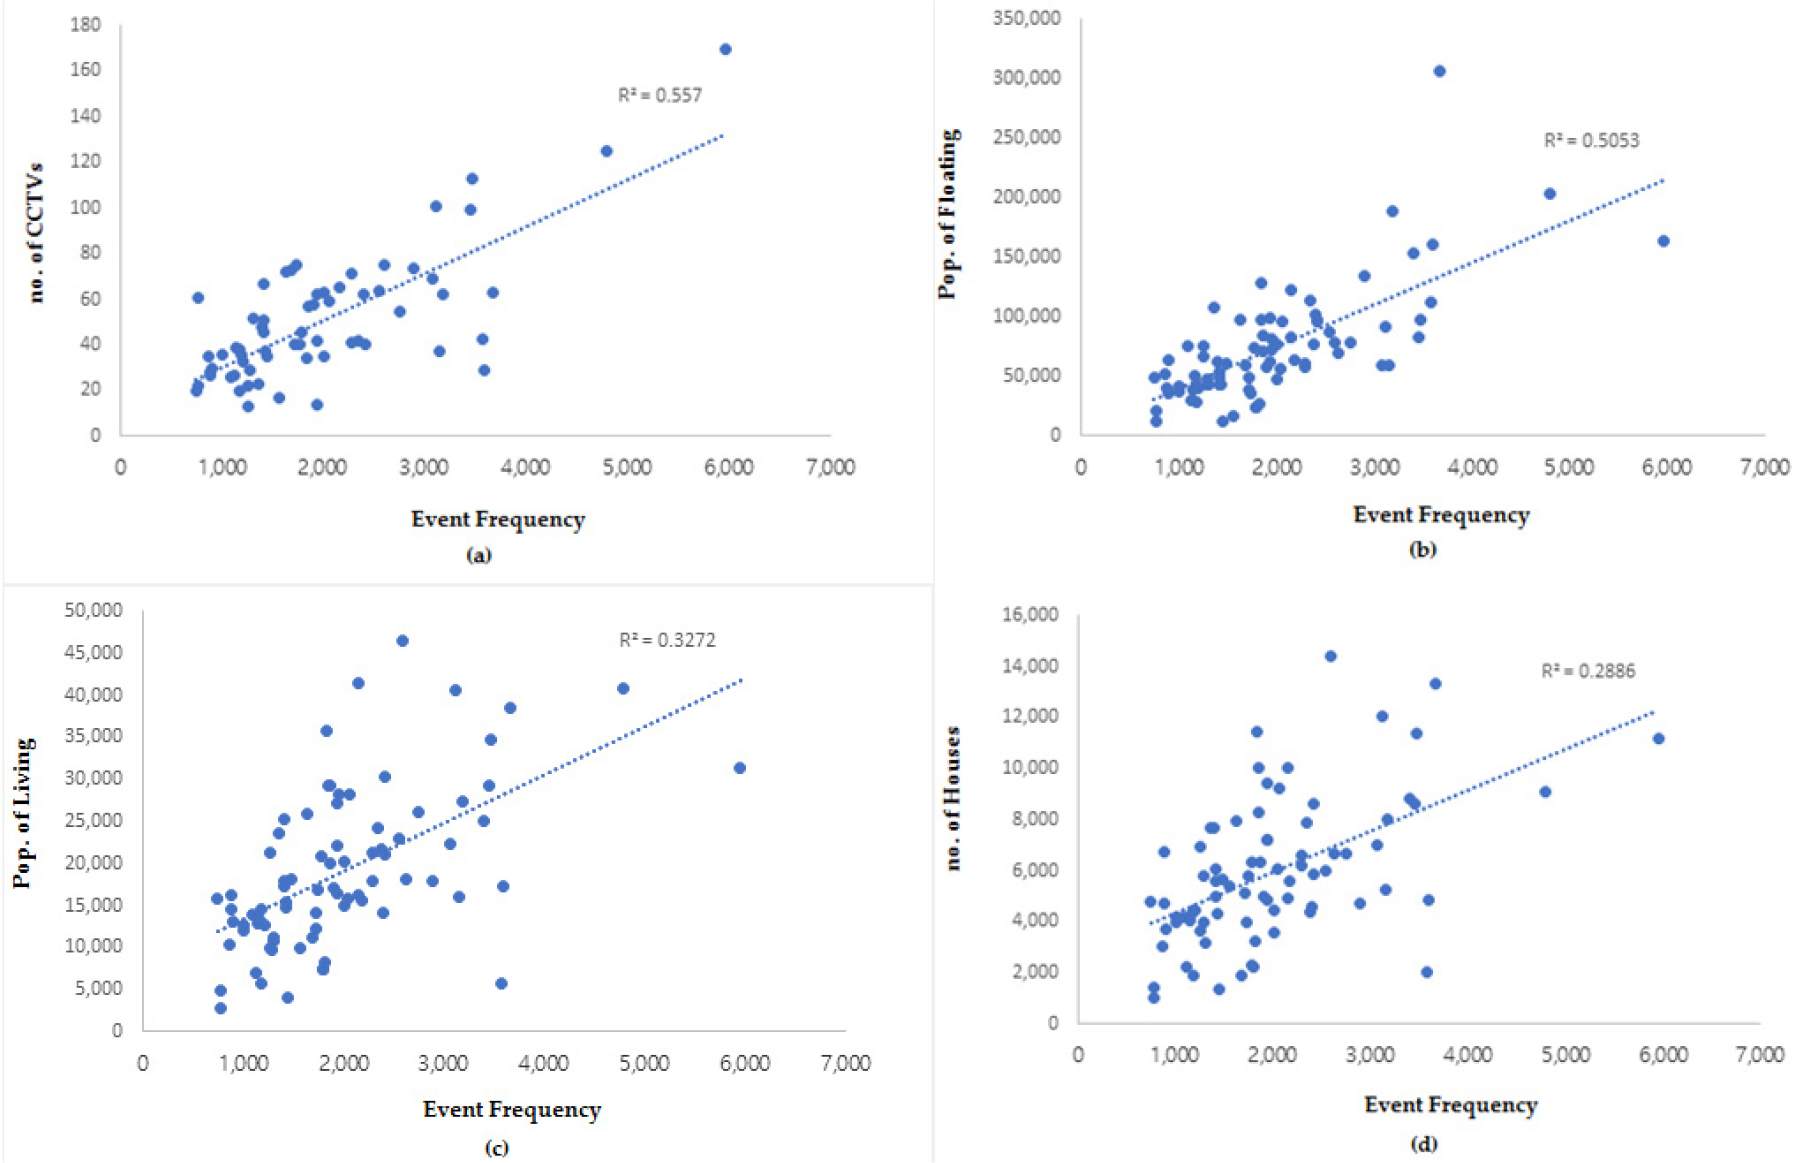
This study analyzed the dispersion of factors associated with the frequency of occurrence of events. As illustrated in Figure 3, the factor with the greatest impact was the number of CCTVs’ (R2=55.7); this was followed by the number of floating population (R2=50.5), number of resident population (R2=32.7), and number of housing units (R2=28.9). The factors affecting occurrence of events were analyzed, and the number of housing units was more influential than the number of CCTVs. This suggests that the number of housing units is higher than the number of CCTVs and would therefore predict a higher probability of occurrence of events. Next, the number of floating population comparing to the number of CCTVs also appeared influential over the frequency of occurrence of events. Since the number of floating population is higher than the number of CCTVs, it would predict a higher probability of occurrence of events. These results suggest that the increase in resolution of CCTVs would decrease the level of probable occurrence of events associated with PS (Figure 3).
In the case of time series data having shapes of either the AR(p) model or the MA(q) model, the application of the ordinary time series autoregressive moving-average (ARIMA) model would be enabled. AR model takes the regressive form of time series data. The model can explain the structure of time series data most intuitively. Contrasting to the AR model, the MA model (moving average process) can be expressed as a weighted linear combination of the present and past white noises.
Here, denotes the white noise process of mean is 0 and variance is .
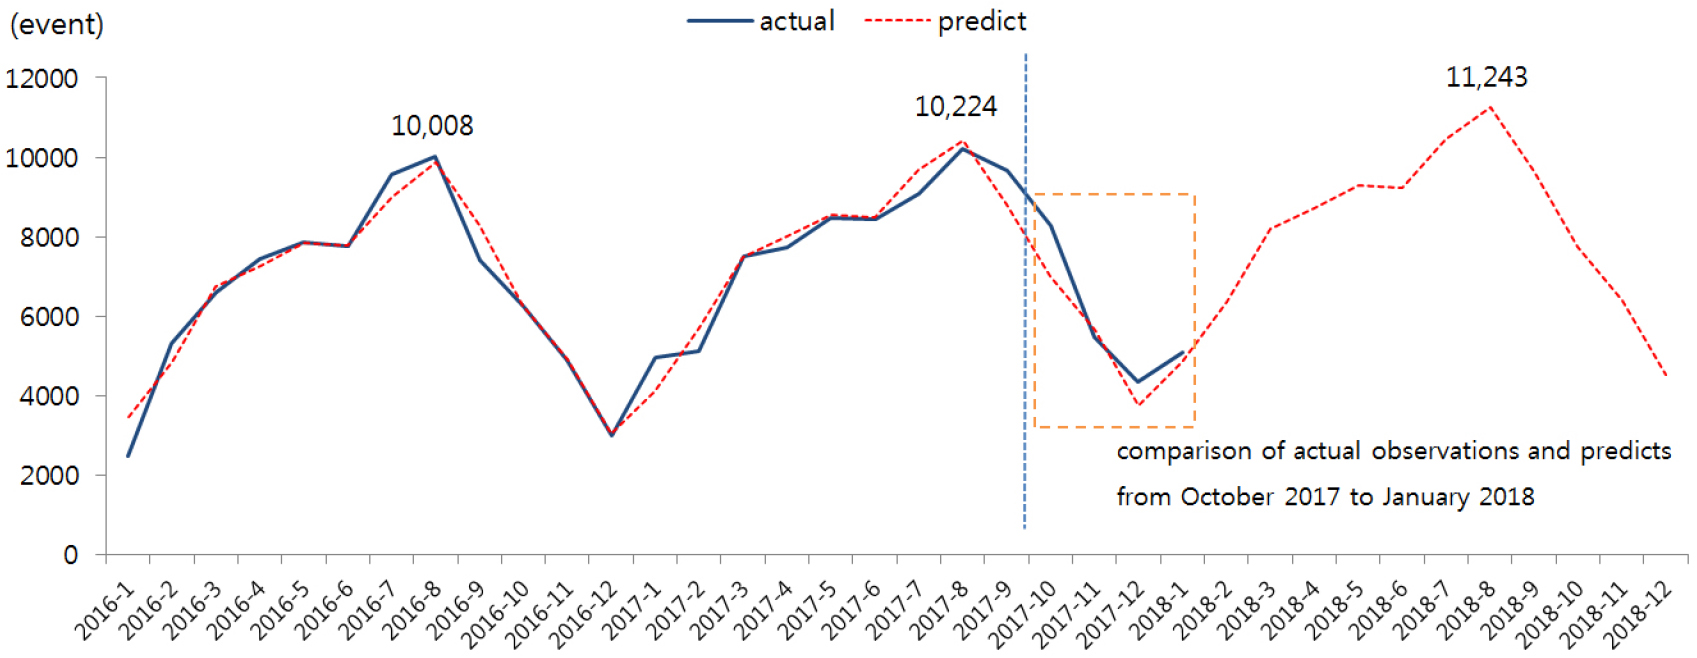
For the monthly time series analysis on the number of occurrence of events, the data collected during the interval from January 2016 to September 2017 were used. The data after October 2017 represent future predictions. The actual observations and predictions until January 2018 were compared to verify the accuracy of the model. This suggests the prediction of an occurrence of events would be enabled through time series analyses of big data associated with the integrated safety service occurring in Daejeon. The predictions of times and places of the occurrence of events derived from the model can be exploited to adjust behaviors of members belonging to the administration of such events (including police stations, fire stations, monitoring personnel etc.), as well as taking effective proactive measures pertinent to respective events. The occurrence of events in Daejeon was predicted through the ARIMA model. The level of accuracy of the prediction approximated 90% (Figure 4).
Conclusions
In this study, the cases associated with information systems currently in operation in Daejeon were employed to analyze the characteristics of the smart city and to verify the feasibility of its efficient administration. Unlike previous studies that only presented conceptual explanations of smart cities, this study verified whether the basic goal of smart cities is possible to achieve administrative efficiency through urban information.
The subject area of Daejeon currently provides its citizens with the safety and security services associated with information systems integrated into the network comprising police stations, fire stations, the integrated urban administration center, etc., through the program of integrated safety service introduced in 2015.
Daejeon currently reacts to accidents promptly through the exploitation of different information systems linked to each other. The information systems also support efficient urban administration. Raw data collected for the present study spans the interval from November, 2015 to October, 2017 (700 days) [13, 14]. The data associated with a total of 157,097 events were collected through the data cleaning process for the actual analyses conducted in the present study. Results obtained from the provision of integrated safety services were examined. It was found that events were more frequently found in the areas of higher levels of the resident population and floating population and of a dense distribution of CCTVs that corresponds with the density of housing units. The dispersion of the frequency of occurrence associated with relevant variables was analyzed. The level of correlations in between was found as in the following order: number of CCTVs, number of floating population, number of population of residents, and number of housing units.
The occurrence of events in Daejeon was predicted through the ARIMA model. Thus the prediction of times and places of events through the analysis of big data of Daejeon provides the city with useful information pertinent to urban administration. Further, the provision of useful information demonstrates that the analysis of big data associated with information systems installed in smart city facilitates efficient urban operation and administration.
This study used the ARIMA prediction models of daily or seasonal variations in the occurrence of diverse events associate with the integrated safety service of Daejeon. However, the short period of the study made it impossible to accumulation all of the desired data. This limitation in the prediction analyses left us unable to secure a high level of significance in predictions. Future time series-analyses to be conducted with the data accumulated during a longer period of time are thus expected to yield more significant predictions.
This study is based on city data up to 2017, and there is a limitation in not being able to grasp the future situation. Urban data is a fundamental asset for discovering and demonstrating smart city solutions. Subsequent studies should be conducted based on longer-term big data, and future predictions attempted in this study as well as current status analysis are valid. A variety of machine learning and artificial intelligence analysis will be used to predict the future of cities.
