

Introduction
LITERATURE REVIEW
Proposed Methodology and Algorithm
Results and Discussion
Future Scope and Limitations
CONCLUSION
Introduction
Breast cancer (BC) is a hereditary disease marked by unchecked cell proliferation in the breast tissue. While 15% of cases of BC start in the lobules of the glandular breast tissue, the bulk, or around 85% of cases, start in the epithelial cells lining the ducts [1]. One of the main causes of female mortality is the metastasis of breast cancer to other regions of the body. The American Joint Committee on Cancer (AJCC) developed the Tumour Nodes Metastases (TNM) classification, which divides breast cancer into four distinct phases based on tumor size (T), lymph node involvement (N) and presence of metastasis (M) [2]. In recent years, there has been a growing emphasis on using sophisticated imaging methods to improve the accuracy of breast cancer diagnosis and therapy.
To increase recovery rates and lower morbidity and mortality, early detection and diagnosis are essential [3]. Mammography is a common technique for locating breast cancer cells in the early stages. However, radiologists face a time-consuming and difficult tasks every day that might result in incorrectly optimistic or negative findings while evaluating a high volume of pictures [4].
Mammography is a popular diagnostic tool for finding breast cancer, especially in thick breast tissue [5]. Although mammography has significant restrictions interpreting mammographic images can be a time-consuming and difficult task that could result in both false positives and false negatives. It is nevertheless quite sensitive, with a cancer detection rate of about 90%. Clinicians can obtain the data they need from accurate segmentation of mammography pictures to make an educated diagnosis and choose the best course of therapy [6, 7, 8, 9].
Segmentation is important process in breast mammography analysis because it helps with the detection and categorization of breast cancer abnormalities. Accurate mammographic image segmentation enables the identification and separation of specific regions of interest, such as breast masses or microcalcification clusters, which is critical for the early detection and diagnosis of breast abnormalities, including breast cancer [7, 8, 9, 10, 11, 12, 13, 14]. The efficacy and precision of cancer analysis may be greatly improved in the case of breast cancer, that is the major reasons of female death due to carcinoma worldwide. Researchers have found a few risk factors for breast cancer, including alcohol intake, thick breast tissue, radiation exposure, and lifestyle variables, even though the exact reasons are not yet fully understood. A low-cost point-of-care diagnosis is especially important in poor countries and rural areas where breast cancer death rates must be reduced. Overall, segmentation is a crucial component in the analysis and diagnosis of mammary cancer. Feature measurements, cancer diagnosis precision can be enhanced by collecting pertinent data from the area of interest [14, 15, 16, 17, 18, 19].
We used the MIAS database, a useful tool developed by renowned UK research teams with a genuine interest in understanding mammograms, for this work. The database includes 322 digital films that were created by digitising films received from the UK National Breast Screening Programme using a state-of-the-art Joyce-Loebl Scanning microdensitometer which includes pixel edge measuring 50-micron. With a pixel edge of 200 microns and a dimension of 1024 by 1024, the photographs have a high resolution. However, it is essential to preprocess the photos before performing segmentation because of the existence of noise, blurring, and poor contrast. We used a variety of segmentation approaches, such as those for recognising masses, microcalcifications, pectoral muscles, and lesions, to overcome these difficulties. The sample were filtered before segmentation to eliminate any superfluous patient information and to improve the contrast and clarity of the images in line with predetermined criteria. To identify growth patterns, a few characteristics includeing tumour size, shape, texture, intensity, and grey level histogram were thoroughly examined [17, 18, 19, 20, 21, 22, 23, 24, 25, 26, 27].
The photos in the MIAS database exhibit noise and low contrast, as is frequently seen in mammographic images, making it challenging to discern between benign and cancerous tissue. Therefore, to differentiate between the two with better precision, we combined the Otsu picture segmentation methodology with additional cutting-edge methods. The importance of our research resides in its capacity to greatly better the diagnosis of breast cancer through the improvement of mammographic image segmentation accuracy. This improvement has the potential to enable healthcare professionals to make more knowledgeable judgements, leading to improved patient outcomes and decreased rates of morbidity and mortality related to breast cancer [19, 20, 21, 22, 23, 24, 25, 26, 27, 28, 29, 30, 31, 32, 33, 34, 35].
Section I give a brief introduction about the segmentation technique, the database used and diagnostic tool mammography. Section II analyses various developments and work done in this field along with their results. Section III discusses the proposed methodology and algorithm. Section IV is all about the results and its brief discussion. Section V gives the conclusion.
LITERATURE REVIEW
This section will analyse and examine current developments and methods in mammographic image segmentation.
Background: The job of segmenting breast tissue from mammographic pictures is difficult because of the noise, poor contrast, overlapping structures, and various lesions’ appearances. To address these issues, several studies have concentrated on creating reliable segmentation algorithms. Conventional Segmentation Techniques Earlier research segmented breast tissue using conventional image processing methods. These techniques included watershed transform, active contour models, region expanding, and thresholding. For instance, [3] used morphological procedures and a region-growing strategy to segment masses in mammograms.
Machine learning techniques, in particular deep learning models, have demonstrated impressive performance in mammographic picture segmentation in recent years. The capacity of convolutional neural networks (CNNs) for finding complex patterns and characteristics has led to their widespread use. For precise breast tumour segmentation, [21] suggested a fully convolutional network with connections that skip. Without requiring user annotations, unsupervised segmentation approaches try to autonomously segment regions of interest. With competitive results compared to supervised approaches, [21]proposed an unsupervised deep learning framework based on adversarial training for breast lesion segmentation. Accuracy of segmentation can be increased by combining data from various imaging modalities. By combining mammographic and ultrasound pictures with a multi-attention network, [21] suggested a multi-modal segmentation strategy. Mammographic image segmentation challenges have drawn attention to transfer learning, which makes use of pre-trained models on huge datasets. By adjusting a pre-trained CNN, [12] demonstrated good results when a transfer learning framework was developed for segmenting breast tumours. To train segmentation models with low or noisy annotations, weakly supervised learning approaches are used. By using image-level labels to direct the segmentation process, [12] demonstrated a weakly supervised learning framework recommending breast mass segmentation in mammograms. Variational autoencoders (VAEs) and generative adversarial networks (GANs) have been used to segment mammographic images. To segment breast tumours accurately and provide realistic tumour representations, [12] suggested a VAE-GAN-based method.
These most recent developments in mammographic image segmentation articles show how work is still being done to increase the precision and effectiveness of breast tissue segmentation, which will ultimately help in identification and diagnosis of breast cancer beforehand. Table 1 summarizes the increasing frequency of examining breast cancer over the decade.
Table 1.
Literature Review
| Author | Database | Techniques used | Findings | Performance | Remarks |
|
Anaya-Isaza, A. et al. (2021) [8] |
CBIS -DDSM |
Segmentation: U network |
Each pixel is categorized into potential interest items. |
Overall accuracy: 99% |
One of the most well-liked networks for given performance is UNet. |
|
Divyashree, B.V. and Kumar, G.H. (2021) [9] |
MIAS and CBIS-DDS M datasets |
Gradient weight based, Breast boundary segmentation and segmentation using XOR operator |
The model carries out background suppression, pectoral muscle and breast region segmentation |
Overall accuracy of MIAS and CBIS-DDSM: are 94.12% and 90.38% respectively. |
Even though these two measures are independent of one another, the accuracy of recognising certain segments within a mass is less accurate than the overall detection. |
|
Nagalakshmi, T. (2022)[36] |
MAIS database |
Clustering analysis, threshold method, region based segmentation and edge based detection |
EnsembleNet structure has been presenting partition in PM region from the remains of the breast region in mammog raphic images for the categorization of the cancer in breast. Model focus on mammographic preprocess and normalization into the DL framework. |
Overall accuracy: 96.72% |
To improve the accuracy of breast tumour categorization, it is essential to consider a variety of subjective elements related to a doctor’s experience. Consequently, future research will concentrate on obtaining more traits for the categorization of breast tumours. |
|
Maqsood, S. et.al. (2022) [10] |
DDSM, INbreast, MIAS databases |
contrast enhancement, TTCNN, feature selection, CLAHE, GoogLeNet, DCNN, transfer learning, and feature fusion. |
Good accuracy and is more capable of detection and classification of breast mammog raphic and outperformed the other system. |
DDSM-99.08% INbreast-96.82% MIAS-96.57% |
The DL approach has introducing breast detection and classifying for enhancement in result and has became an important part of computer aided diagnosis system. |
|
Ranjbarzadeh, R. et al. (2022) [11] |
MIAS and DDSM databases |
Region-based, RNN, fuzzy C-mean, thresholding segmentation, and CNN |
Image enhancement techniques are being investigating for improvement and computation times. |
Overall accuracy: 93.6% |
In this approach, a multi route CNN is been implementing that enabled the structures to find distinct in the breast tissues and also used some data augmentation approach which will improve the result of the models. |
|
Yang, X. et al. (2023) [12] | Not mentioned |
Multi level threshold segmentation framework |
Outperformed other methods in terms of segmentation accuracy, specificity and | Not mentioned |
suggested a potential method for segmenting breast cancer pictures, which enhances the therapy and diagnostics of the disease. |
|
Juhong, A. et al. (2023) [13] | Not mentioned |
Super-resolution and segmentation deep learning |
superior to other cutting-edge techniques in terms of precision and effectiveness for the examination of breast cancer histopathology images. | Not mentioned |
Presented a promising approach for automated analysis of breast cancer histopathology images, which could potentially enhance the effectiveness of breast cancer diagnosis and treatment. |
|
Xing, J. et al. (2023) [14] | Not mentioned |
Elite Levy Spreading DE ABC Shrink wrap |
Achieved higher accuracy in segmenting breast cancer images with respect to others proposed methods. The process is also reliable and efficient in terms of computing against noise and other types of interference. |
The method showed a mean Dice similarity coefficient of 0.91, indicating high segmentation accuracy. |
The research emphasises the significance of precise picture segmentation in the detection of breast cancer and the possibility of the suggested approach to enhance patient outcomes. Further testing and validation on larger datasets are recommended. |
|
Mahmood, T. et al. (2020) [15] |
MIAS, DDMS, INBreast, BCDR database |
Data augmentation, ROI segmentation, resizing, noise removing, image enhancements, and cropping |
Tells how development of DL techniques has improved the segmentation and categorization of breast anomalies, offering radiologists and researchers invaluable support. |
Overall accuracy: 89.04% |
For training, deep learning techniques need many labelled images. Data augmentation techniques are therefore widely used to overcome the restricted availability of data. |
|
Moghbel, M. et al (2020)[37] |
MIAS, CBIS- DDSM, INbreast, BCDR database |
ROI, Watershed method, segmentation resizing, K-Means, SVM |
Different methods for the breast area and pectoral muscle segmented images using FFDM and SFM mammography were addressed and compared in this work. |
Overall accuracy: 95.78% |
Yet space for advancement, particularly in the pre-processing and picture enhancement processes where the majority of methods miss the crucial procedures for guaranteeing a seamless boundary segmentation. |
|
Chinnasamy, V.A. et al. (2020)[38] |
MIAS, DDSM and BCDR database |
Median filtering, TP, TN, FP, FN, fuzzy C means clustering, OFMMNN, and grey wolf optimization. |
Breast cancer detection study is performed with the aid of the fuzzy min-max neural network technique and with this aid we will identify a breast cancer region. |
Overall accuracy: 98.21% |
The efficiency of the optimization of images is very high .Presented very better result and the segment of input mammographic image very accuracy. |
Our work revolutionizes segmentation by synergistically integrating CLAHE, Morphological operations and fuzzy C-means achieving more accuracy. In contrast to existing work, we prioritize preprocessing to remove noise and enhance contrast hence enhancing precise segmentation. When assessed using the MIAS database our method outperforms others by giving better sensitivity, specificity, and accuracy.
Proposed Methodology and Algorithm
This work’s major objective is to provide a fresh and distinctive method for mammography segmentation that might improve the detection of breast cancer. The suggested method creates a thorough and reliable segmentation procedure by hybrid combining several operations and filters. An elaborate assessment framework is used to verify the veracity and efficiency of the produced approach. Sensibility, specificity, positive predictive value (PPV), negative predictive value (NPV), false negative rate (FNR), false positive rate (FPR), false discovery rate (FDR), false omission rate (FOR), Matthew’s correlation coefficient (MCC), informedness, and markedness are some of the numerical parameters that are incorporated into this framework. The reliability and correctness of the suggested approach are ensured by these indicators, which allow for a full evaluation of the segmentation findings. The flowchart follows a thorough approach that uses the proper mathematical operations to support each step. The suggested technique created to segment mammograms is detailed in the flowchart in Figure 1.

The algorithmic explanation of proposed research work is stated below:
1.Create the application’s GUI.
2.Take Image (I) and resize it to 30% of its original scale using “imresize”.
3.Use a green channel complement operation to change the input picture so that the green channel is inverted using “imcomplement” function.
4.Apply the Contrast Limited Adaptive Histogram Equalisation (CLAHE) method to the changed picture to increase contrast.
5.Specify an 8-neighborhood organising element for morphological procedures.
6.Apply morphological opening using the structural element to the improved picture.
7.Remove the optical disc and use a 2D Median Filter to enhance the image.
8.To get the final corrected image, remove the background from the filtered image and make any necessary adjustments.
9.Double-precision the corrected picture and begin segmenting it using the Fuzzy C-Means (FCM) clustering technique.
10.Use a disk-shaped structuring element to remove background artefacts to prepare the picture for segmentation.
11.Remove linked tiny items with less than 30 pixels from the segmented picture to create a binary image.
12.Use the GUI’s specified axis to display the segmented picture.
13.Determine the values of the clusters that the segmentation method produced.
14.Calculate the input picture’s and the segmented image’s image vectors.
15.Establish default settings and look for mistakes.
16.By classifying and examining the differences between successive points, determine the threshold values between the data points.
17.Based on the segmented picture, assess the sensitivity and specificity of each threshold value.
18.To assess each threshold point’s performance, measure the distance between it and the ideal point (0, 1).
19.The ideal threshold position, sensitivity, specificity, area under the curve, accuracy, positive predictive value, negative predictive value, false negative rate, false positive rate, false discovery rate, false omission rate, Matthews correlation coefficient, informedness, and markedness should all be determined to aid in further analysis and evaluation.
Results and Discussion
The image processing workflow that is being given shows how each step helps to improve and analyze the mammographic image. A thorough analysis of breast tissue structures and anomalies is made possible by the combination of color channel manipulation, contrast augmentation, morphological operations, and segmentation, ultimately assisting in the early detection and diagnosis of breast-related medical disorders. These methods establish the groundwork for additional quantitative analysis and assessment of the image’s diagnostic potential, which are discussed in the figures and studies that follow.
Figure 2 shows the results of applying the created method to the input image “mdb001.pgm” from the MIAS (Mammographic Image Analysis Society) database.
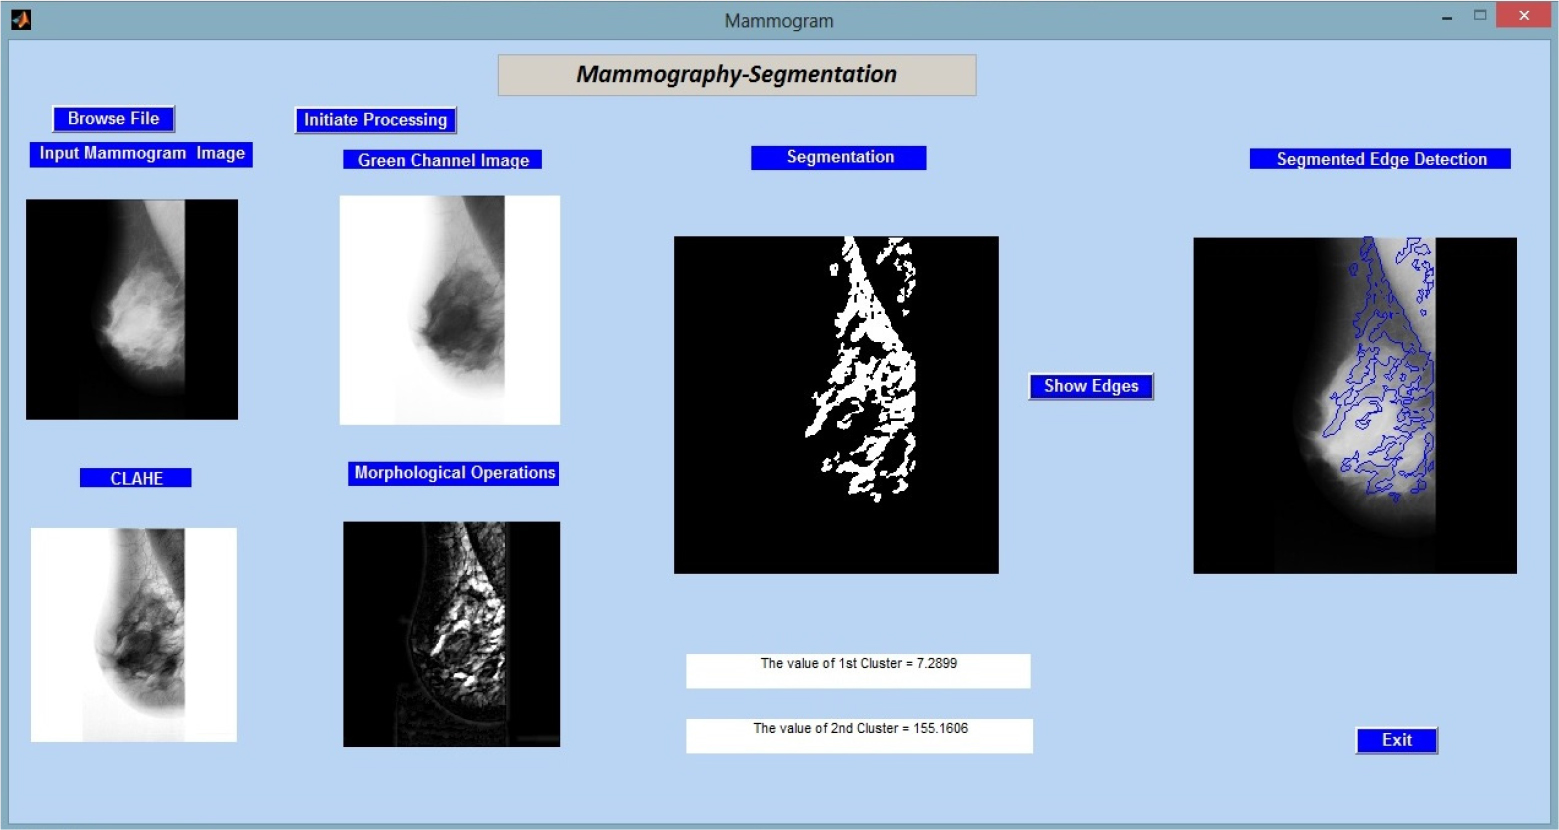
In Figure 3, we proceed to assess the proposed methodology by using it to analyse “mdb002.pgm,” a different image from the MIAS (Mammographic Image Analysis Society) database. Key quantitative data, particularly the cluster values, which shed light on the make-up of the segmented regions, are displayed alongside the results of the image processing processes.

Figure 4 shows the another image named “mdb003. pgm” from the same database taken as feedback for the created methodology.
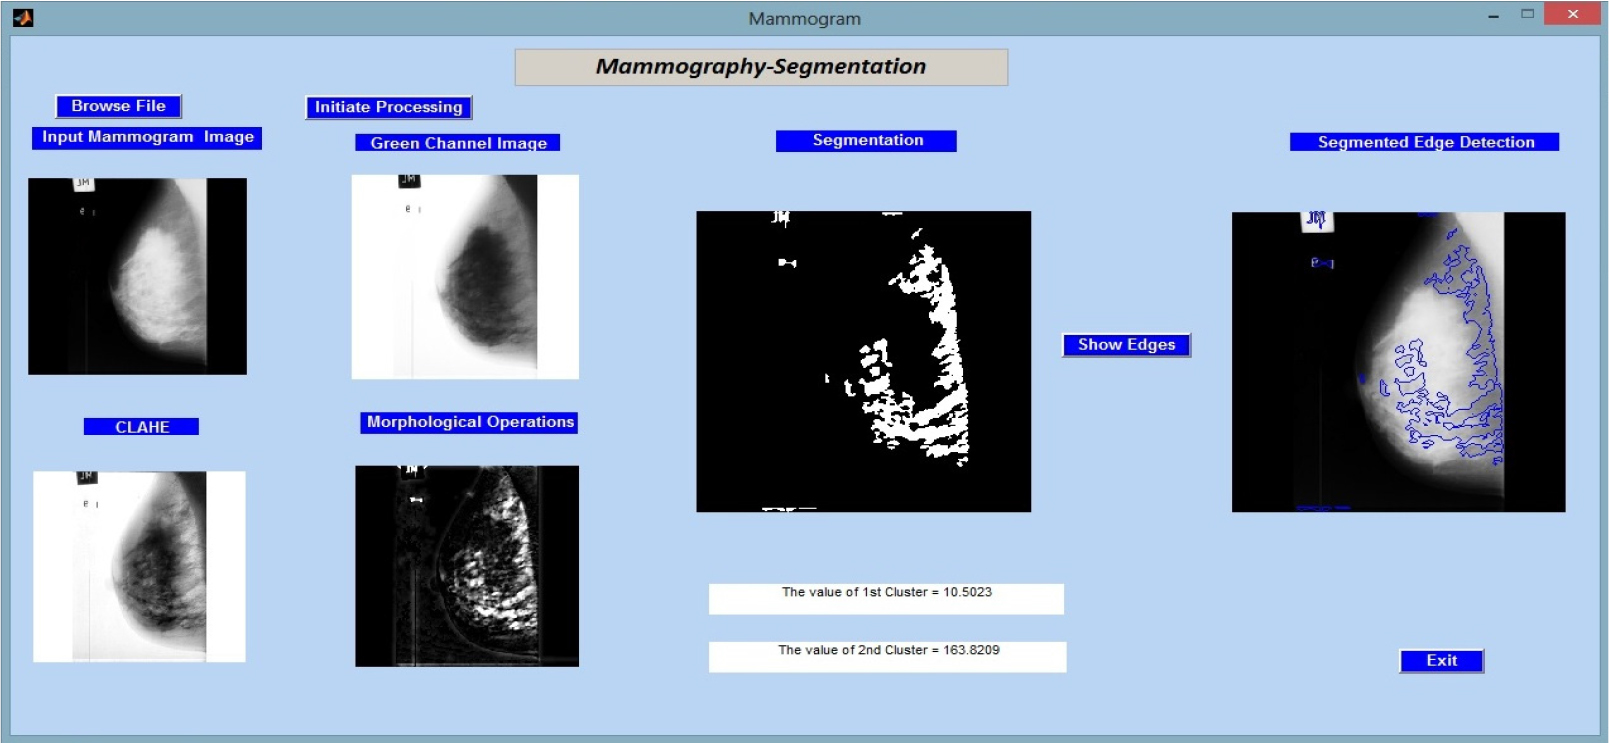
Figure 5 shows the another image named “mdb004. pgm” from the same database taken as feedback for the created methodology.

As shown in Table 2, the initial collection of fifteen images from the MIAS database was used for mammography segmentation along with the accompanying measurements acquired for sixteen different parameters.
Table 2.
Table shows the obtained readings of various parameters on different images from MIAS database
First, accuracy (ACC): The proportion of cases that are correctly classified to all instances constitutes accuracy. The nomenclature used for the images in the paper is same as they are in the MIAS database for the convenience of the researchers.
The results obtained from applying the suggested algorithm to a set of mammographic images show promising breast image analysis capability. The programme successfully segmented breast tissue structures across many images (mdb001 to mdb015) and offered helpful diagnostic metrics. It is noteworthy that it attained good specificity values, which show a low false positive rate, which is crucial in assessing breast health. The estimated area under the ROC curve (ARoC) also reveals that there is good discriminating between normal and pathological regions in the images.
The calculation of sensitivity and specificity was performed using the results obtained from the Fuzzy C-Means (FCM) clustering algorithm. The segmented images underwent the thresholding technique in order to categorise pixels as either cancerous or non-cancerous. The determination of the threshold value was achieved using an iterative procedure with the objective of optimising both sensitivity and specificity. The threshold was systematically manipulated within a predetermined range, and for each threshold value, the metrics of sensitivity and specificity were computed in the following manner:
The sensitivity, also known as the true positive rate, is a measure used to evaluate the accuracy of a diagnostic test or model. The sensitivity metric quantifies the accuracy of the segmentation approach by determining the proportion of true positive cases that are accurately detected. The sensitivity was determined by :
{Sensitivity} = {True Positives}/{{True Positives} + {False Negatives}}
Specificity, also known as the true negative rate, quantifies the accuracy of accurately identifying negative situations out of the total actual negative cases. The specificity was determined by:
{Specificity} = {True Negatives}/{{True Negatives} + {False Positives}}
The threshold value that was chosen for the final analysis was the one that achieved the optimal trade-off between sensitivity and specificity.
These findings highlight the algorithm’s potential as a powerful tool for the early detection and diagnosis of illnesses connected to the breast. To determine its clinical value, additional research and validation may be required.
Future Scope and Limitations
Our research employed the MIAS database, which is frequently used but on a limited dataset. A more diversified and broad dataset could be collected from multiple institutions having various types of lesions, tissues and imaging conditions could improve model generalizability in future studies. The processing requirements for the Fuzzy C-Means clustering approach were challenging, especially with large datasets. The inability to experiment with more complicated models was hampered by limited computational resources.
Advances in computer technologies may make it easier to investigate advanced algorithms and larger datasets. Using hybrid models like combining Fuzzy C-Means with other clustering or classification techniques can help to further enhance accuracy and robustness overcoming the limits of fuzzy C-Means algorithm. Clinically validate segmentation results with medical professionals. Radiologists verify the algorithm’s clinical accuracy, proving its practicality.
Addressing these constraints and pursuing these future research paths can make the suggested mammographic image segmentation approach more robust and widely usable, promoting early breast cancer diagnosis.
CONCLUSION
The research emphasizes the value of precise segmentation of breast image resulting in accurately categorizing breast cancer. CLAHE and morphological operations performed in fusion in research has enhanced the accuracy of segmentation. A dataset made up of fifteen photographs from the MIAS database is used to rigorously assess the suggested method’s efficiency. The results show that combining several methodologies improves segmentation accuracy, emphasising the value of precise segmentation in the categorization of cancer. Improved segmentation results are also aided using sophisticated pre-processing techniques. The dataset should be enlarged to include pictures from other databases, the number of pertinent factors should be increased, and additional breast imaging modalities including ultrasound and thermography should be included. These developments might progress the discipline of mammography segmentation, allowing for a more thorough and accurate diagnostic procedure. The scientific community benefits from this research since it lays the groundwork for future inquiries into the identification of breast cancer and opens the door to more sophisticated segmentation techniques.
