

Introduction
Previous Studies
Experimental program
Test Results and Discussions
Modelling Study:FEA models
Conclusions
Further Scope of Work
Introduction
Steel angle sections are of both equal leg and unequal leg types, while fabricating steel structures angle sections are invariably used. Connection of a steel angle section to another angle or some other section is with either of the two legs of angle section. In this way one leg remains unconnected which is outstanding leg of angle, steel structures are designed in such a way that sectional area of any member bears and distributes the load to adjoining members. Due the connection of single leg with adjacent member load is transferred from connected member to connected leg directly which is further carried to the unconnected portion of outstanding leg. In this way stress distribution in the outstanding leg is delayed which is known as shear lag also load carrying capacity of angle section remains underutilized to some extent.Tension members in steel structures are major elements assembled for the design of structure; sections such as angles, channels, tees are most commonly used in fabrication and erection. Axial tension is mainly resisted through these members although flexure load is also restrained in some cases. For bolted connections ultimate capacities of tension members is influenced mainly by shear lag, load development along the bolt line and stress concentration in the periphery of bolt holes.Stress concentration near the edge of bolt holes in the connected leg of angle sections also causes uneven distribution of load across the section. Hence the load transfer path which follows bolt lining in case of bolting does not pass through the centroid of section, in such situation secondary bending could be induced leading to decrease in the full capacity of section. Hence it becomes difficult to accurately find out the effect of shear lag and separate it from reduction in strength due to secondary bending. In general design practice a common factor is considered to account the effect of both. Also stress concentration in the circumference of bolt holes cause reduction in strength of section resulting in failure of the same prior to its full restraining capacity. This work is concentrated to study the effect of shear lag in bolted steel angle section which is subjected to tension. Different research outcomes derived ultimate behaviour of steel tension members which have been recommended in codal specifications of AS4100-1998 [1] BS5950- 1:2000 [2] EN1993-1-8:2005 [3] CSA/CAN-S16-09 [4]. A conservative approach for obtaining design strength of tension member is to calculate ultimate/rupture strength of net section and yield strength of gross section. Most of the design equations which consider shear lag effect is based on experiments performed earlier on tension members with bolted connections still there is difference of results in many cases which may be due to specific distribution of internal stress in particular condition, hence it is difficult to come out with a general equation for all type of connections.It was therefore required to perform experiments in order to find the accurate failure pattern and values of resistance, factors which influence shear lag like edge distance, pitch, end distance, length of connection were more emphasized and results were recorded for each full-scaleexperiment. Specimen were fabricated from both equal angles and unequal angle sections; bolt and hole size were kept same in all samples. Finally, the results of current study from experiments, simulation and available data from other published work of researchers was analysed for its reliability and recommendations for consideration of shear lag influencing factors in the method of design were proposed.
Previous Studies
Stress distribution behaviour of tensile connections has been studied by many researchers.Jiang et altested 13 bolted angle specimens, out of which eight sections were fabricated with S690 steel and five with S275 steel, thickness of section was 6 mm and connected gusset plate was 10 mm thick. They concluded that block shear resistance of the tension angles increased with pitch distance, bolt number, andedge distances [5]. Yuk et aldeveloped a finite element model to predict the ultimate strength of base metal block shear fracture based on previous experimental results and proposed a modified strength equation for ferritic stainless steel welded connection with base metal block shear fracture considering the stress triaxiality effect [6]. Tehet al observed deformations and failure modes in shear tearout tests of bolted connections suggest that the effective shear failure plane lies midway between net and gross shear planes [7]. Jia et al worked on ductile fracture simulation of structural steel through numerical simulation based on the definition of crack initiation at the micro level and proposed a model for predicting fracture pattern which is limited to simulation of smaller sections [8].Kim et al performed experiment with cold-formed mild carbon steel, developed a finite element model for analysis and formulated a block shear strength equation of bolted connection and concluded the given equation is capable of more precisely determining block shear strength of double shear four-bolted connection with mild carbon steel. [9] Mai et al presented the application of digital image correlation (DIC) based technique in order to analyse failure of bolted steel connections through block shear mode and confirmed that average shear area used for block shear strength prediction by recently induced equation in AISI S100:2016 is conservative. [10] Dowswell et alconcluded by analysis of 93 specimens with slotted connections and found that AISC equations provided reasonably conservative results on tensile failure of steel sections. [11] James Orbison et al recommended the use of the interaction equation developed in their work in all connection geometries with eccentricities larger than those produced when standard gage lines are used. [12] Xiong et al presented a numerical study of the shear lag effects on high strength steel (HSS) bolted and welded single angles by the finite element method. The finite element models used in the study were calibrated by the test results of normal strength steel angles subjected to tension and found that the steel grade will largely affect the shear lag effect of bolted and welded single angles subject to tension. [13] Bernatowska et alinvestigated both experimentally and through FEA on tension failure resistance of steel angle members connected with one leg in a single row of bolts and found a significant influence of the total length of the connection andthe edge distance e2 on the tensile resistance. [14] Dhanushkar et al carried out full scale tests on double bolt-line connectionsand reported that increase in block aspect ratio and connection length gives better strength capacity in block shear failure. [15] Munse and Chesson proposed a coefficient K4 by studying a wide range of tension members with bolted and riveted connections, as expressed in given: where x is the distance between the face of the gusset plate and the centroid of the member, and L is the connection length [16], this proposed equation has been adopted in AISC-LRFD [17] and CSA/CAN-S16-09 specifications. Regan and Salter derived another equation for calculating ultimate capacities of welded members by conducting tests on specimen with longitudinal and transverse welds where failure was designed to occur over member section itself.The equation expressed is given as where Pt is the design tension capacity, py is the design yield strength of steel, Ag is the gross section area of the member, and a2 is the gross area of the outstanding/unconnected leg. [18] Ling et al experimented for shear lag effect on gusset plate welded connections and concluded that prevailing design rules are not adequate to predict connection strengths in VHS tubes and SSHS, thereby proposed five possible modifications which were examined and postulated. [19] Test results on welded connections by Zhu et alshow that increase in length of connection does not make the connection capacity better for long leg connected specimenwhereas improvement in the tensile capacity was observed for the short leg connected cases. [20] Chi-ling pan et al in their findings showed that major factors responsible for connection strength is the ratio of connection eccentricity to connection length, and the ratio of unconnected elements. [21] Georges et al calculated the reduction due to sgear lag effect in the steel tension members by assuming distribution of forces along inclined lines in member ends which is simple physical representation of stress distribution in all phases of failure during load implementation. [22] Samuel Easterling et alfound in welded joints of steel plates the ratio of length of welds in transverse and longitudinal direction has a considerable effect in shear lag coefficient [23].
Experimental program
Seventy-two full scale tests of single angle sections were performed on equal angle sections and unequal angle sections. Different bolt arrangements in angle sections connected with their longer leg was considered for checking the difference in resulting strength. The test codes shown in Table 1 are used to identify the specimens along with their section specifications and geometric configurations. The section adopted were kept similar to dimension of sections which have been previously tested by some researcher in order to verify that current set up and method of experiment is in line with those adopted earlier.Equal angle sections were connected with any one of the legs whereas unequal angle sections were connected with their longer sides. IS Steel Angle sections were fabricated to test in tension using Universal testing Machine of capacity 2000kN. Both equal and unequal angle sections were tested by fabricating with gusset plates on either side of angle section, connection between angle section and gusset plate was bolted with 18 mm bolts, having drilled holes. Thickness of gusset plate was greater than that of angle section in each type of specimen. For precise results of experiments initially samples were straightened in the testing machine by application of calculated tensile force. This procedure counter acted upon the weight of upper grip and the end fixtures making the holes to be in tight contact with bolts thereby reducing major slippages of the connections during testing. The specimen in the assembly were aligned in the machine and all readings were calibrated to absolute value for precision. Loading was applied at load displacement rate of 1mm/min and closely monitored while it extended to 50kN in the elastic range. This value was the point of control in primary stage where specimen was holded to undergo redistribution of stress throughout its section. Later process continued with subsequent control, checking for slight modifications in displacement in the inelastic stage while readings were continuously recordeduntil test specimen failed and separated into two parts. Kuwamura et alin review of finite element analysis methods, encompassing material properties, element type, mesh size, boundary and loading conditions, failure criteria, and the observation of curling effects, has yielded that bolted connections featuring large edge distances or end distances, curling tends to manifest out of the plane. This curling phenomenon has been identified as a key factor contributing to a reduction in block shear strength [24].
Table 1.
Experimental and modelling results being compared for connection with 2 bolts
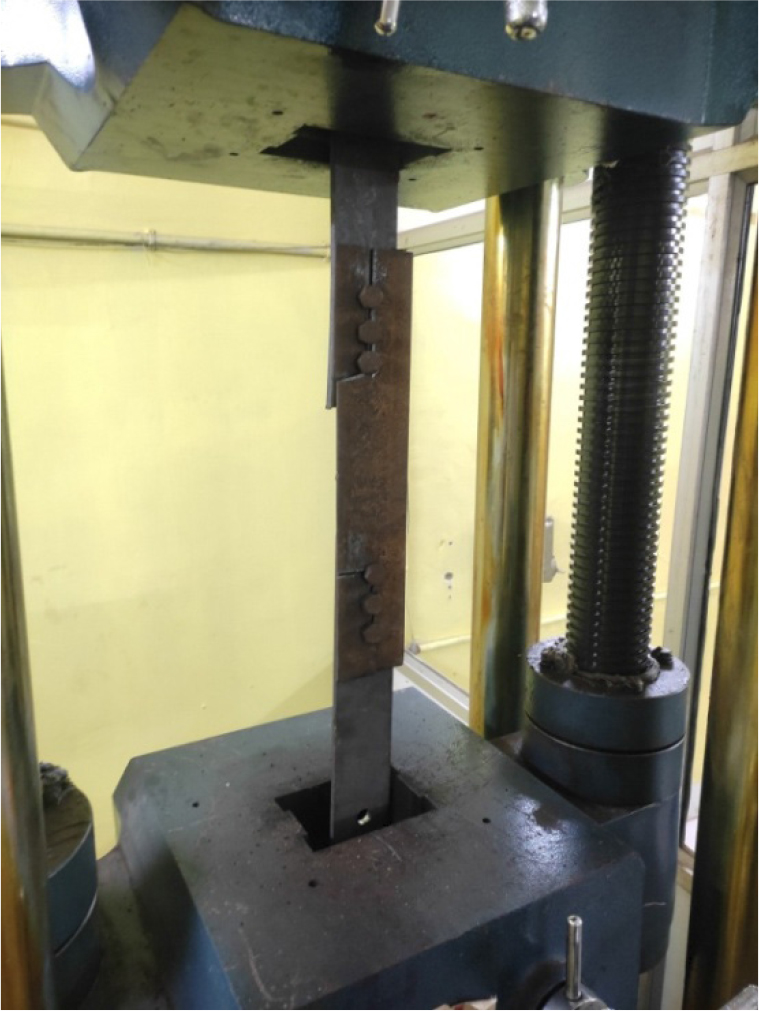
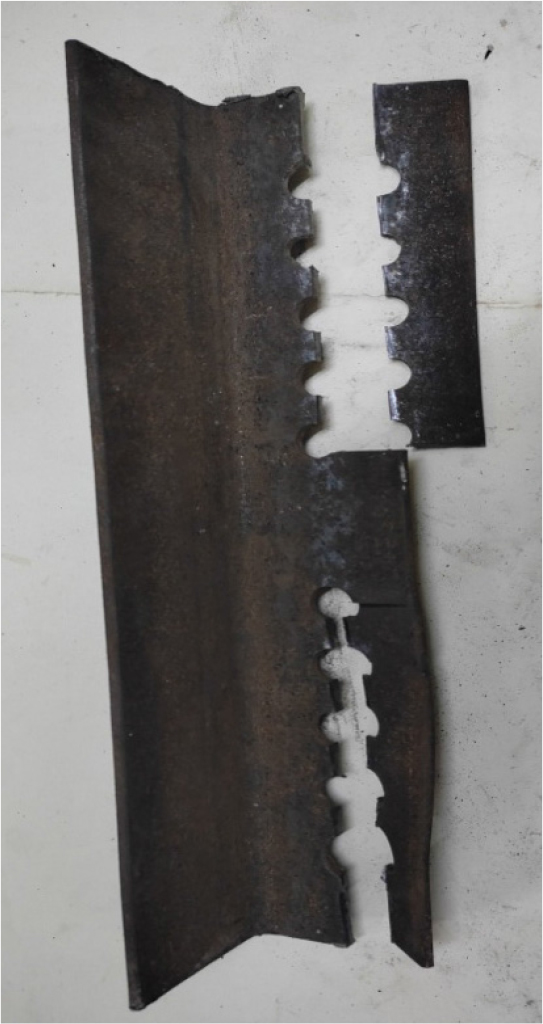
Curling was observed in sections followed by necking of critical sections before rupture initiated. Specimen which failed abruptly due to eccentric loading, defective fabrication or some other reason, were eliminated from sample. In some of the specimen bending occurred in such a way that it caused conflicts with test set up, hence were discarded. Figure 1 shows an angle section being tested for tensile capacity in UTM and Figure 2 indicates curling of specimen during rupture.
All the specimen failed in block shear depicting the pattern of failure involving rupture of tension plane and shear yielding of gross shear plane showing inelastic deformation. Rupture of tension plane initiated at bolt hole and propagated till the edge of specimen while yielding started along the length of shear plane, some cases depicted simultaneous yielding in both planes thereafter followed by rupture initiation in tension plane mostly in case of equal angle section. The results of experiment and calculated failure load has been compared in Table 2. For precise results of experiments initially samples were straightened in the testing machine by application of calculated tensile force.This procedure counter acted upon the weight of upper grip and the end fixtures making the holes to be in tight contact with bolts thereby reducing major slippages of the connections during testing.
Table 2.
Experimental and modelling results being compared for connection with 3 bolts
Test Results and Discussions
The experimental test results which include the ultimate tensile capacity in experimental analysis and simulation with failure mode of the sample have been tabulated in Table 1, also the test efficiency i.e., ratio of result in experimental ultimate capacity to the modelling capacity of gross section, as expressed in has been given for each specimen. The test efficiency is an important factor to check for cross-section utilization efficiency of a tension member. The test efficiency was observed to range from 0.8 to 1.08 with maximum samples ranging above 0.8 while only a few of the specimen indicated efficiency below 0.8. Allthe specimen failed through block shear mode under tensile stress generated by the applied load, fracture was observed to initiate from lead bolt holes and propagating towards the toe of connected leg while rupture towards lag bolt hole propagated till the end of section along the direction of load application. This made the fracture to occur in two orthogonal directions from the point of initiation hereby causing block shear failure the heel.
In general, the initial load response was observed to be linear, while increasing the load bending of gusset plates induced making the applied load to be resisted by the connecting bolts and net section area. As yielding started, nonlinear load-elongation responses of the specimen were observed. Evident inelastic deformations developed and reflected in curve subsequently to the ductile material yielding in most of the specimen. The longest elongation of3.50mm was seen in unequal angle specimen. Unequal angle sections reflected more elongation than equal angle sections thereby conforming that overall yielding of gross section occurred and stress redistribution happened to maximum extent before final fracture. This means that effect of shear lag can be observed by comparing results of equal angle and unequal angle specimen. Also, the specimen with different pitch and edge distance showed variation in elongation responses which means that sufficient redistribution is allowed before the connection failure.Hence by comparison of results among the specimen with varying pitch and edge distance, effect of shear lag was studied through parametric study.
Various parameters that contribute to the load- carrying capacity of the section have different effects on failure strength. To account for these effects, a parametric analysis was conducted with the aim of finding the influence of factors affecting block shear strength. A systematic approach was employed while individual factor was varied while keeping all other factors constant during modelling. This process involved conducting multiple iterations, with each iteration representing a unique combination of factor settings. By systematically isolating and varying each factor one at a time, it was possible to understand the individual influence of each factor on block shear strength, providing valuable insights into the overall behaviour of the system. Indeed, parameters like pitch, end distance, edge distance, the number of bolts, and bolt hole diameter are considered among the most significant factors that can significantly affect the load-carrying capacity of connections. These parameters influence the distribution of forces and stresses within the connection and can lead to variations in load-carrying capacities. Understanding how these factors impact the structural behaviour is crucial for designing connections that meet safety and performance requirements. For all analysis same configuration of angle section and gusset plate with bolted joint was used.
The results indicate that the net tension plane reached its ultimate stress at the point of failure, signifying that this specific plane experienced the highest level of stress before failure occurred. On the other hand, the gross shear plane exhibited significant yielding, suggesting that it underwent considerable deformation and stress redistribution but did not reach its ultimate strength before failure. These findings are corroborated by experimental results obtained from physically tested samples. As a result, it appears that the theory of net section rupture and gross section yielding accurately represents the observed behaviour. Concurrency in the result set of data indicates that for similar ultimate stress to yield ratio, gross section area is responsible for yielding in gross shear plane. Gross section area being the product of connection length and thickness of section, later being the constant length of connection remains to be critical.
The likely cause of the observed stress distribution disparity could be attributed to an incorrect consideration of the gross section plane. In particular, when calculating the gross shear area, if the entire section is considered rather than the portion between the bolt holes that is subjected to shear yielding, it can result in an inaccurate representation of the actual load distribution. Finite element analysis can be a valuable tool for identifying this discrepancy, as it provides a detailed and precise examination of stress distribution patterns within the structure. This emphasizes the importance of accurately defining the gross shear area to better understand the structural behaviour and make informed design decisions. It’s interesting to note that the current design, when evaluated using existing equations in codes like IS 800:2007, tends to yield reasonable and often conservative results that align well with experimental failure loads. This suggests that the design equations in these codes are effective for a wide range of scenarios. However, in cases involving greater edge distances, it appears that the design load is substantially underestimated. This discrepancy might be attributed to the fact that the net section begins to exhibit yielding before rupture initiation. This observation highlights the complexity of structural design, where specific conditions and geometry can lead to variations in behavior. It may necessitate further refinement of design equations or the consideration of additional factors to accurately account for these scenarios and prevent underestimation of load-carrying capacities. The analysis of observations in rupture patterns, both through modeling and a series of tests, suggests that block shear capacity is contingent upon the value of the yield stress generated in the gross shear plane at the moment when net section rupture begins to develop in the net section plane. This finding underscores the intricate relationship between different planes and sections within a connection. Furthermore, it indicates that the geometries of the connection, stress distribution, and other relevant parameters can lead to a reduction in block shear capacity, especially in areas where they do not contribute to the shear plane. This knowledge is valuable in understanding how various factors influence the overall load-carrying capacity of structural connections and can aid in the development of more accurate and refined design approaches
Modelling Study:FEA models
The modelling of all the specimen was performed through finite element modelling. This work was intended to develop a finite element modelling procedure which is appropriate to study shear lag effect in steel angle sections when failure occurs in block shear mode.Thisverified model would be helpful for investigation of shear lag effect during connection failure innot only angle sections but other rolled steel sections as well such as tees, channels and coped beams. Parametric analysis was also carried out in order to find the effect of connection parameters like edge distance, pitch, bolt hole diameter, connection length, bolting pattern on shear lag effect. This analysis will lead to collection of number of results which would be helpful to check the effect of shear lag on block shear strength, which is predicted by codal equations based on principles of mechanics and empirical expressions. Inorder to find out the precise failure load in sections undergoing block shear in connections of rolled steel sections the experiments were observed maintaining all precautions and guidelines. Also modelling of specimen to perform simulation were thoroughly verified with actual samples to match in all dimensions and every detailing.This project model employs a range of analysis techniques, starting from straightforward linear elastic analysis and extending to encompass complex scenarios involving significant geometric distortions and material nonlinearities. These analyses are conducted by employing finite element modelling methods specifically tailored for angle section tension members. The projected failure patterns derived from linear elastic analysis are utilized to estimate failure capacities using block shear failure models. These models prove invaluable for tracking the progression of failure even before reaching the yield point. However, they do not capture the phenomenon of stress redistribution that occurs after yielding has taken place.
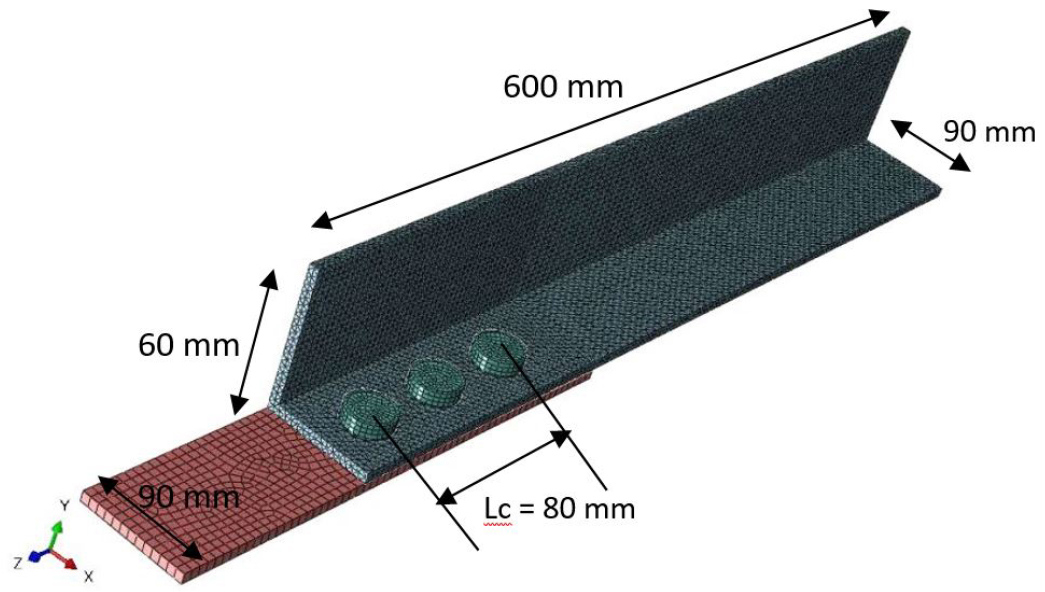
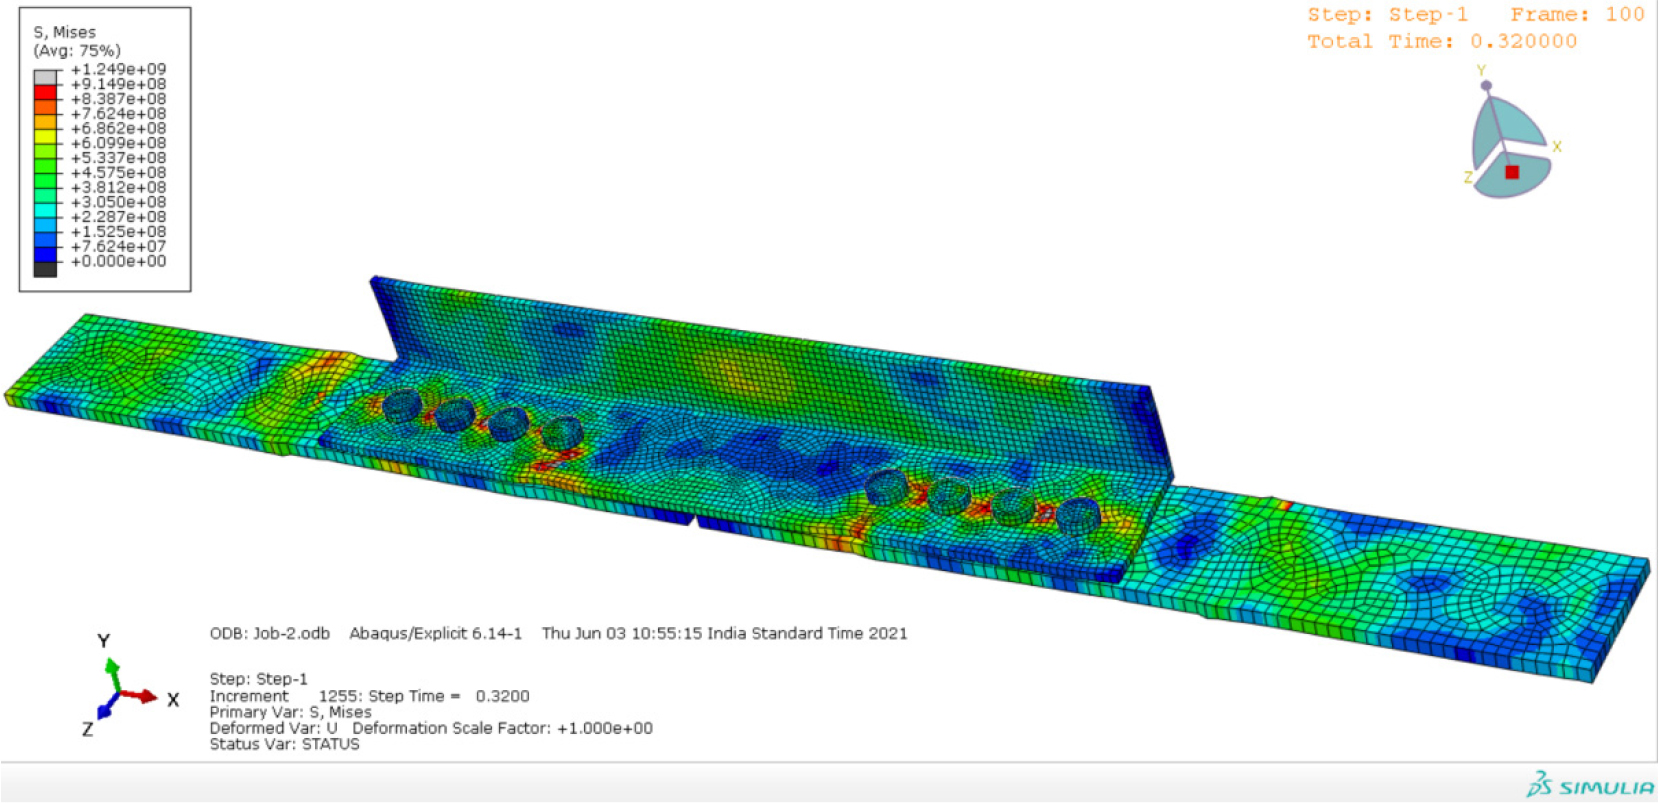
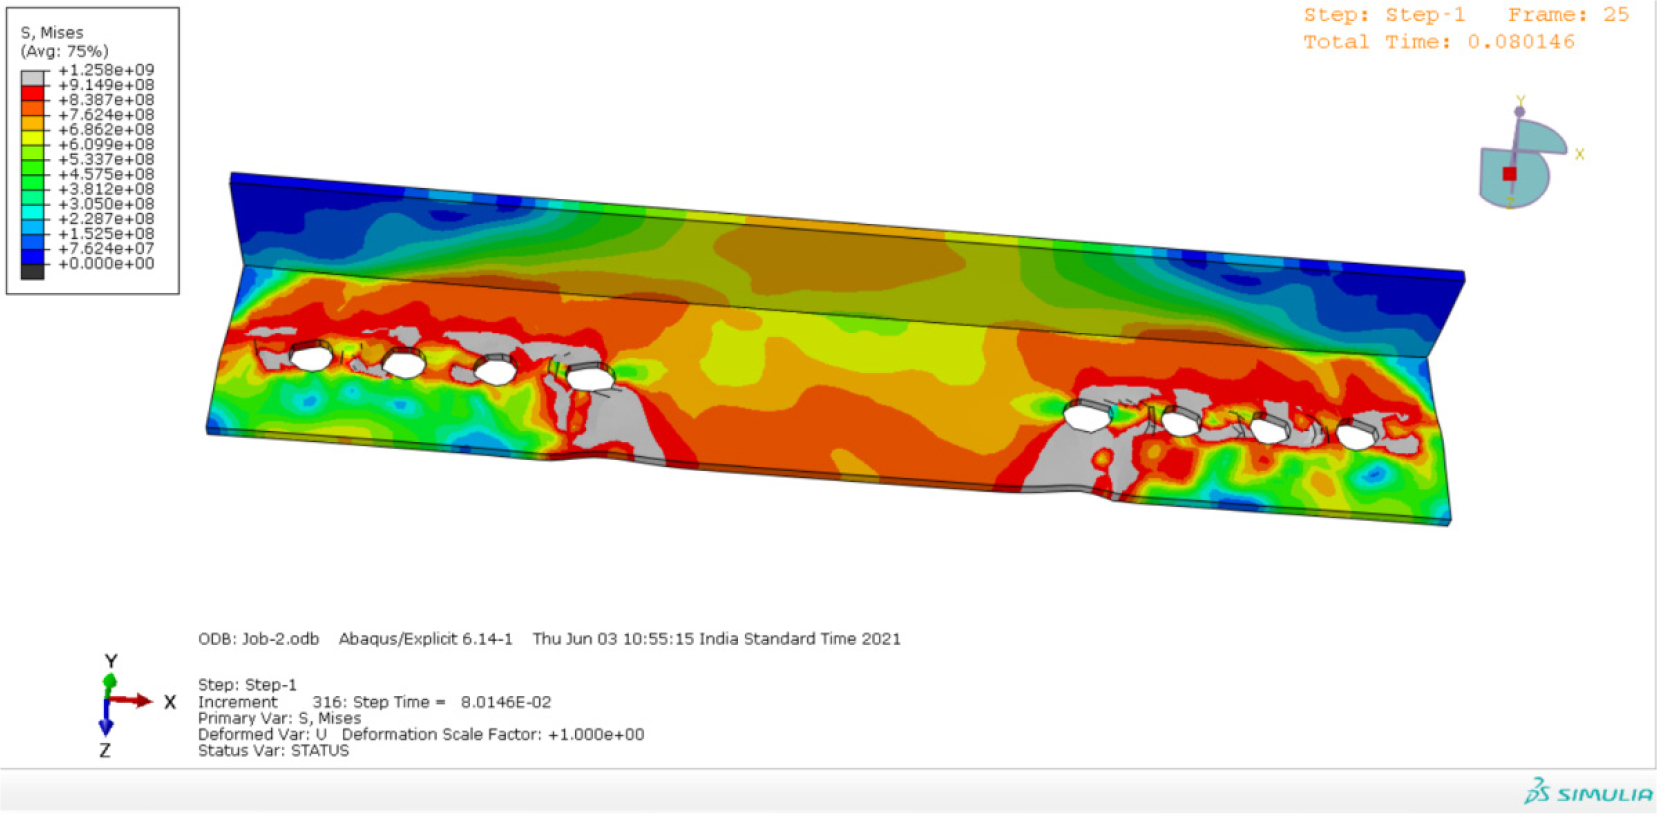
Furthermore, the anticipated failure capacity of a section is determined through modelling analysis that encompass both geometric and material nonlinearities. These analyses have demonstrated their effectiveness in providing accurate predictions of the failure strength for steel angle tension members, yielding realistic outcomes. In this approach, angles and gusset plates are represented in the model using hexahedral elements. This choice is made because hexahedral elements are capable of accommodating significant deformations and material nonlinearities. In the analysis process, a generic true-stress-strain curve response is verified to ensure its applicability across all scenarios The nonlinear stress-strain behaviour of steel is represented in the model using the von Mises yield criterion with isotropic hardening. According to the true-stress-strain curve, the material behaves elastically up to the yield point, after which it enters a yield plateau phase. Strain hardening begins at a true strain value of 0.02 and increases linearly until it reaches the true ultimate stress level. This modelling approach accurately captures the material’s response to deformation under varying loads. The model assumes that the true strain at the true ultimate stress is 0.1. Once the material reaches the true ultimate stress, it enters a phase of constant stress, which continues until the material is assumed to fracture at a true strain of 0.3. In the current configuration, bolts are treated as rigid elements, facilitating the complete transfer of loads between connected members. This transfer occurs through the bearing of bolts, ensuring that load is effectively transmitted between the gusset plate and the angle section, or vice versa. Surface-to-surface contact is employed at all points of contact to ensure full load transfer between the connected members to account for the influence of the bolt heads, the nodes surrounding the bolt holes on the outer side of the gusset plate are constrained in the direction normal to the connected leg. This constraint effectively simulates the effect of the bolt heads, preventing any movement in that specific direction. Consequently, any minor displacements occurring within the plane, whether transverse or longitudinal, are interconnected through the nodal point of contact on the surface. This ensures that the analysis accurately reflects the behaviour of the system, taking into account the constraints introduced by the bolt heads. To precisely capture the stress behaviour, especially in areas where failure is most likely to initiate, the meshing is concentrated around the bolt holes. This refined meshing strategy near the bolt holes allows for a higher level of detail and accuracy in modelling the stress distribution and potential failure points, enhancing the overall reliability of the analysis. The boundary conditions for displacement have been applied selectively, restricting movement in the longitudinal direction only at the opposite ends of the member. This boundary condition configuration effectively constrains the member’s displacement along its length while allowing other degrees of freedom, such as transverse movement, to remain unconstrained. Also condition of hard contact was defined to simulate the mechanism of parallel directions. [25] All inputs in simulation include scope steps to define objectives, functions and system boundaries. Process of collecting data for input in simulation is based on complete life cycle inventory analysis stage of steel structures [26]. It is assumed that corrosive effect influence on surface of steel sections is negligible and cannot be accounted for modelling of sections. [27] The load at failure corresponds to the maximum load experienced throughout the entire experimental simulation. In the majority of the analyses conducted, fracture initiation occurred through the necking of the tension plane in the vicinity of the leading bolt hole. This typically transpired in the region situated between the edge of the section and the bolt hole, and it became apparent at the ultimate load stage. This observation highlights the critical role of this specific area in determining the failure mode and load-bearing capacity of the connection. Figure 3 shows image of angle section IS 90*60*8 with 90 mm leg connected to gusset plate by three bolts of 16 mm shaft diameter fastened in 18 mm drilled holes with pitch distance of 40 mm and Lc i.e., length of connection is 80 mm. Figure 4 and Figure 5 depicts the simulation observations during application of tensile stress, colour stress contours define the degree of stress in the zone of application.
Conclusions
Full scale experiment program was conducted to study shear lag effect of steel angle tension members with bolted connections has been reported in this work. Seventy-twonumber of tests in total were conducted out of which 26tests were made using equal leg sections whereas remaining 46 were executed on unequal leg angle sections. The test results derived from current study as well as from other relevant works were compared with design specifications of different codes.The following outcomes from this paper were concluded.
1.The shear lag effects are evident for angles bolted and connected with their shorter legs;test efficiencies of the specimen can be influenced by different factors.It was very often observed that the test efficiency was relatively greater for equal leg angles.
2.The block shear strength was not sensitive enough to the length of bolted connection but employing a long connection with shorter leg outstand was found to have better resistance.
3.The test results were compared with various codes, test-to-predicted ratio of the effective member and its section area was observed.Sound comparisons between the test results, AISC- LRFD and IS 800 predictions was observed and marginal variation was found for the predicted results from EN1993-1-8 which is due to negligent consideration of shear lag effects.In general, EN1993-1-8 results are non-conservative for unequal angles connected by their shorter leg but predict safe results for angle sections connected with longer legs. The predictions by CSA-S16-09 were found to be generally safe due to the reduction of 15% of the outstanding area for all specimens irrespective of the ratio of connected- to-unconnected leg widths. Safe prediction was also seen in AS4100-1998 which proposed a factor of 0.75 in order to account for shear lag effect in all types of sections subjected to tension.
4.Thecurrent incorporations of resistance factor in CSA-S16-09 and AISC-LRFD were examined using the data obtained from this study and found that recommended factor of resistance in AISC- LRFD and CSA-S16-09 (i.e., 0.75) was conservative for angle tension members with bolted connections also if the factor of 0.75 was extended to 0.80, it shall lead to economically efficient design even with target safety index of 4.5.
5.Strain developed in unconnected leg was found to be small as compared to strain in connected leg, which indicates the effect of shear lag.
6.The variation of connection parameters such as connection length, number of bolts, pitch distance was recorded and found that increase in pitch distance has considerable effect on the ultimate strength of angles. Also, higher the ratio of shear lag distance to connection length, the strength capacity decreases for same values of b/t ratio and fy/fu ratio.
Further Scope of Work
The block shear behaviour of Tees, channels, and plates will provide insights into how these sections respond to similar or different loading conditions and can help in formulating design guidelines that are tailored to each specific section type. This broader investigation will contribute to a more comprehensive and versatile structural analysis and design approach.
This study has primarily focused on block shear failure studies, has provided valuable insights into the behaviour of structural connections. The identification of partial net section rupture during experiments underscores the complexity of structural failure modes and the importance of further investigation. Extending studies to include other types of failure, such as partial net section rupture, will contribute to a more comprehensive understanding of how structural components respond to various loading conditions and failure mechanisms. This broader investigation will enable to develop more robust design guidelines and safety factors that account for a wider range of potential failure scenarios, ultimately enhancing the reliability and safety of structural designs.
