

Introduction
Methodology
Simulation process
Solar radiation
Illuminance levels
Daylight Autonomy (DA)
Annual lighting use Result and Discussions
Conclusions
Introduction
Providing optimal daylighting in a classroom has been regarded as one of the most important environmental qualities in a school. The positive outcomes of natural daylight have been reported as it can reduce absenteeism and enhance student satisfaction which leads to better performance [1]. Also improved daylighting does not need to turn on electric lights throughout the year which would be helpful to minimise cooling demand in summer by lowing heat from light bulbs. Nowadays, there has been a growing demand for installing a canopy attached to the classroom in order to provide semi-outdoor space as an extended classroom regardless of weather conditions. Therefore teachers can use the space as a continued pedagogical place. The canopy attached to the classroom would play a role in influencing the amount of daylighting into the classroom as most daylight is filtered by the extruded element. Controlling incident solar radiation with different kinds of shading devices is a frequent technique in mid-latitude areas [2, 3]. Building regulation and environmental assessments provide guidelines to encourage designers to handle natural daylight at most as a primary source of illuminance indoor. Optimisation of the shading devices using simulations is revealed by Kirimtat and Manzan that controlled shading devices could provide an effective way of avoiding glare and also minimising the cooling load in summer [4, 5]. For a large glazed area, diverse static and dynamic, transparent glazing systems can control heat gain and loss which are explored by Gosh and Norton [6]. Also, switchable glazing with transparency as an advanced glazing system can play a critical role in managing incident solar radiation [7].
Several studies have simulated for daylighting levels, but there is still insufficient data dealing with various factors of buildings such as orientation and transparency of canopy. This study, therefore, is to show exploration of the canopy's environmental performance, looking at daylighting levels in a classroom associated with different transparency and orientations of the canopy attached to the classroom. The role of daylighting (achieving good visual comfort quality) is essential in schools in order to reduce energy demand for lighting as well as to enhance student satisfaction which leads to better student performance. Daysim and Weather tool, Autodesk, will be manipulated to calculate daylighting levels and the simulated results will be visualised with Autodesk Ecotect. Up-to-date software (e.g., Daysim, Radiance, etc.) consider the dynamics of sky conditions as a realistic sky condition for the whole year, enabling the calculation of possible savings when using daylight as the source of lighting in different locations and orientations [8, 9]. The various approaches of evaluating daylight will help designers to understand the nature of light in a classroom and the interactive passive design method [10]. Also, it would help to develop a methodology to analyse the distribution of daylight in the classroom for visual comfort and to calculate electricity for lighting with future shading devices.
Methodology
Simulation process
Up-to-date calculation methods allow engineers and designers to simulate visual comfort with daylight and energy performance in the process of designing a classroom. As shown in Figure 1, environmental variables (e.g. form, orientation, transparency, etc.) can be explored with Daysim engined with Radiance. Daylight distribution in the classroom under various factors is then to be displayed with the secondary software Ecotect [11] which presents graphically with three-dimensional modelling. The physical conditions of the numerical model for daylight are modelled in Ecotect and simulated with Daysim and then export data to Ecotect to visualise. Main parameters to change are applied to the location of the area and transparency of the canopy under analysis. The illuminance level on the working plane has to be no less than 300 lux as a minimum threshold in the teaching area according to Building Bulletin 87 [12]. In order to maintain the minimum requirement, a sophisticated adjustment needs to be made to the canopy adjacent to the classroom maximising daylighting levels throughout the year. It was also found that the Chartered Institution of Building Services Engineers (CIBSE) in the UK similarly defines the classroom standards as 300 lux and laboratory as 500 lux [13].
There are tools which can be used to predict the daylight factor or light transmittance which have a quantitative output, usually by using simple algorithms. Such tools include Ecotect and Radiance which use ray-tracing techniques to model the behaviour of light and can produce highly realistic images as well as quantitative data.

Solar radiation
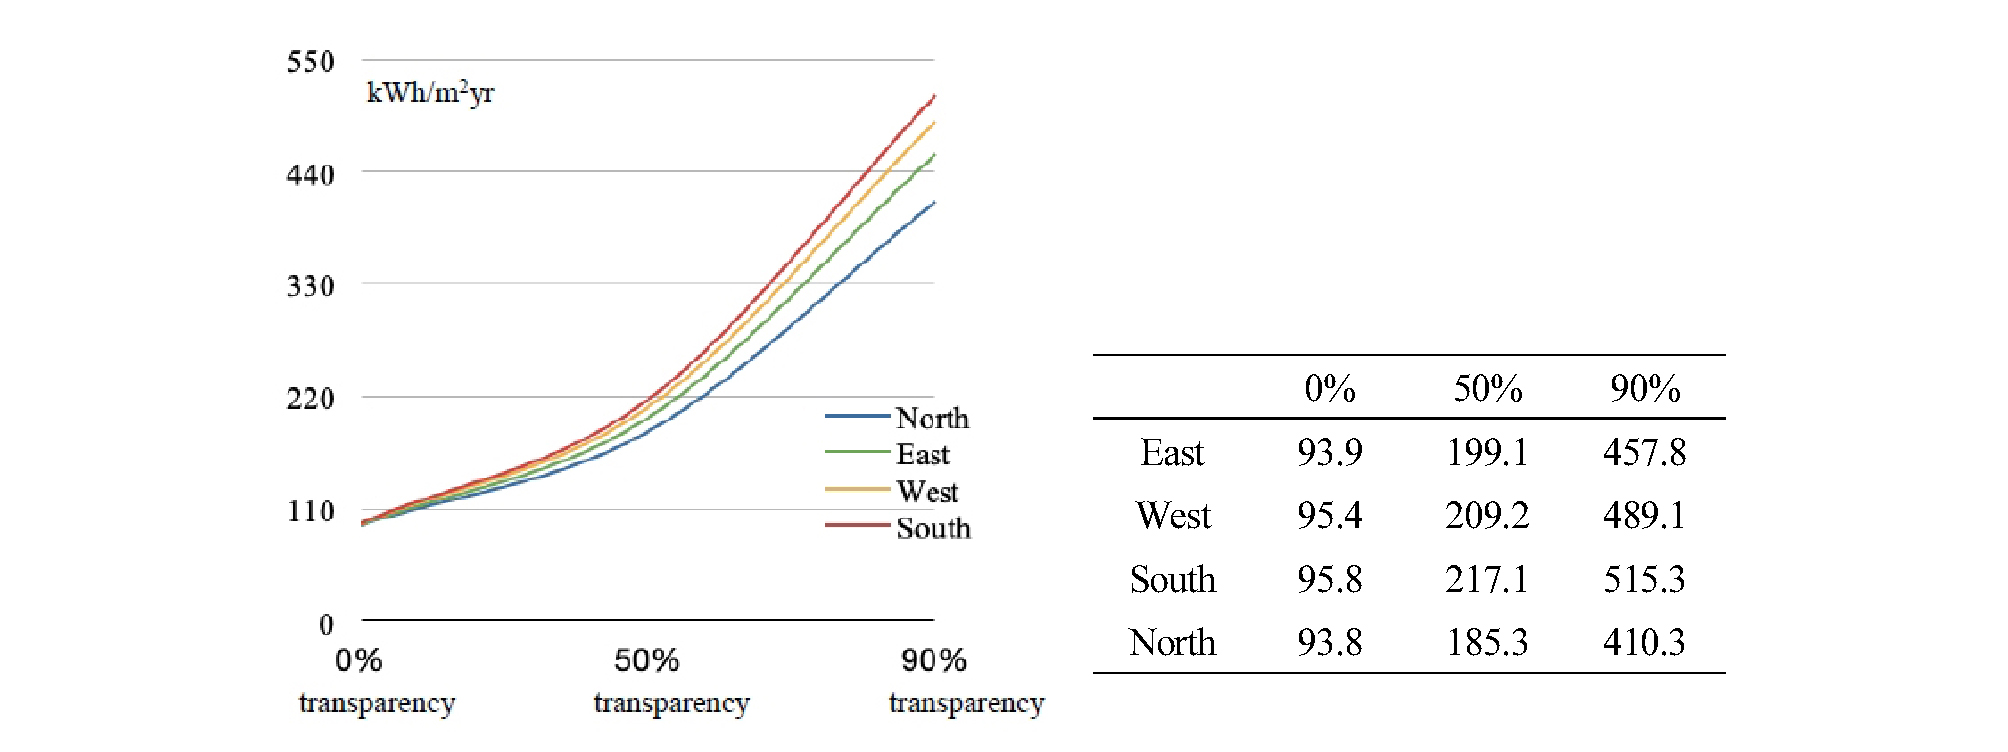
The modelling was based on a design characterised by preliminary research into the common-practice design of classrooms [14]. The size of the classroom under test was 63 square metres (9m x 7m) with three classrooms in a row with a height of 2.9m. Canopy with a size of 7m x 5m (WxD) is explored with a variation of transparency which is attached to the classroom shown in Figure 2. Three different transparencies (0%, 50% and 90%) are applied to simulate the amount of incident solar radiation. Simulations which calculate incident solar radiation on the vertical facade are useful to determine the influence of the transparency and orientations of the canopy.
Vertical radiation plays an important role in daylighting levels and indoor thermal comfort.

∙ Overall, the amount of solar radiation increases rapidly at transparencies greater than 50%.
∙ There is no directional difference to the amount of solar radiation when using a 0% transparency (opaque) canopy which is because an opaque canopy blocks solar radiation.
∙ The incident solar radiation is affected by the direction (in order of significance, south, west, east and north as in Figure 3.) with a 90% transparency canopy.
∙ When using a 90% transparency canopy, a south-facing facade will receive around 25.5% more solar radiation than a north-facing facade, whereas there is no directional difference when using a 0% transparency canopy. This shows that the canopies of higher transparency are affected by the orientation of the building.
∙ These simulations demonstrate that when designing a sheltered semi-outdoor space the higher the transparency of the canopy the more attention is needed as it is affected by the direction of solar radiation.
Illuminance levels
In the simulation, the transparency and orientation are experimented to seek optimal transparency to orientation ratio of the canopy for daylighting. The most common shape of canopy found is a flat rectangle, which is adopted here to simplify the simulation. Shapes of the canopy can be changed according to the preferences of both architect and clients. The construction material used for the canopy is transparent polycarbonate, which can be varied in the Ecotect simulation allowing transparencies in the range of 0% to 90%. The simulated building faces south, and an overcast sky condition on 21st December (the worst case scenario) was chosen. To achieve daylight levels of no less than 300 lux on the desks in a classroom, the transparency of the canopy needs to be high. Figure 4 shows daylighting distributions in the classroom on 21st of December with an overcast sky as the worst case scenario.
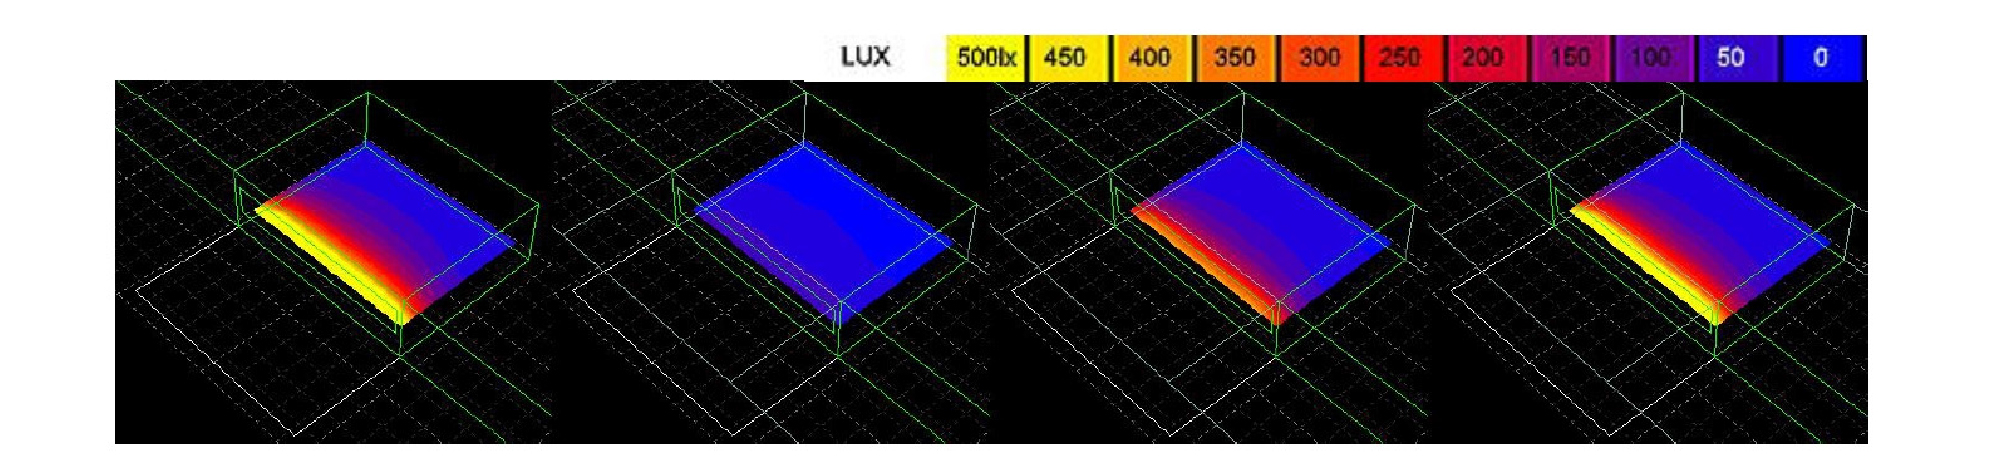
The change in the distribution of natural light can be seen with different transparencies of the canopy. Average illuminance without a canopy is 201.4 lux which is around five times and two times brighter than that using of 0% and 50% transparency canopies respectively as tabulated in Table 1. CIE overcast sky is used for the simulation, which is the standard used throughout northern Europe for calculating daylight. The standard CIE overcast sky is considered to be three times brighter overhead than it is on the horizon and has the same brightness in all directions. However, outdoor illuminance is different and changeable by the orientation, which can lead to the different application of transparency to the canopy when designing solar shading for a classroom in order to achieve better internal daylighting levels. Simulations for daylight under all different transparencies of the canopy are made as illustrated in Figure 4. The level of daylight is measured in the middle of the classroom at noon. From the graph it can be seen that at no time during the year does the opaque canopy allow 300lux, the minimum level of light for a classroom, to pass through.
Table 1. Average illuminance in the classroom and settings
| No canopy | 0% transparency | 50% transparency | 90% transparency | |
| Average illuminance | 201.40 lux | 38.95 lux | 110.50 lux | 174.98 lux |
- Sky condition : CIE overcast sky
As a result, there will be an increase in the use of artificial light. Daylight levels in Table 1 show average illuminance in the classroom at noon with an overcast sky. Colours are ranged from yellow for above 500 lux to blue for near zero illuminance. This simulation is for the worst-case scenario in overcast condition. Table 2 shows the uniformity ratio (minimum daylight factor divided by average daylight factor) of the daylight generated in the simulation. It is recommended by constructional standards to be in the range of 0.3 to 0.4 for side-lit classrooms in the UK.
Table 2. Uniformity ratio of 0%, 50%, 90% and without canopy
| 0% | 50% | 90% | Without | |
| Average DF | 1.43 | 2.75 | 4 | 4.43 |
| Minimal DF | 0.6 | 0.99 | 1.07 | 1.18 |
| Uniformity ratio | 0.42 | 0.36 | 0.27 | 0.27 |
From the prerequisite simulation, it can be seen that:
∙ The transparency of the canopy plays an important role in restricting the intensity of daylight.
∙ A 50% transparency canopy allows an average daylight level of 300 lux in the classroom between the spring and autumn solstices.
∙ An opaque canopy allows less than 200 lux to reach the classroom, even at the summer solstice. Therefore, artificial light is necessary to make up the deficit in light created by the opaque canopy.
∙ Transparency, once used in fixed depth and height of the canopy has an important role in controlling solar radiation affecting incident solar radiation.
This calculation using a static sky condition does not predict precise daylighting use in the classroom. Therefore, Daysim software is used for overcoming the limitations of using CIE overcast sky, with dynamic sky condition and use of blinds as close as in actual practice in continuing this simulation. Daysim (Dynamic daylight simulations) was developed by the National Research Council in Canada. It is a daylight analysis software package that calculates the annual daylight availability in a building as well as the energy use of automated lighting controls (occupancy sensors, photocells) compared to standard on/off switches. Daysim combines the raytracing software Radiance with a daylight coefficients approach, which enables accurate calculations to be made. The underlying sky model used by Daysim to calculate annual illuminance profiles is the Perez all weather sky model [9].
Daylight Autonomy (DA)
Daylight Autonomy presents as the percentage of occupied hours per year when the minimum illuminance level (300 lux for a classroom is applied) can be maintained by daylight alone [15]. Thus daylight autonomy (DA) is a useful figure to check the available daylight for a specified space. The figures are represented by a percentage which is a frequency above threshold (here set as 300lux), and It can provide a more holistic daylighting analysis. The calculation depends on the minimum illuminance threshold, the specified user occupancy, and the type of blind control used.
The results simulated using Daysim software can be displayed as seen in Figures 5, 6 and 7. Colours indicate percentages of the occupied hours above 300 lux in the classroom.
The classroom with 90% transparency canopy facing south has the highest daylight autonomy of 62.2% which means daylight can light the classroom for 62.2% of the school hours (09:00 -16:00 with a one-hour lunch break) without artificial lights. The classroom facing north with 0% transparency (opaque) canopy shows the lowest DA of 19.7% which implies artificial lights would be used for around 80.3% of school hours, leading to a high increase light energy demand. The relationships of classroom orientations and canopy transparency can be found effectively with a line graph as illustrated in Figure 8. It shows there is around 6.7% maximum difference of DA with a 90% transparency canopy between orientations while 18.2% difference of DA with a 0% transparency canopy.
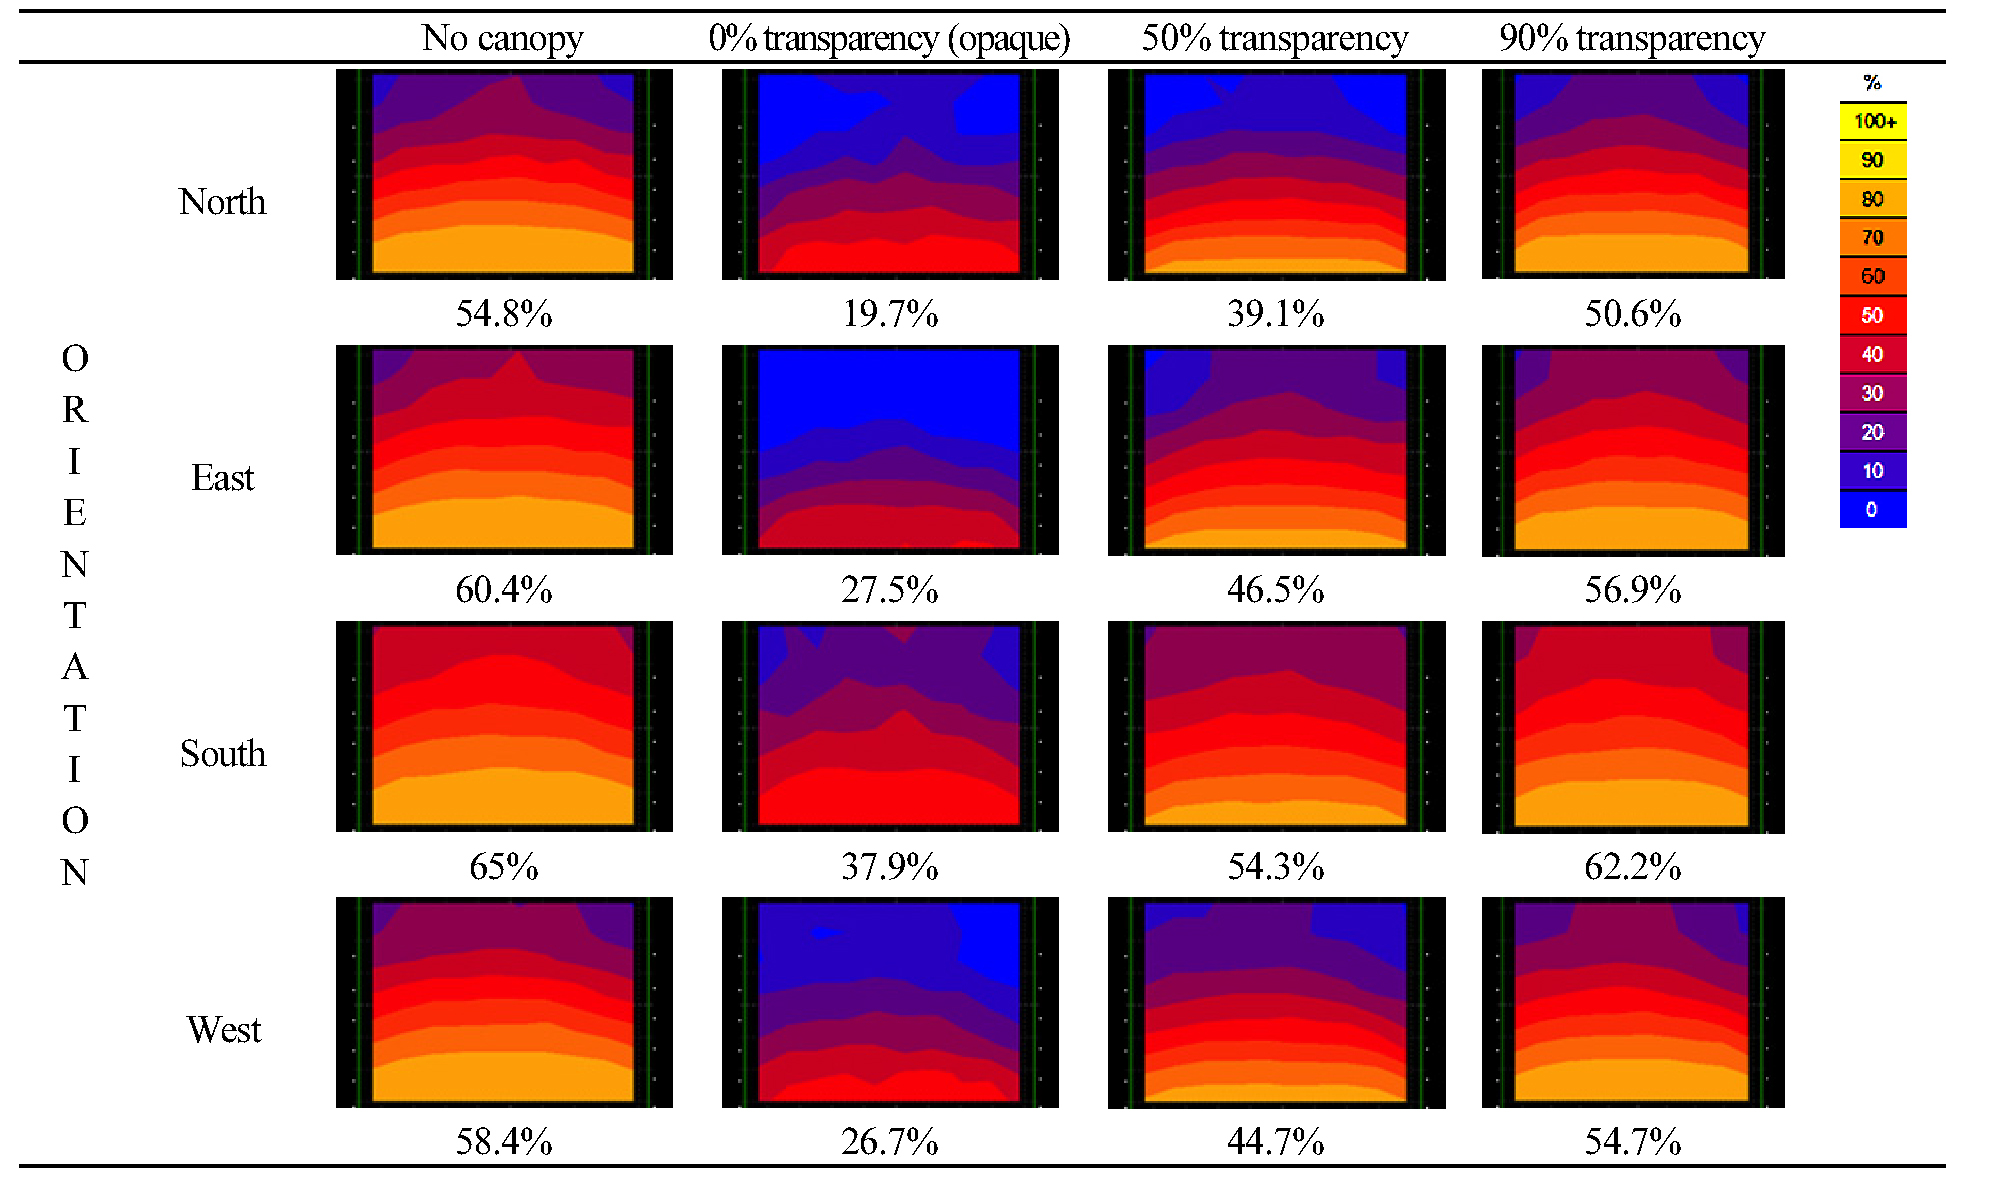


It shows that the selection of the lower transparency canopy needs to be made with care, as different outcomes are associated with different orientations. Conversely, with higher transparency of canopy, the difference of DA in orientations is much reduced by 6.7% between south and north orientations in which the maximum and minimum amount of DA were observed respectively. From the simulation some foundings can be summarised :
∙ Using the same orientations for the simulation with Daylight Autonomy (DA) calculated as the daylight availability above 300lux at the height of 900mm without using electricity, the results show that outdoor spaces facing south and using a 90% transparency canopy have around 24% more DA than south-facing outdoor spaces using a 0% transparency canopy in all the cities studied.
∙ However, where daylight autonomy (DA) is concerned, more is not always better, as mean the more is, the better as blinds are needed when direct solar radiation comes through the windows, causing a problem with glare. Glare is quite related with the use of electric light as glare is a critical issue in the classroom. Using canopy in order to block direct solar radiation helps to reduce glare before it reaches the indoor space. Otherwise, it is necessary to employ a blind as an effective way to reduce glare such as Venetian blind system.
∙ The difference in DA is large when using canopies of different transparencies for a north-facing outdoor space: around 30% of DA can be achieved by using a canopy of 90% transparency more than by using a 0% transparency canopy in all cities studied.
∙ DA is shown to be better for south-facing outdoor spaces than for all other orientations regardless of canopy transparency.
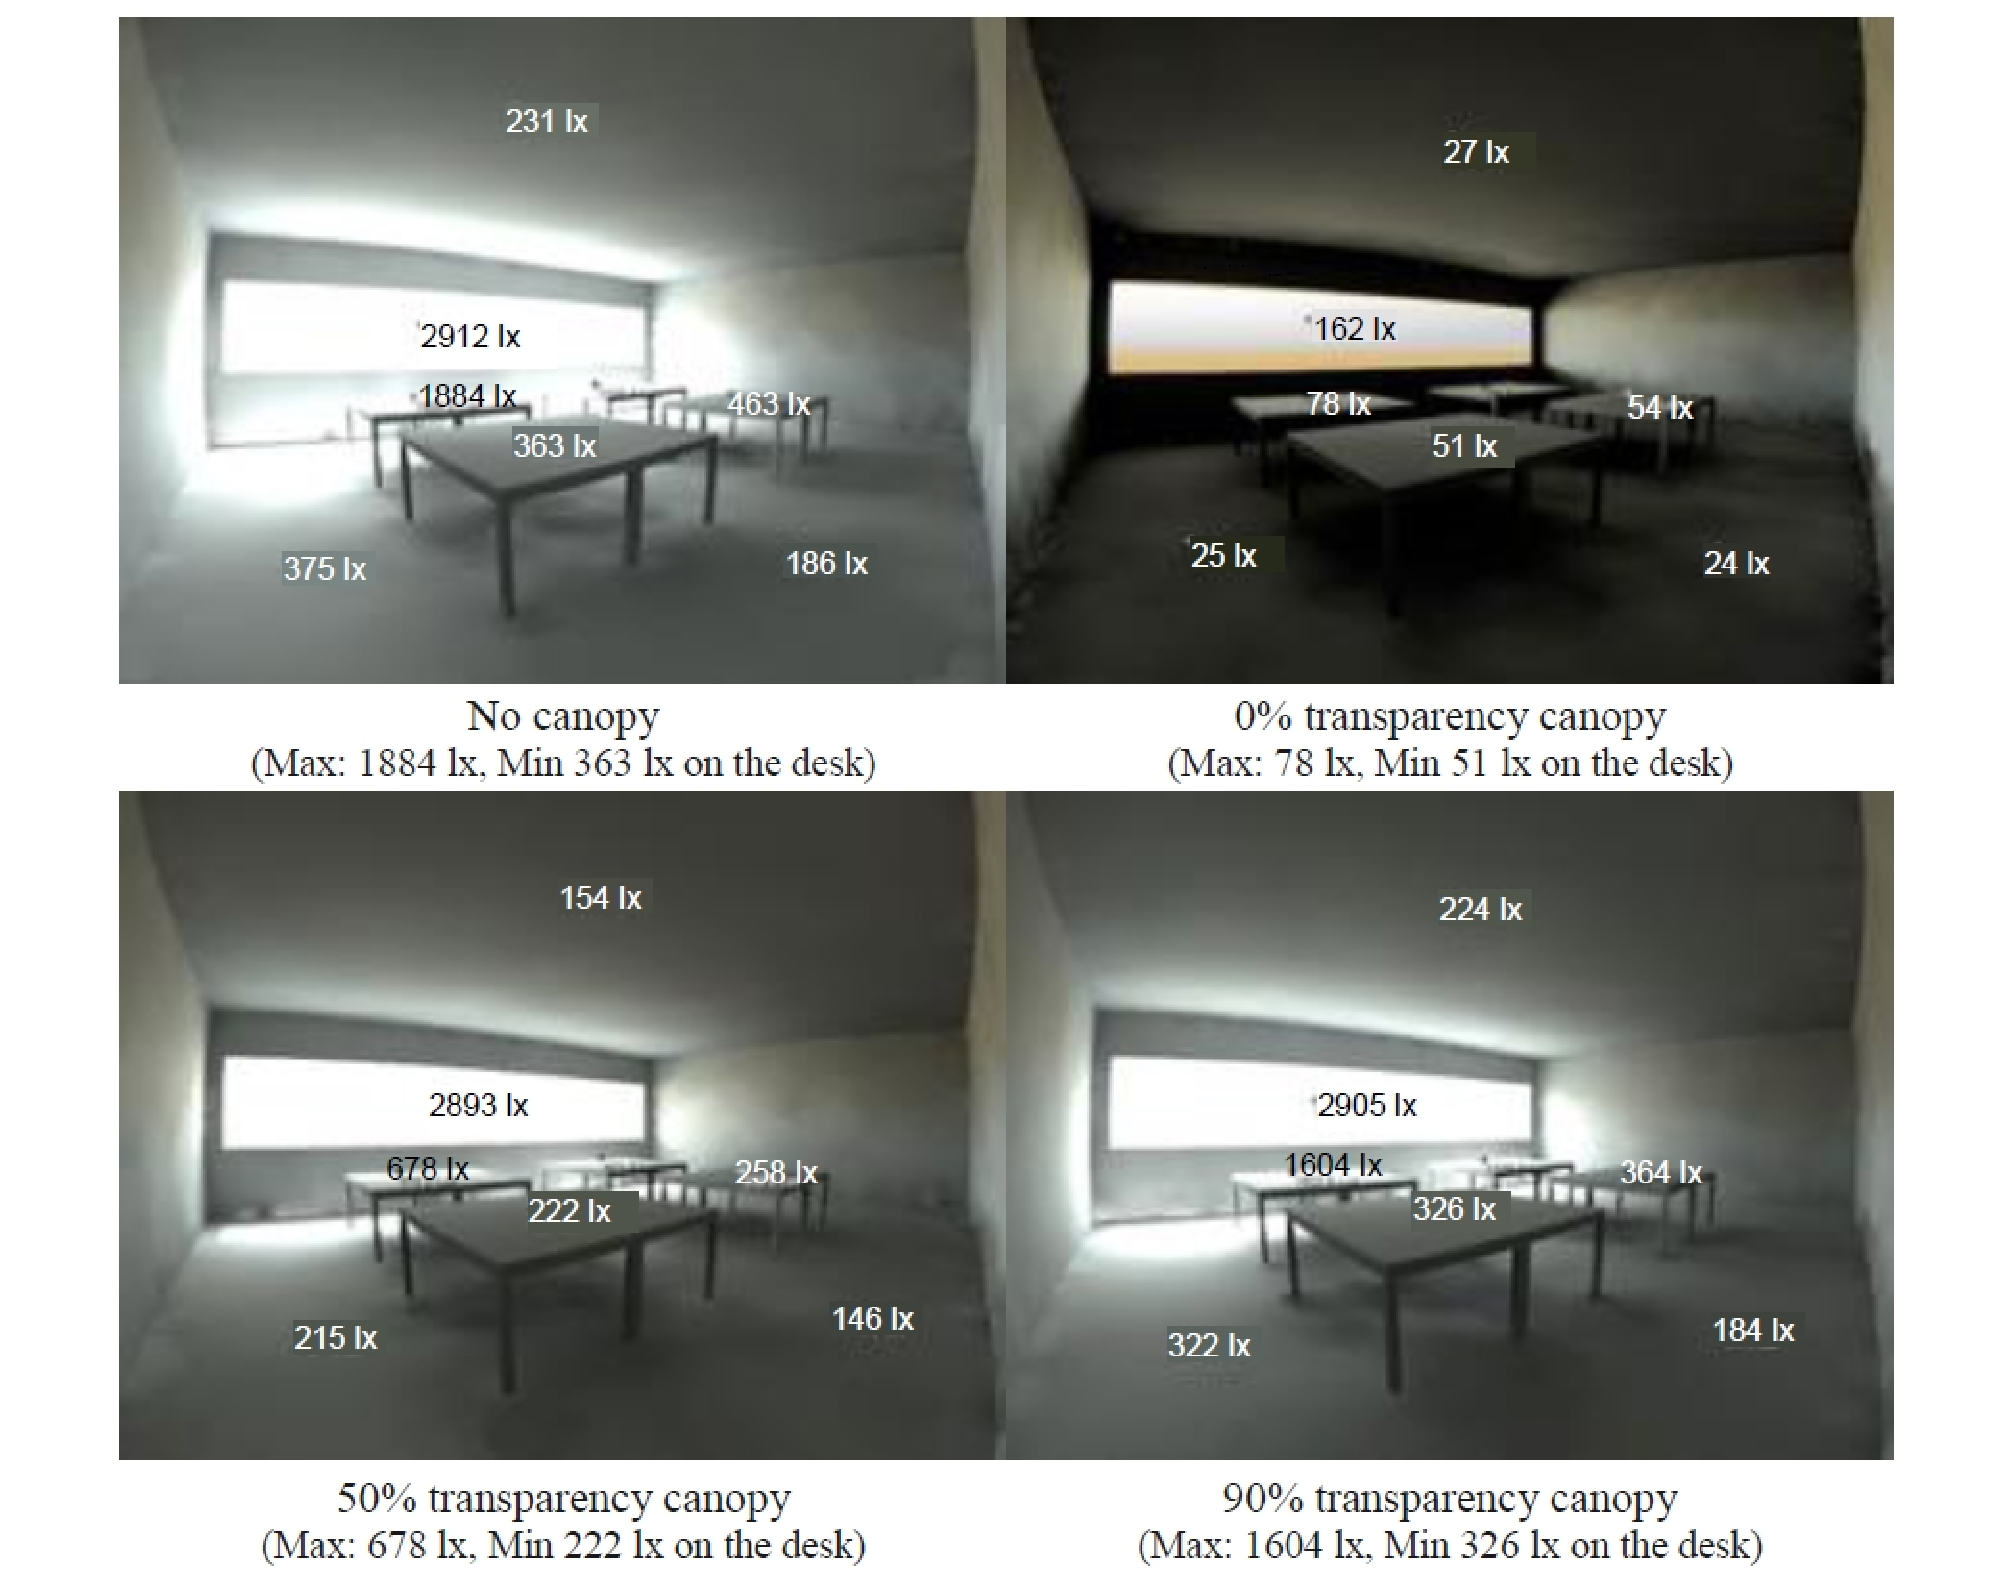
Illuminance levels in the classroom on a cloudy day (21 Dec) are calculated with different canopy transparencies as shown in Figure 9. The illuminance on the desk (900mm above the floor) shows the nearer the window area, the more intensity of daylight is observed. For example, a direct solar beam may cause too much brightness at desk level at near openings, resulting in glare for students. Glare is one of the main reasons to turn on the lights during the daytime. The large difference in daylight between the area near the window and the area furthest from the window also provokes glare problems, which lead to an adjustment to the blind in order to keep solar beams from penetrating the classroom.
Alongside daylight availability and glare it is necessary to consider the energy consumption for the provision of light in the classroom. Therefore, a simplified shading device model is used that assumes that the lowered blinds block all direct sunlight and transmit 25 per cent of all diffuse daylight with using of Daysim, which can predict electric lighting over the whole year. This simplified model is adequate for the initial design phase.
Annual lighting use Result and Discussions
Dynamic Daylight Simulations (Daysim) is also able to calculate the lighting energy arising from using automated lighting controls (occupancy sensors, photocells) compared to that arising from the use of standard on/off switches from the annual daylight availability in a building. The underlying sky model used to calculate the annual illuminance profiles is the Perez, all-weather sky model.
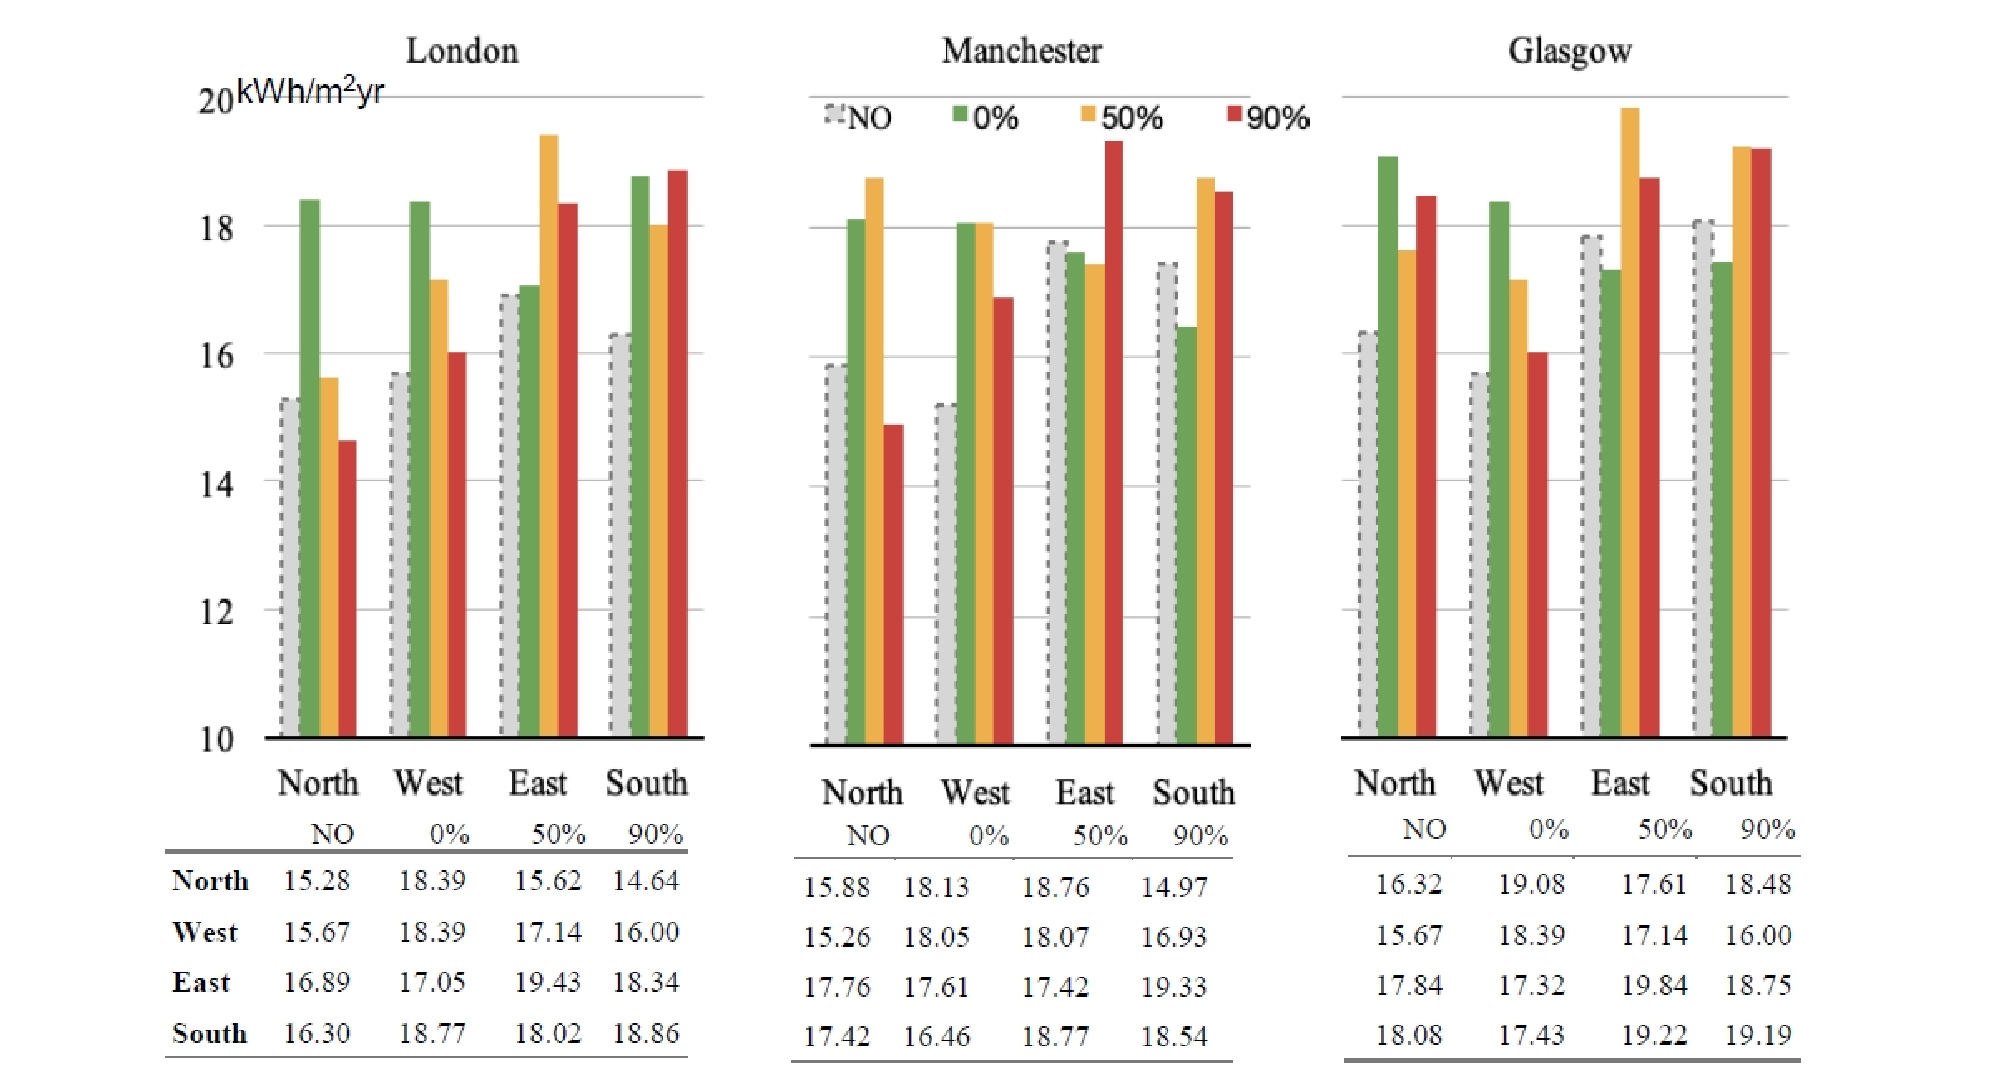
This enabled the simulation to work out the daylighting performance for different orientations. The simulated zone is occupied from Monday to Friday between the hours of 09:00 and 16:00. A minimum illuminance level of 300 lux is set up at the level of desks, 900mm. The predicted annual electric lighting energy use is shown in Figure 10. The electric light demand does not follow the way of DA, and it is rather to describe as irregular as each case varies separately based on the combination of canopy transparency and orientation. Whichever directions and transparencies are used the electric light demand is more than that of without a canopy as the canopy tends to reduce daylight in some ways.
∙ Electrical lighting energy does not quite match with annual Daylight Autonomy (DA) in the classroom.
∙ The demand for lighting energy needs to be calculated by examining a combination of daylight availability and glare, which tends to prompt students to turn on the lights.
∙ Use of any type of canopy tends to increase lighting energy demand, either through reduction of the total illuminance or through blockage of direct solar radiation.
∙ In London, use of an opaque (0% transparency) canopy requires 6.7-7.4 kWh/m2 of electricity over the year. When used facing east, an opaque canopy performs better, which is a 9-12% improvement on the lighting energy required when facing other directions. It can also be interpreted that a canopy of 0% transparency is not recommended for a north facing transitional space.
∙ An opaque canopy shows the poor performance if installed in facing north as there are glare problems at low solar angles in London.
∙ In London, use of 50% or 90% transparency canopies should be avoided for east-facing transitional spaces, as they lead to a glare problem early in the morning. However, a 0% transparency canopy performs well, leading to 25% less energy demand than arises when using a 50% transparency canopy.
∙ In Manchester, 0% and 50% transparency canopies need to be avoided for north-facing spaces while a 90% transparency canopy performs quite well, giving around 18% reduction of lighting demand in comparison with that of using 0% transparency.
∙ 50% and 90% transparency canopies need to be avoided in easterly directions in Manchester, and 0% transparency needs to be applied in south and east directions.
∙ In Glasgow, the opaque canopy generally works well in most directions, but in the northern direction, its performance is worst as there is an associated 17% increase in lighting energy demand.
∙ Overall, lighting energy demand does not solely depend on daylight availability but also on the combination of glare and daylight, which is controlled by orientation and building elements.
Conclusions
This study has reviewed the daylighting performance of canopy in association with orientations of the building and transparencies of canopies, using Daysim and Ecotect software simulations. The simulations show the availability of daylight represented by Daylight Autonomy (DA) and how it can influence electric energy demands. It shows that use of a canopy with higher transparency can reduce the need for artificial lighting and allow students to benefit from daylight throughout almost the whole year, except the winter. It is, however, not possible to achieve daylighting level over 300 lux in winter in the classroom when lit from one side, except that a roof light or clerestory is installed. An increase in the transparency of the canopy produces a significant improvement in the DA in the classroom due to the larger proportion of glazed area. For the optimal daylighting over the year in a classroom can be achieved by a judicious combination of canopy transparency, orientation and movement sensor possibly combined with a dimming system. Some important findings can be summarised as below.
∙ Using the optimal combination of canopy transparency, orientation and blinds can increase the daylighting level over the whole year compared with the use of an opaque canopy facing north.
∙ Energy consumption of lighting in the classroom can be affected by the canopy used.
∙ South facing classroom in London consumes the least energy for the lighting of the combinations studied. Classrooms orientated to the east use most energy when a 0% transparency canopy is used.
∙ In Manchester and Glasgow, use of a 50% transparency canopy increases the energy demand for lighting compared with similar situations in London. This is largely due to the low angle of the sun which penetrates the classroom. The direct solar radiation causes a glare problem and students or teachers would use blinds to overcome this. Once blinds are used. Usually illuminance at desk level decreases, leading to use of electric lights, increasing energy demand.
∙ In Manchester, east and south orientations of outdoor spaces are recommended. A 90% transparency canopy performs badly if the classroom faces west.
∙ The higher transparencies perform well when facing north and west compared with other directions. However, lower transparency is good for east and south orientations in Manchester.
∙ In Glasgow, north facing classrooms have low energy demands compared with classrooms of other orientations, but opaque canopy causes high energy demand in the classroom. The implications are, therefore, that when installing a canopy, its transparency needs to be considered in conjunction with the orientation of the classroom in order to maximise the internal daylight levels throughout the year. Even though a large amount of daylight does not mean minimal use of light electricity, there would be more potential to explore daylight depending on the application.
∙ Different orientations have diverse energy demands for lighting. However, it needs to consider in combination with canopy transparency and length in case of the opaque canopy. In general, using a canopy increases use of electric lights as it reduces the incident daylight regardless of the direction it is facing. Also, glare is one of the main reasons to increase electric light after cutting off direct solar radiation. For example, when glazing faces west energy demand for light is peaked using opaque canopy in London but is lowest in Glasgow.
In the future, the result of this simulation needs to be explored further with investigating the additional impact such as outdoor thermal and energy demand in order to define an optimal canopy type.
