

Introduction
Literature Review
Methodology
Building energy simulation tool: ECO2
Life cycle assessment and environmental performance
CASE STUDY
Evaluation building and Energy performance
Parameters
Life Cycle Assessment : Green Remodeling Stage
Life Cycle Assessment : Use and maintenance stage after Green Remodeling
Life Cycle Assessment : End of life stage
Result of evaluation
Conclusions
Introduction
Recently, as the interest in environmental pollution and climate change has increased internationally, there is much effort in environmental regulation, to properly respond to climate change related to global warming in all industries [1, 2, 3]. Statistics show that 87.1% of Korea’s greenhouse gas emissions occurred in Korea come from energy use [4]. The energy used by buildings is 20.63% of the total [5]. In response, the Korean government has implemented various energy policies and projects. Among them, they are had been promoting the “Green Remodeling Support Project” that supports the retrofitting of existing buildings since 2013 in order to improve the energy of existing buildings. The aim of Green Remodeling Support Project is to improve energy saving and utilization efficiency through facility improvement, in order to develop energy efficiency and improve inefficient factors of buildings. Improvement methods include envelope retrofit, high-efficiency replacement, and renewable energy installation. The scope of the project includes facility improvement or building remodeling. However the Green Remodeling Support Project focuses only on energy savings. Although energy is attracting attention as a major cause of environmental pollution, it cannot represent all environmental impact. Green remodeling policies should be considered for various environmental categories. However, there is limited research on comprehensive evaluation methods for environmental performance of retrofitting buildings in South Korea. Therefore, the purpose of this study is to provide the basic data on the environmental impact increase and decrease according to the envelopment retrofit by each part of green remodeling. This paper introduces the monthly building energy analysis method and the LCA methodology. The study is carried out with case study using energy performance assessment and life cycle assessment.
Literature Review
Vilches et al. (2016) summarize recent studies related to the environmental impact assessment of building repair and refurbishment using the LCA methodology. According to this paper, most LCAs focus on energy refurbishment, comparing the environmental impacts before and after refurbishment. The more frequently studied life cycle stages are those associated with the manufacturing and use phases. Similarly, the most considered impact categories are the global warming potential and embodied energy. The system boundary, functional units, LCI method, operating phase and end-of-life definition of EN 15978 are discussed [6].
Beccali et al. (2013) evaluated the life cycle energy and life cycle environmental impacts of the energy retrofit of detached houses. In particular, the implementation energy and environmental impacts associated with the production, transportation and installation stages of the materials, components required for building renovation are evaluated. It is similar to this paper in that it comprehensively evaluated various environmental categories. However, there is a difference in not evaluating by each part and comparing them before and after retrofitting [7].
Jang et al. (2012) studied about non-residential Building Envelope Remodeling for Energy Efficiency. In case of improving the existing building by each part, improvement of energy performance is analyzed. This study provided basic data on effective envelopment retrofit of existing buildings. It is similar to this study in that the envelopment improvement for each part is set as comparative conditions. However, there is a difference in that the environmental impact is not comprehensively evaluated [8].
Methodology
Building energy simulation tool: ECO2
Environmental impacts on Use Energy Phase of building life cycle have a critical impact on the entire life of buildings. An analysis on energy savings of existing buildings is required. As an energy analysis program, ECO2 is used in the case study. ECO2 is a public evaluation tool distributed by the Korea Energy Agency for Building Energy Efficiency Rating System (BEER) and green remodeling support projects in 2011.
ECO2 is a monthly energy simulation tool which is based on ISO13790 and DIN V18599. For each zone, the user needs to enter the Envelopment, equipment, and renewable energy information. The output shows energy demand, energy consumption, primary energy consumption, and energy self-sufficiency rate. This program has the advantage of simple and easy use. However, as it is only a building energy simulation tool, so there are lack of limitations.
Life cycle assessment and environmental performance
The most world wide environmental impact assessment method used, is life cycle assessment (LCA). LCA can comprehensively assess the environmental impacts that occur during the life cycle of a ‘cradle to grave’ product. Before evaluation, the goal of evaluation, functional units and system boundaries should be established. The goal of this evaluation is to evaluate the environmental impact increase and decrease according to the envelopment retrofit by each part of green remodeling. Based on the goal, functional units, system boundaries, and notation of results are proposed.
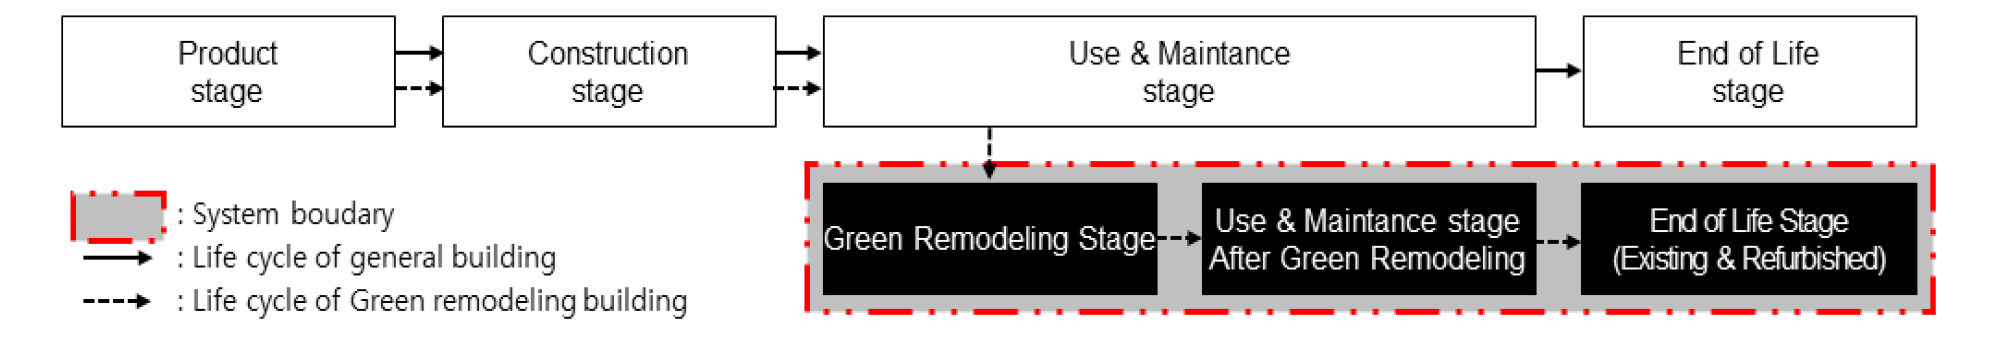
The functional unit is very important since it serves the measurement criteria of the performance of the product system. If the functional unit is unclear, a individual functional unit can be set. The purpose of this study is to compare and evaluate the environmental performance of green remodeled buildings. Green remodeling is mainly focused on improving energy efficiency, and accordingly, it is proposed to represent 1 m2 of floor space of heating and cooling space as a functional unit. In order to measure the environmental impact of a product or service using life cycle assessment methods, each life cycle phase and system boundaries must be clearly defined to determine the scope of data collection for each phase. The environmental impact is changing, due to the green remodeling phase. Furthermore, it consists of green remodeling phase, operation and maintenance phase after green remodeling, and disposal phase. For the purpose of evaluation, it is proposed to include the green remodeling stage, the operation and maintenance stage after green remodeling. In addition, the production and construction stage are excluded on the evaluation. Figure 1. shows Life cycle and system boundaries of Green Remodeled buildings
Various environmental impact categories, including global warming potential, are evaluated by the LCA. In this study, the results are presented in 6 major environmental categories, specified by ISO14025. The 6 major environmental impact categories consist of Global Warming Potential (GWP), Abiotic Depletion Potential (APD), Ozone Depletion Potential (ODP), Eutrophication Potential (EP) .Acidification Potential (AP) and Photochemical Ozone Creation Potential (POCP). The result shows ΔCI, which is the amount of increase and decrease of the environmental impact before and after green remodeling. The difference of the environmental impact, which is occurred during the remaining life of the green remodeling and the non-green remodeling, is analyzed. If the result shows negative value, it indicates that, the environmental impact is reduced due to green remodeling. Positive values indicate an increase in environmental impact. The total lifetime of the building is assumed to be 50 years. The calculation method of change in environmental impact is shown in equation (1).
| $$\triangle CI_i=\sum_{}^{}CI_{i,GR}-\sum_{}^{}CI_{i,nGR}$$ | (1) |
In where, ΔCIi : The change of environmental impacts on environmental impact category (i).
CIi,nGR : The impact of non-green remodeled buildings on the environmental category (i)
CIi,GR : The impact of green remodeled buildings on the environmental category (i)
CASE STUDY
Evaluation building and Energy performance
For case study, a sample is set up as a building planned for Green remodeling. The sample building is an experimental center located in Ansan, Korea. The facility has steel sturcture and completed in 2007, and had been used for 12 years. Electric heater and electric heat pump are operated for heating and cooling. It has total three floors, the first and second floors consist of experimental spaces and the third floor is an office space. This building has 49.19% of window area ratio, showing a large window area as in Figure 2. As a result of energy performance analysis, the Average thermal transmittance of the third floor is 4.406 W/m2·K, heating energy demand is 159.60 kWh/m2·yr, cooling energy demand is 32.58 kWh/m2·yr. The insulation is not installed on the existing roof. Thus, It is analyzed that heat loss is great in winter. Compared to the general new building, the energy performance is not good. Energy consumption analysis is based on ECO2 [8], an ISO13790-based building energy simulation tool. Table 1 is summary of sample building.


Table 1. Summary of sample building
Parameters
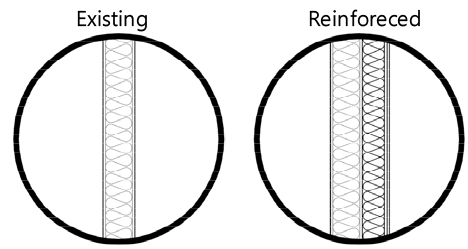
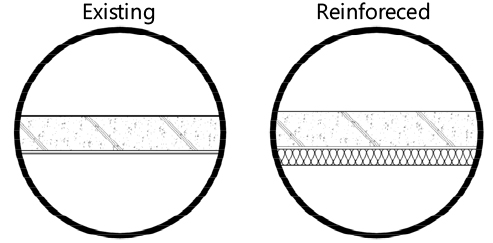
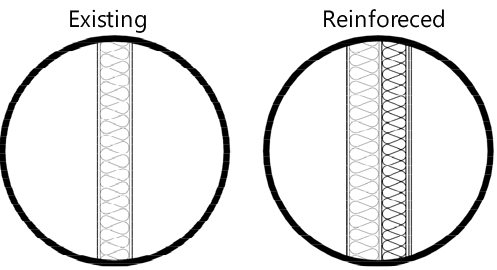
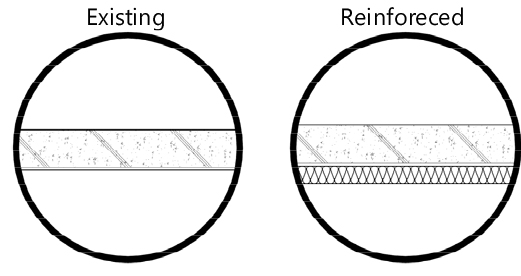
4 parameters are set to evaluate the environmental performance of envelopment retrofit. The parameters are related to the insulation improvement of the envelopment of third floor Table 2. shows the summary of envelopment retrofit plans for each parts. Case1 is exterior wall insulation improvement. This is the case when thickness 50mm phenolic foam (PF) board is added on the existing thickness 80mm poly-urethane panel wall. In this case, the heating energy demand is reduced by 5.32% to 153.60 kWh/m2·yr. Cooling energy demand will increase by 2.38% to 33.35 kWh/m2·yr. Case 2 is insulation improvement of the roof. It is the case that thickness 80mm PF Board is attached on the bottom of existing concrete slab with thickness 160mm that is not insulated. The heating energy demand is 88.72 kWh/m2·yr, a 44.41% reduction. Cooling energy demands are reduced by 4.46% to 31.12 kWh/m2·yr.
Table 2. Summary of envelopment retrofit plans by each parts
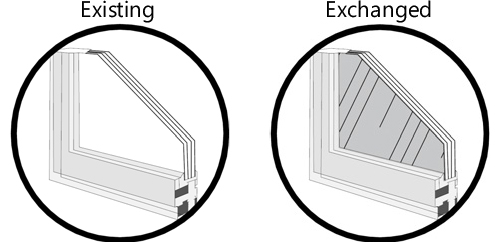
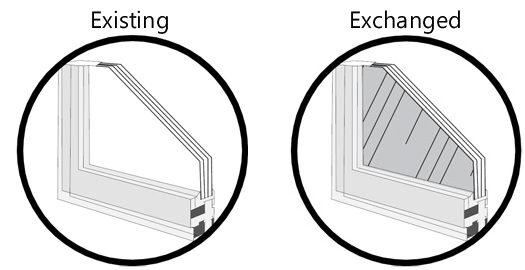
Case3 relates to the glass of the window. The glass of existing window is 22mm thick (5CL + 12Air + 5CL) pair glass. It is replaced with a 24mm thick Low-E Pair Glass (5CL + 14AR + 5LE). The properties of the existing windows are quoted from the standard value of Energy-saving Design Criteria For Buildings for the evaluation. Also, properties data of the Low-E windows are provided by the manufacturer. In Case3, Heating energy demands are reduced by 11.91% to 140.59 kWh/m2·yr and cooling energy demands by 21.86% to 21.86 kWh/m2·yr. Finally, Case 4 is a case where all of Case 1, Case 2, and Case 3 are improved. Heating energy demands are decreased 61.59% to 61.59 kWh/m2·yr. The cooling energy demand is expected to decrease by 19.48% to 26.23 kWh/m2·yr. The insulation is not installed on the existing roof and the area is also wider than other parts. Therefore Case3, Case4, which is reinforced with insulation on the roof, is analyzed to have a large energy saving effect. Table 3 describes each parameter.
Table 3. Energy perfomance by Envelopment retrofit plan
Life Cycle Assessment : Green Remodeling Stage
In green remodeling, existing facilities must be dismantled, transported and disposed of, and the production, transportation, and construction of replacement materials must go through. The dismantling, transportation, and disposal of the existing facility is excluded in this step on the assumption that it will be disposed of at the disposal stage as existing buildings. The detailed process of the production process is divided into raw material supply, transportation, and manufacturing, and it is recommended to collect and evaluate data on each unit process. In order to evaluate the environmental impact at this stage, it is necessary to collect data on the type and quantity of building materials used for green renovation. The amount of environmental impact generated during the production process can be calculated by calculating the quantity of each material and the environmental impact emission factor. The environmental impact characterization value of each building material was derived using the following equation [9].
| $$CI_i=\;\Sigma M_j\;\times\;Basic\;Unit_{ij}$$ | (2) |
In where, CIi : Environmental Impacts on Environmental Impact Category (i).
Mj : The mass of material (j) to be used for a green remodeling.
Basic Unitij : Emission factors for inputs material (j) to the Environmental Impact Category (i)
In the case of transportation process and construction process, in order to evaluate the environmental impact, it is necessary to collect the type, loading capacity and fuel efficiency data of transportation vehicles, construction equipment by major building materials used for green remodeling. It can be estimated from the total energy consumption data used in transport vehicles and construction equipment and emission factors by energy source.
Life Cycle Assessment : Use and maintenance stage after Green Remodeling
In general, the detailed process of the operation phase of a building is divided into use, maintenance, repair, replacement, algebra, operating energy use, and water use. In this evaluation method, it is proposed to evaluate the high impact replacement and operating energy process.
In order to assess the environmental impact of replacement, data on the repair cycle, repair rate, transportation vehicle and transport distance, and remaining life of the building for each building material replaced by green remodeling according to the long-term repair plan of the Apartment Housing Management Act Can be evaluated
To evaluate the environmental impact on the use of operating energy, the primary energy demands data for heating, cooling, hot water supply, lighting, and ventilation generated by the user using the building during the remaining life of the building after green remodeling and emission of environmental impact by energy source requires coefficient.
Life Cycle Assessment : End of life stage
The detailed process classification of the disposal stages is divided into deconstruction, transportation, recycling and reuse, and disposal (incineration, landfill). In order to assess the environmental impact of the deconstruction and transportation process, it is necessary to collect the equipment used to dismantle the building materials, the capacity and fuel economy data of vehicles carrying waste, and the amount of the main waste building materials generated during the deconstruction process. it is assumed that the amount of main construction materials generated during the deconstruction process is equal to the number of construction materials put in the remodeling stage.
The quantity data of the waste building materials to be incinerated or buried must be collected by referring to statistical data such as the waste generation and disposal status.
Result of evaluation
6 major environmental impact categories are evaluated in order to comprehensively evaluate the environmental performance according to the envelopment improvement of each part in this paper. The 6 environmental impact characterization values are applied to the national LCI DB, Ministry of Land, Infrastructure, and Transport’s building materials environmental DB and environmental impact values of EPD products.
Figure 4 and Table 4 show the results of the environmental performance assessment for the six major environmental impacts in each case. Global warming potential (GWP) and acidification potential (AP) are decreased in all cases. The air conditioning, heating, lighting, and hot water equipment used in the building are all operated by electricity. GWP and AP characterization coefficient of electrical energy are relatively high. As the energy efficiency of buildings increased, the environmental performance of the GWP and AP are improved on the use energy phase. The environmental performance of GWP and AP is greatly reduced to –4.32 E + 03 kg-CO2eq /m2 and 4.06 E + 03 kg-Sbeq/m2 in case 4, respectively.
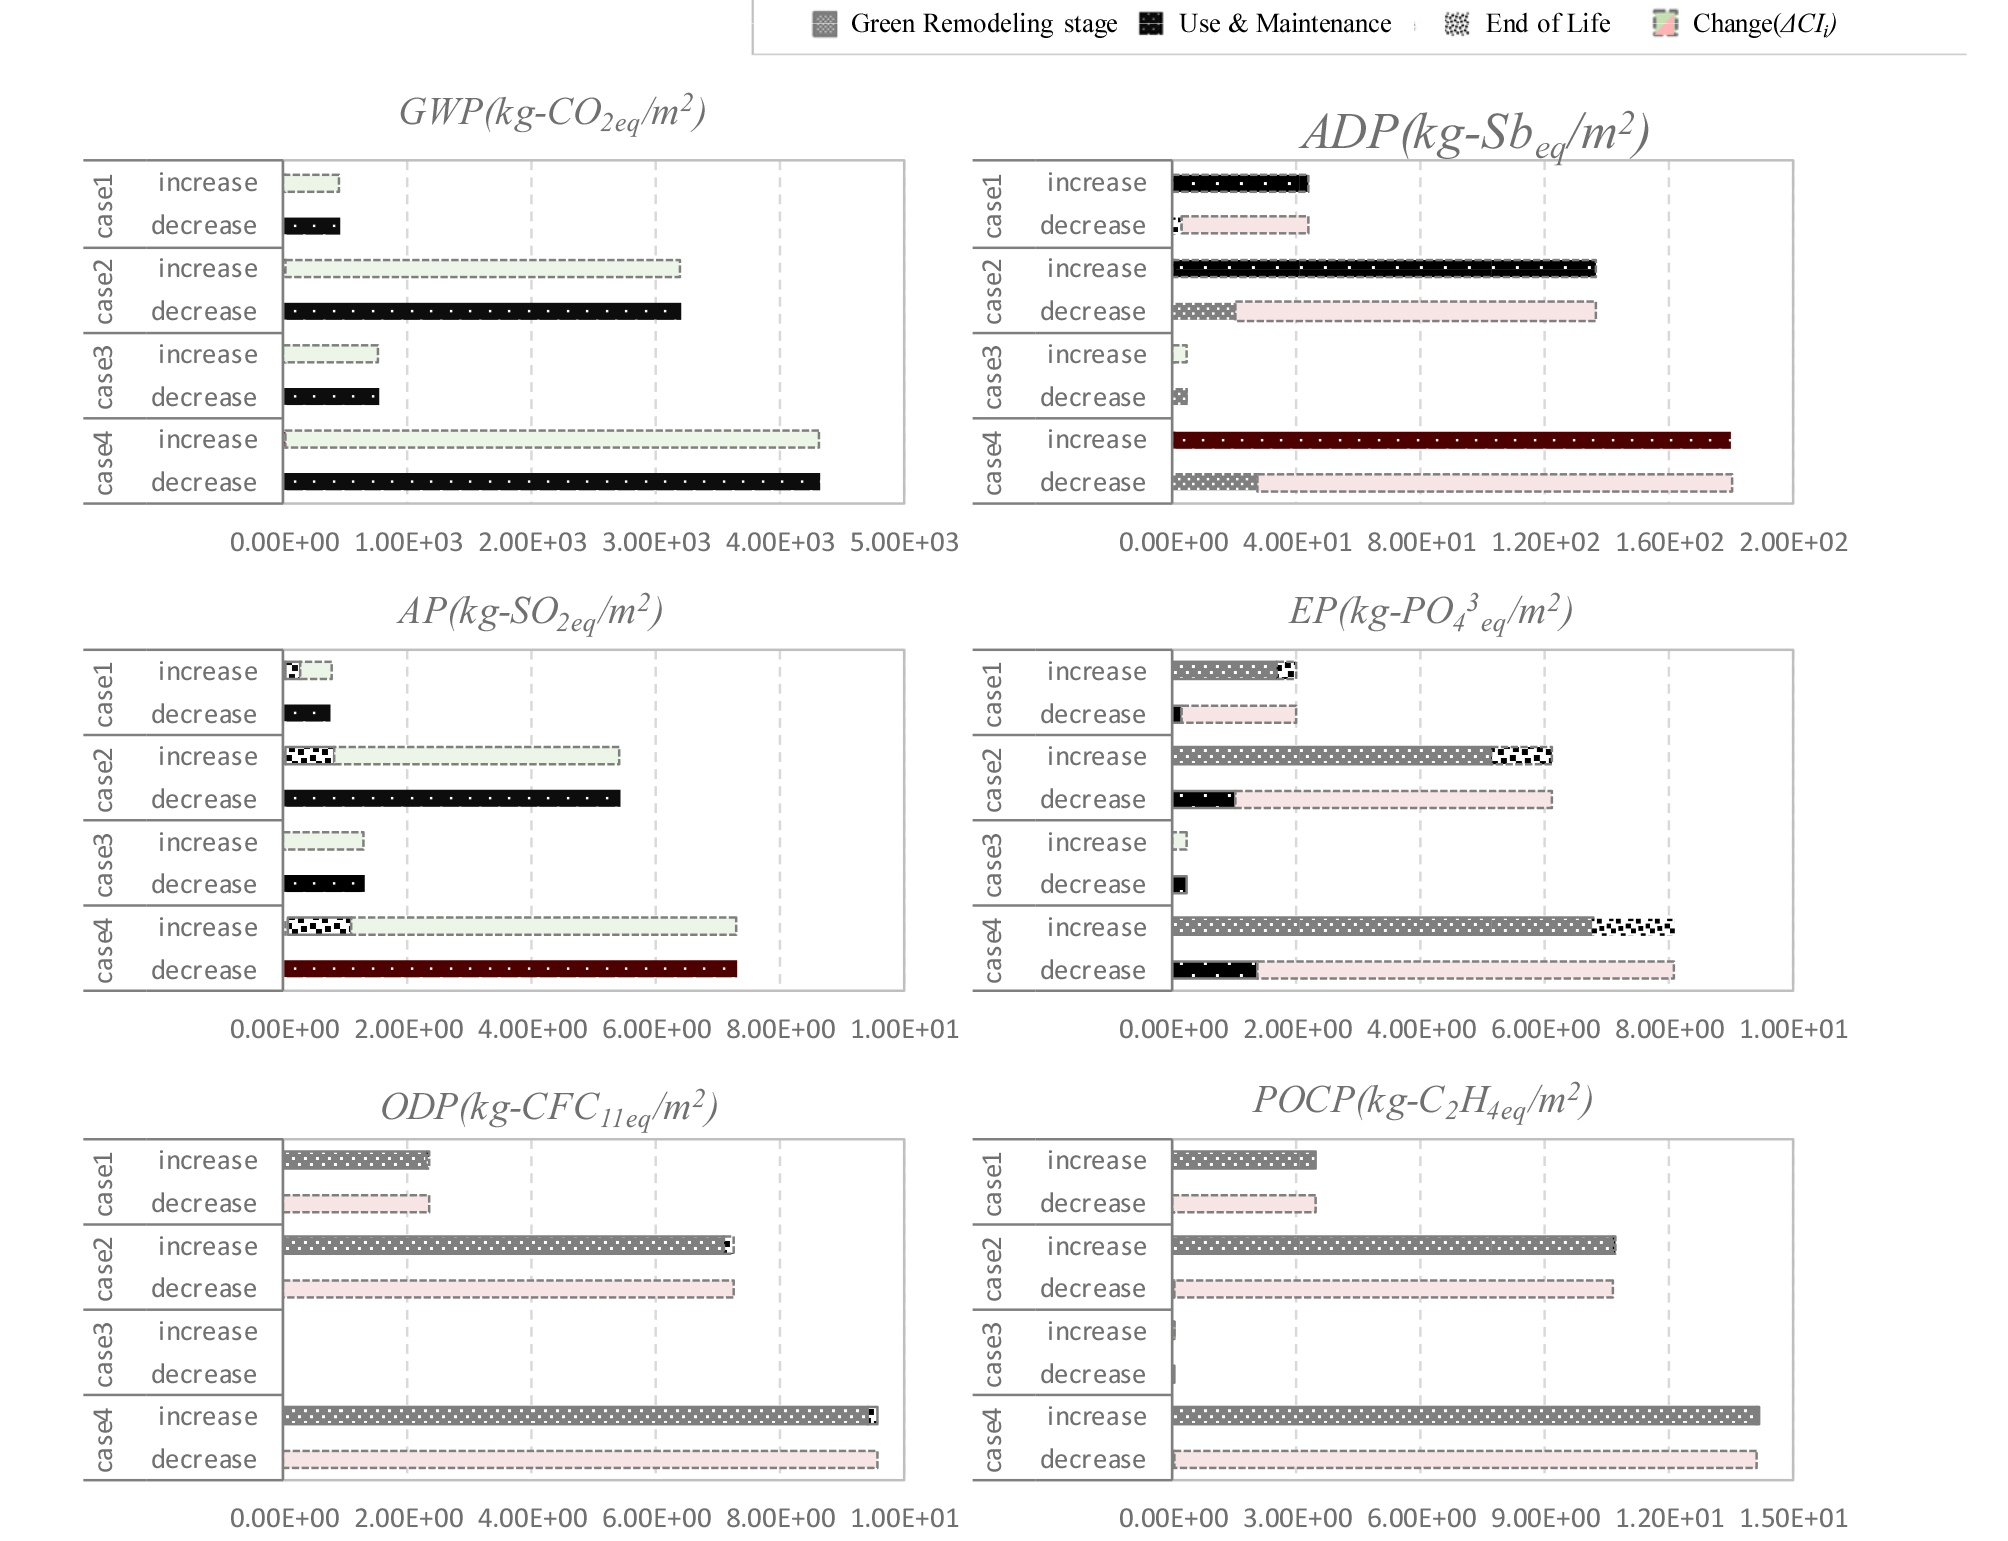
Table 4. Results of environmental impact change
GWP decrease rate of case3 is 14% of case4. However, all of 6 major environmental impacts is shown to decrease. Glass has relatively less environmental impact than phenolic foam insulation. Replacement of glass contributed satisfactorily to cooling and heating energy saving on the use energy phase.
ADP, EP, ODP, and POCP are increased than non-remodeled building In most cases except case. the environmental impact on ADP, EP, ODP, and POCP are shown to be increased due to the relatively high emission coefficient insulation compared to other construction materials.
Conclusions
This study has significance in quantitatively evaluating the environmental performance according to the envelopment retrofit by each part while increasing interest in green remodeling to reduce greenhouse gases. The main conclusions of this paper are as follows.
1.A case study was conducted to evaluate the amount of change in environmental impact of green remodeling. For case study, an experiment center located in Ansan, Korea is selected for evaluation building. The energy performance of the building is analyzed by ECO2,a software based on the ISO13790 and DIN V18599 standards. In addition, the environmental impact changes are assessed through the LCA evaluation along with energy performance analysis.
2.The system boundary is set for LCA of green remodeling building. The system boundary is set by dividing the life cycle of the green remodeling building into the green remodeling stage, the post-remodeling use and maintenance stage of life. Environmental impacts are evaluated at each life cycle, based on system boundaries.
3.Suggested to display results with environmental impact change. The difference in the amount of environmental impact of green remodeled building and non-remodeled one is defined by environmental impact change .
4.As a result, GWP and AP decreased as power consumption decreased. However, in most cases, the production of insulation has increased the environmental impact on ADP, EP, ODP and POCP. The global warming and acidification have been reduced through green remodeling. However, the implication of this result is that green remodeling causes other environmental problems such as eutrophication, resource depletion, ozone depletion, photochemical smog, etc.
5.In spite of this project to reduce the environmental impact, some environmental impact may increase, so it is necessary to evaluate various categories of environmental performance comprehensively from the design stage of remodeling.
