

Introduction
Methodology of Research
Statistical Models
Materials
Specimens Preparation and Testing
Results and Discussion
Flow
Compressive Strength
Model Fitting and Optimization
Derived Statistical Models and Expressions
Model Checking
Surface and Contour Plots Analysis
Optimization Process
Experimental Validation Study for Optimization
Conclusions
Introduction
Ultra-High Performance Concrete (UHPC) is a new generation of cement-based material presenting superior mechanical and durability properties [1, 2, 3, 4, 5, 6]. Whereas UHPC is characterized by a very high compressive strength, tensile strength, toughness, and impact resistance in addition to high workability and high durability, severe quality control is essential to obtain these exceptional properties [2, 7, 8, 9].
As with other types of concretes, UHPC can be either produced as precast sections or cast in-place at a construction site. Some components in precast structures, for example, the joints of precast UHPC sections, which still require to be cast in place [10, 11]. The section that cast in place can considerably influence the whole quality of precast structure because they are most likely to be casted under severe conditions at construction site. The rehabilitation of existing concrete structures is considered the other important application of cast-in-place [12]. The quality of UHPC that cast in place can be significantly influenced by the used curing regime. Some studies have been conducted to spread the use of UHPC to the construction site, concentrating on cast in place technologies [1] and [13].
Practical curing regimes in various construction sites may differ from those applicable for precast UHPC elements produced under high quality control and ideal conditions of a plant. Usually, a steam curing method is used to attain rapid strength improvement at early ages. Therefore, this study investigates whether the specified mechanical behavior of UHPC can be achieved after 28 days of normal moist curing without heat treatment. Another objective of this research is to examine the effects of some important mixture-determining parameters including w/b ratios, silica fume content and superplasticizer dosages on fresh properties of UHPC. An attempt was made to model and optimize UHPC mixes produced with various levels of these parameters. Such optimization is beneficial in determining the optimal proportions of the mixture components that may ensure attaining the best fresh properties, for instance, flow and superplasticizer requirements. The optimization should also target the maximum 28-day compressive strength as a strong indication of the whole mechanical performance.
Methodology of Research
Statistical Models
Design of Experiments (DoE) was followed to perform the number of tests and maintained as low as possible and the most useful combination of the variables is selected [14, 15, 16]. A Face Centered Composite Design (FCCD) is an effective method used in RSM to create a quadratic polynomial model for each response [16, 17, 18].
An FCCD structure for three-level and a continuous factor of experiment consists of (2k + 2k + c) points, where k is the number of independent variables, with 2k factorial points which are in the corners of a cube; plus 2k axial points at a distance ± α from the center of the cube, which is in the center of each face of the cube; and c center point, which are in the center of the cube. A three-dimensional sketch of FCCD for three factors and three levels is displayed in Figure 1.
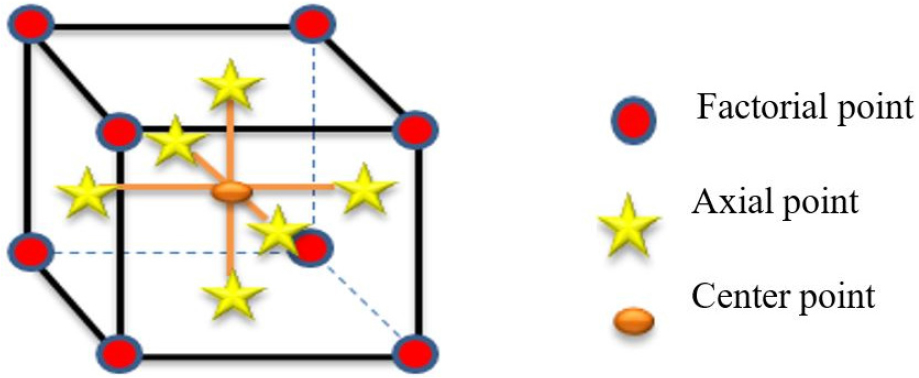
A design with 8 factorial points, 6 axial points (α = ±1), and 1 central point was used in this research.
An FCCD was adopted to estimate the responses considered conferring to Eq. (1) in the form of a quadratic polynomial model [19].
The general formula of a quadratic polynomial model is:
Where Y is the predicted response, 𝛼0 is a constant (interception), while 𝛼𝑖 are linear coefficients, 𝛼𝑖𝑗 are coefficients of the interaction and 𝛼𝑖𝑖 are quadratic coefficients; and xiand xj characterize the selected variables. The studied factors and their levels are shown in Table 1.
Table 1.
Coded and real values of the variables
| Real | Coded | -1 | 0 | 1 |
| SF, kg/m3 | A | 190 | 215 | 240 |
| SP, L/m3 | B | 2 | 2.75 | 3.5 |
| w/b, % | C | 15 | 16 | 17 |
Silica fume (SF), superplasticizer (SP) and water-to-binder ratio (w/b) were used as independent variables. Each variable was assessed at 3-levels that were coded by (+1) for maximum level, (-1) for minimum level and (0) for medium level.
The mixtures made with silica fume content of 190 to 240 kg/m3, superplasticizer of 2 to 3.5 L/m3 and water-to-binder ratio of 15 to 17% by the total weight of the binder as displayed in Table 1. The model responses that were used to run the models were flow, compressive strength at 7 days (C.S at 7-day) and compressive strength at 28 days (C.S at 28-day).
Materials
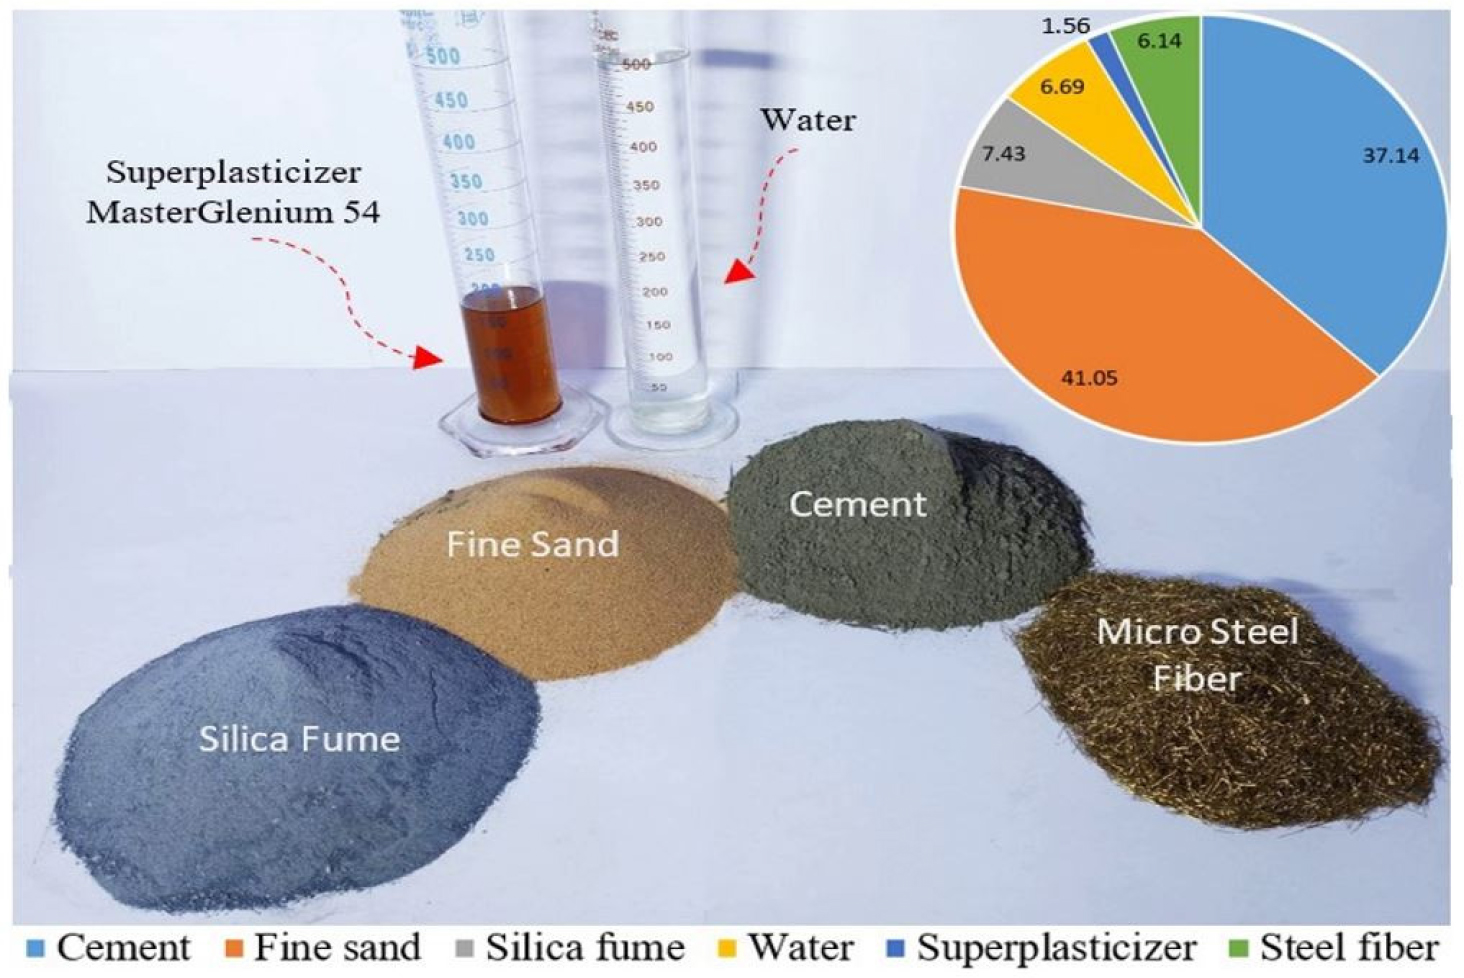
Ordinary Portland cement was used and the test results confirm that this cement follows cement class (42.5R) according to Iraqi specification IQS 5 - CEM I 42.5 R [20] specifications. Powdered SiO2 microparticles with a high specific surface area have been used throughout this study. Local natural sand was used after passing it from a sieve 0.6 mm, as recommended by the previous study [21]. A high performance concrete superplasticiser based on modified polycarboxylic ether Type F& G according to ASTM C-494 was used as an high range water reducing admixture HRWR; it has a specific gravity of 1.07 and pH of (5-8). Potable water according to IQS 1703/2018 [22] was used in the mixing and curing process of mortars.
Twenty mixes were produced to study the three key variables adopted (Table 1), which were expected to have considerable influences on the workability and compressive strength of UHPC mixes (Table 2). The mix ID starts with a number that denotes the level of the following letter.
Table 2.
Proportion of mixtures for cubic meter
Specimens Preparation and Testing
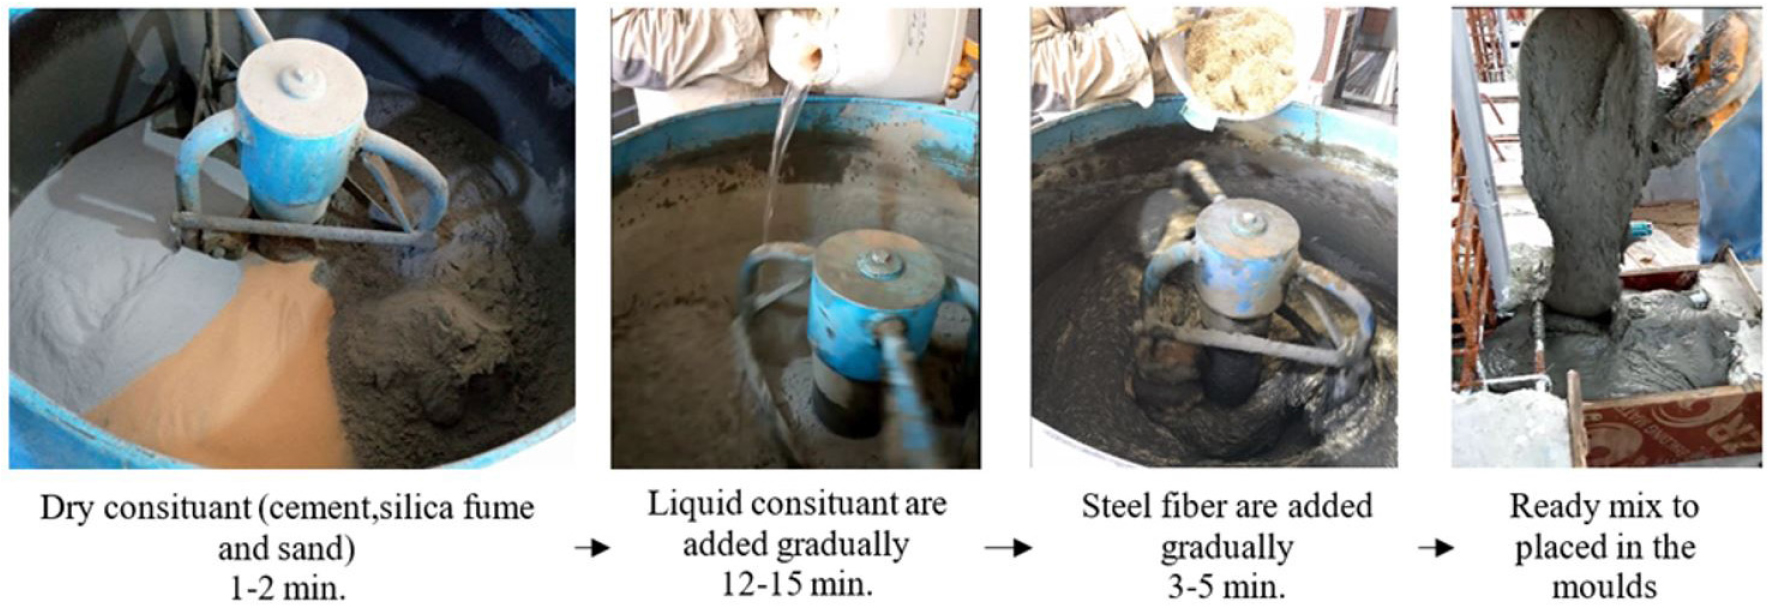
The UHPC was mixed using a high-shear mixer of 325 L capacity. The dry material (cement, sand and silica fume) were mixed first for 1-2 min. The liquids (water mixed with superplasticizer) were added gradually and left for about 12-15 min till the UHPC mixture was flowable. The steel fibres were added gradually to the UHPC mixture and mixed continuously for 3-5 min until they became well distributed inside the mixture. Then the UHPC became ready to pour in the specimens, and then after 24 h the specimens were demoulded and cured by bonding water. Figure 2 summarizes the mixing procedures.
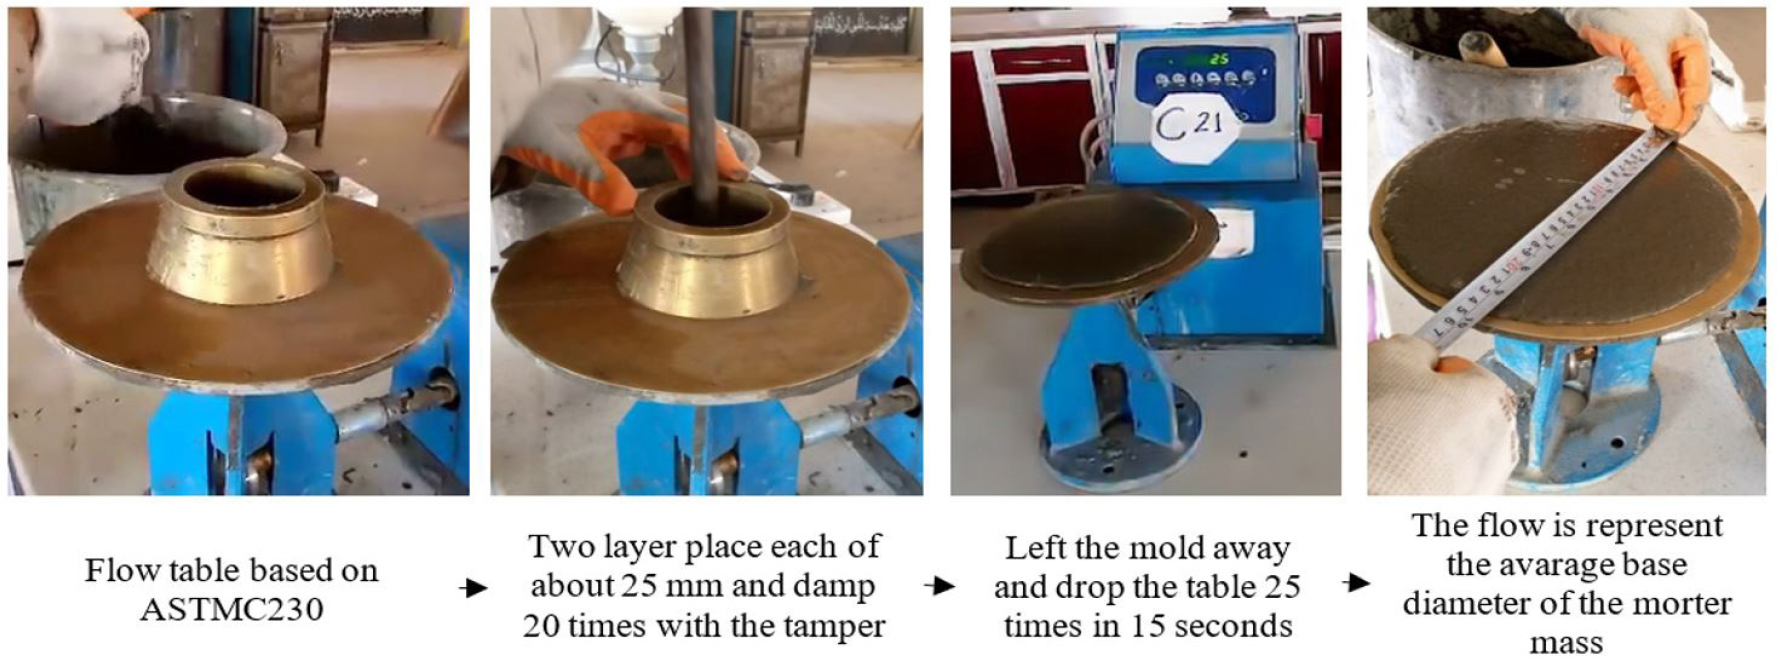
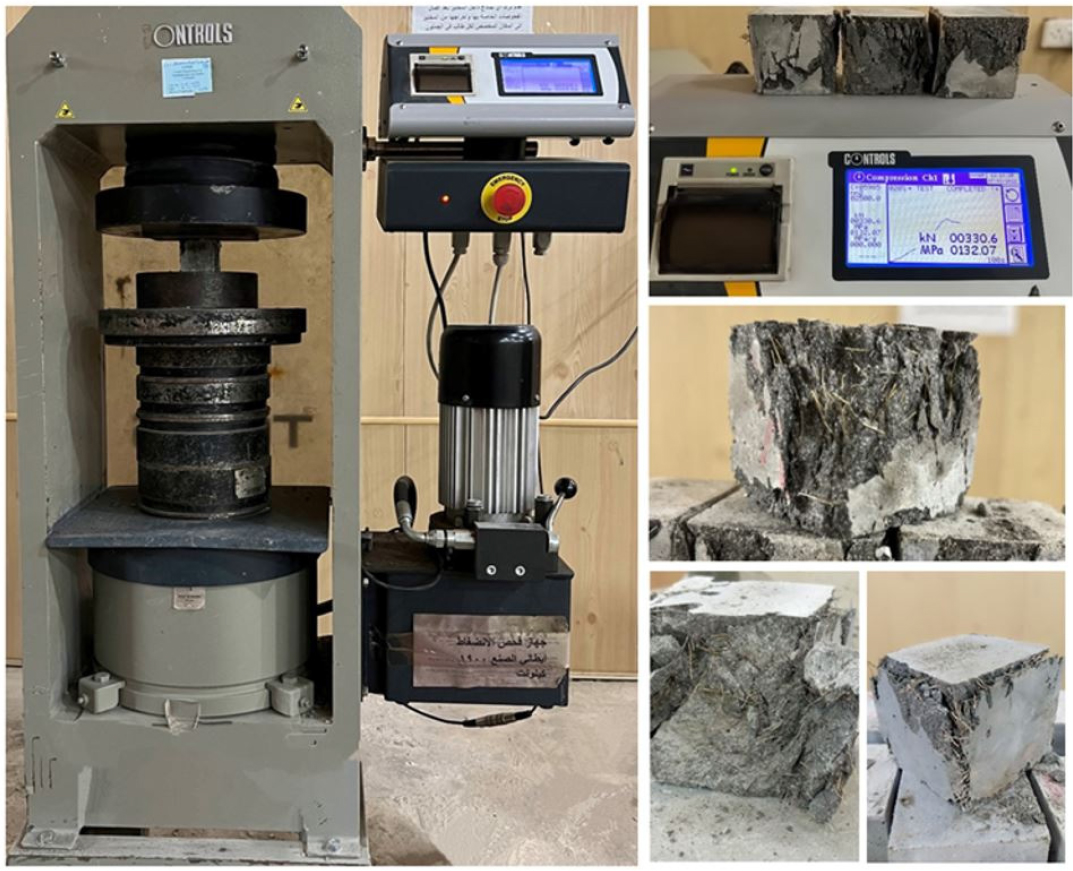
The flowability was evaluated through the flow test that was conducted based on ASTMC1437 [23]. ASTM C109-16 [24] was used to evaluate the UHPC compressive strength through a cube of side length 50 mm under a loading rate 0.75 MPa/sec as recommended by ASTM C1856-17 [25]Figures 3 and 4 illustrate the flow test and compressive test procedure.
Results and Discussion
Flow
The results of the flow test of the factorial points mixtures are presented in Figure 5. The flow was considerably effected by the investigated factors. The flow increased with increasing w/b ratio. For example, the flow increased from 185 mm to 230 mm when the w/b ratio increased from 15% to 17% for a mixture of 240SF3.5SP15w/b. The same behavior was achieved for mixture of 190SF3.5SP15 when the w/b increased to 17%. A higher water amount surrounds the fine grains better and facilitates their movement through the mix. A higher water amount produces more surface wetness of fine constituents within the mixture.
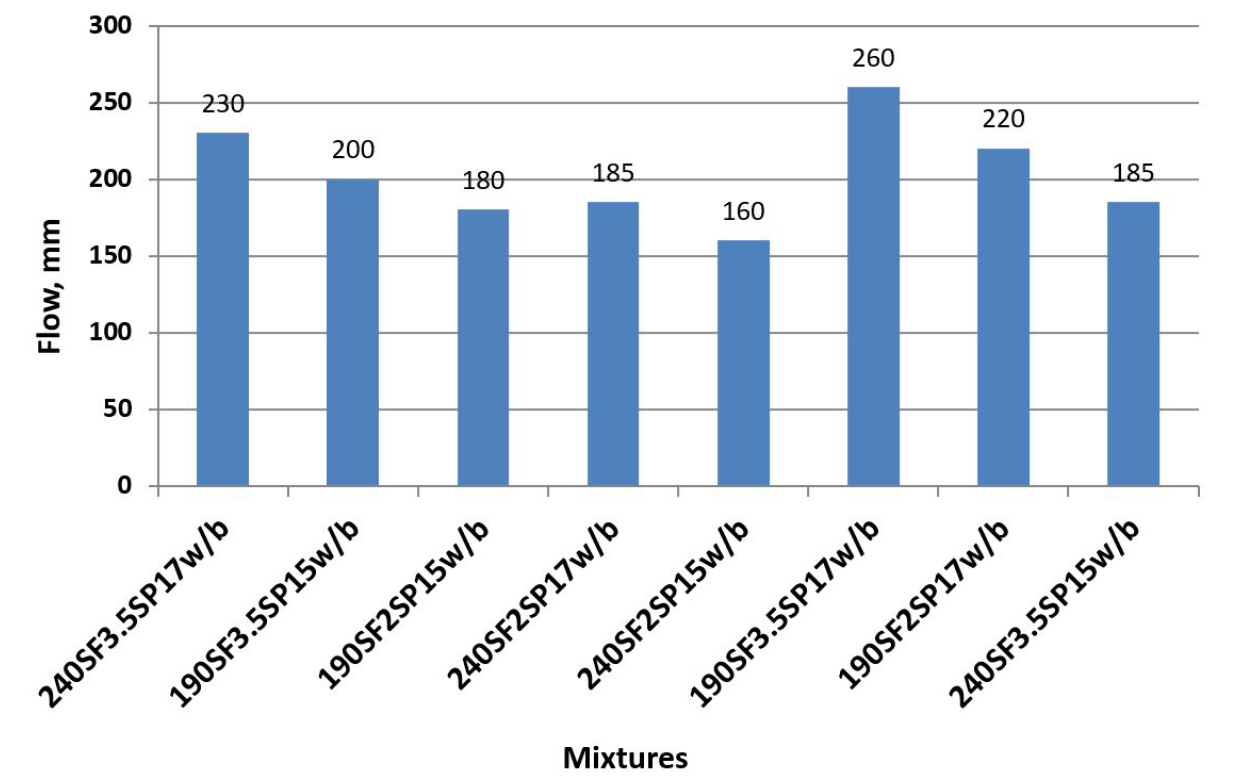
The other factor that has a significant positive effect was superplasticizer. The flow was significantly increased with increasing the superplasticizer dosage. For example, the flow of mixture 190SF2SP15w/b increased from 180 to 200 mm with increasing the superplasticizer dosage from 2 to 3.5%. As well as for mixture of 240SF2SP15w/b, the flow increased from 160 to 185 mm when increasing the superplasticizer dosage from 2 to 3.5%.
The last factor that has a significant negative effect on the flow was silica fume content.
For instance, the flow of mixture 190SF3.5SP17w/b decreased from 260 to 230 mm with increasing the silica fume content from 190 to 240 kg/m3. The significant decrease in the flow, as a result of increasing binder content, could be owing to the higher frictional resistance of cementitious materials. Microparticles may absorb high amounts of water, because of their high fineness, so decreasing the free water available for lubrication.
Compressive Strength
Figure 6 shows the 28-day compressive strengths of the factorial point mixes only. The results show that all studied variables have a significant effect on 28-day compressive strength. For instance, the 28-day compressive strength of mixture 240SF3.5SP15w/b and 240SF2SP15w/b decreased by 26% and 10% with increasing w/b ratio from 15 to 17%. The same behaviour was achieved for mixture of 190SF3.5SP15w/b and 190SF2SP15w/b which decreased by 28% and 18% with increasing w/b ratio from 15 to 17%. This trend possibly occurred because of the low w/b, which resulted in denser microstructures and produced the so-called macro-defect-free concrete [26].
From Figure 6 it can be detected that the 28-day compressive strength is influenced inconsistently by the superplasticizer dosage. For example, the 28-day compressive strength of the mixture with high silica fume content 240SF2SP17w/b decreased by 31% with increasing SP dosage from 2 to 3.5%. As well as the 28-day compressive strength of mixture 240SF2SP15w/b which was reduced by 16% with increasing the SP dosage from 2 to 3.5%. The significant effect of SP dosage was reduced with low SF content. For instance, the 28-day compressive strength of mixture 190SF2SP17w/b decreased only by 7% when increasing the SP dosage from 2 to 3.5%. Whereas the 28-day compressive strength of mixture 190SF2SP15w/b increased by 6% when increasing the SP dosage from 2 to 3.5%.
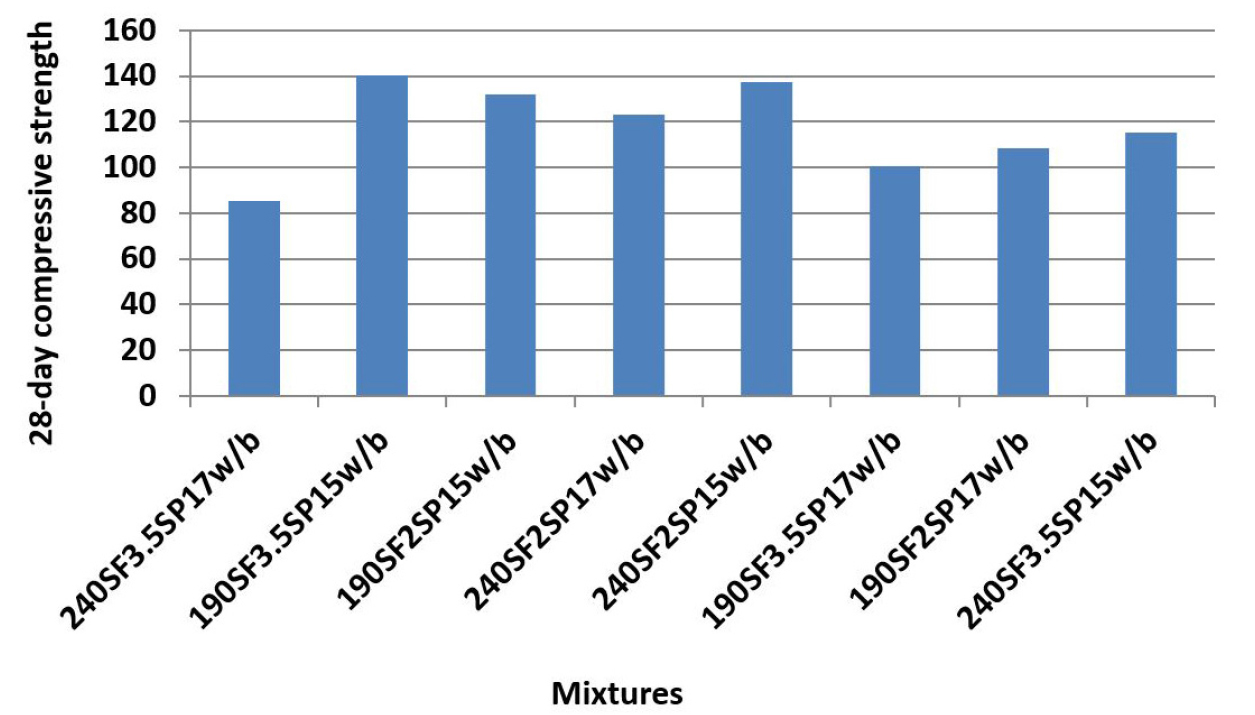
From the above figure it can detected that the SF content has a less significant effect on the 28-day compressive strength than w/b and SP respectively. The 28-day compressive strength decreased when increasing the SF content from 190 to 240 kg/m3. For instance, the 28-day compressive strength of mixture 190SF3.5SP17w/b and 190SF3.5SP15w/b decreased by 15.4% and 17.9% respectively when increasing the SF content from 190 to 240 kg/m3. Whereas, the 28-day compressive strength of mixture 190SF2SP17w/b and 190SF2SP15 w/b increased by 13.6% and 3.8% respectively when increasing the SF content from 190 to 240 kg/m3. This behaviour may have occurred because the finer binder grain contents need more water to be lubricated and complete their hydration. A low amount of water increases SF agglomeration, consequently restraining their effectiveness in developing the mechanical performance. The tendency of the SF grains to agglomerate when used in high volumes may decrease their effective surface area on the one hand and weaken their ability to create extra nucleation sites on the other hand.
Model Fitting and Optimization
Derived Statistical Models and Expressions
The process of modelling included two stages: determining a suitable model and confirming its efficiency. The process initiates with the quadratic polynomial model, Eq. (1). Then, it is followed by eliminating the parameter with the P-value ˃ 0.05. This process carries on till only the parameters which are significant P-value < 0.05 stay in the model. Subsequently, the model was created, and the following stage was to assess its adequacy by carrying out residual plots. If the plots confirm the efficiency of the model, the 3-D surface can be plotted [15].
The experimental results of responses attained are presented in Table 1. For every response (Flow, C.S at 7-day, C.S at 28-day) a quadratic polynomial model based on Eq. (1) was generated from the FCCD data. The fit regression models for Flow, C.S at 7-day and C.S at 28-day are given in Eqs (2), (3), (4).
Where SF, SP and w/b denote for the silica fume, superplasticizer and water-to-binder ratio respectively. The modeled Equations are in terms of coded variables and can be used to find predictions for a response at known levels of every variable. Every coefficient shows an estimated change in a response per unit change in the parameter value. Coded Equations are convenient for detecting the relative effect of the parameters by comparing parameter coefficients.
According to Eqs. 2, 3 & 4, a nonlinear relationship was achieved between the three responses and the three studied variables. The corresponding models represented by Eq. 2 indicated that the flow was considerably effected by the silica fume content, superplasticizer dosage and water-to-binder ratio. The water-to-binder ratio had the highest positive effect on the flow followed by a superplasticizer dosage of 20.50 vs. 16.00. While the adverse effect of silica fume on the flow was the lowest (-10.50).
The derivative model, represented by Eq. 3, shows that the C.S at 7-day was considerably affected by the water-to-binder ratio and superplasticizer dosage. The water-to-binder ratio had the highest negative effect on the C.S at 7-day followed by superplasticizer dosage -13.83 vs. -6.24. Whereas the effect of silica fume on the C.S at 7-day was negligible. Whereas, the derivative model, represented by Eq. 4, shows that all studied variables had a negative significant effect on the C.S at 28-day. The water-to-binder ratio had a principal negative influence on C.S at 28-day with a coefficient of -13.27) followed by superplasticizer dosage and silica fume with a coefficient of (-7.05) and (-4.07), respectively.
As listed in Table 3, the linear term of SF, SP and w/b were significant for the flow of UHPC since the P-value was lower than 0.05%. Since the linear term of SF, SP and w/b were significant, the flow of UHPC was considerably affected by SF, SP and w/b. But the quadratic term for (SP and w/b) were insignificant and only the quadratic term of silica fume was significant. Since the P-value of the quadratic term of silica fume was lower than 0.05, this means the flow of UHPC was significantly affected by the silica fume. The interactive terms of all studied variables have an insignificant effect on the flow of UHPC.
From Table 3, it can be detected that, since the P-value of the linear terms of SP and w/b were lower than 0.05, the C.S at 7-day was significantly influenced by the SP dosage and w/b ratio. It can be observed also that since the P-value of the linear and quadratic terms of SP, the C.S at 7-day was considerably affected by the SP dosage alone. The interactive terms of all studied variables have an insignificant effect on the C.S at 7-day of UHPC.
From Table 3, it can be detected that also, the C.S at 28-day was significantly affected by all three studied variables.
It can be observed also that since the P-value of the linear and quadratic terms of SF and SP were lower than 0.05, the C.S at 28-day was considerably affected by SF and SP alone. The interactive terms (SF*w/b) and (SP*w/b) have an insignificant effect, whereas the interactive term of (SF*SP) has a significant effect on the C.S at 28-day of UHPC.
Table 3.
Coded Coefficients
Table 4.
Results for the statistical models
The F-test and P-value were followed to find the significance of the model. The P-values for all the models were lower than 0.05, indicating their significance. Generally, the model can be described as significant, if the F value is high [27].
The significance of the statistical model can validate through proportions of variance (R2) and the difference between the adjusted R2 and the predicted R2 should be ≤ 20% [28].
The models revealed a high determination coefficient (R2) presenting 97.87%, 95.72%, and 97.16% in the responses flow, C.S at 7-day and C.S at 28-day respectively, which indicate that 2.13%, 4.28%, and 2.84% of variation only cannot be discovered by the second order model. This shows a high statistical significance and the goodness of fit of the model. It indicates also the high correlation between the experimental and predicted response values. It can observe also from Table 4, the difference between the adjusted R2 and predicted R2 of all responses (Flow, C.S at 7-day and C.S at 28-day) were lower than 20%, showing that the model of all the responses were realistic. Moreover, the adjusted R2 values were very close to the R2, which displays that no unnecessary terms were found in the model.
Model Checking
For the statistical model to be efficient, the shape of the plot of the normal probability of residuals must be structureless. The normal probability of residuals for all responses has been plotted in Figures 7, 8, 9. These Figs display that the residuals lie adjacent to a straight line, indicating that errors are scattered normally. This means that the terms involved in the model are significant. The predicted response vs. the actual response is graphically presented in the above figures. It aims to identify a value that is not easily predicted by the model. The figure also displays every irregularity in the responses.
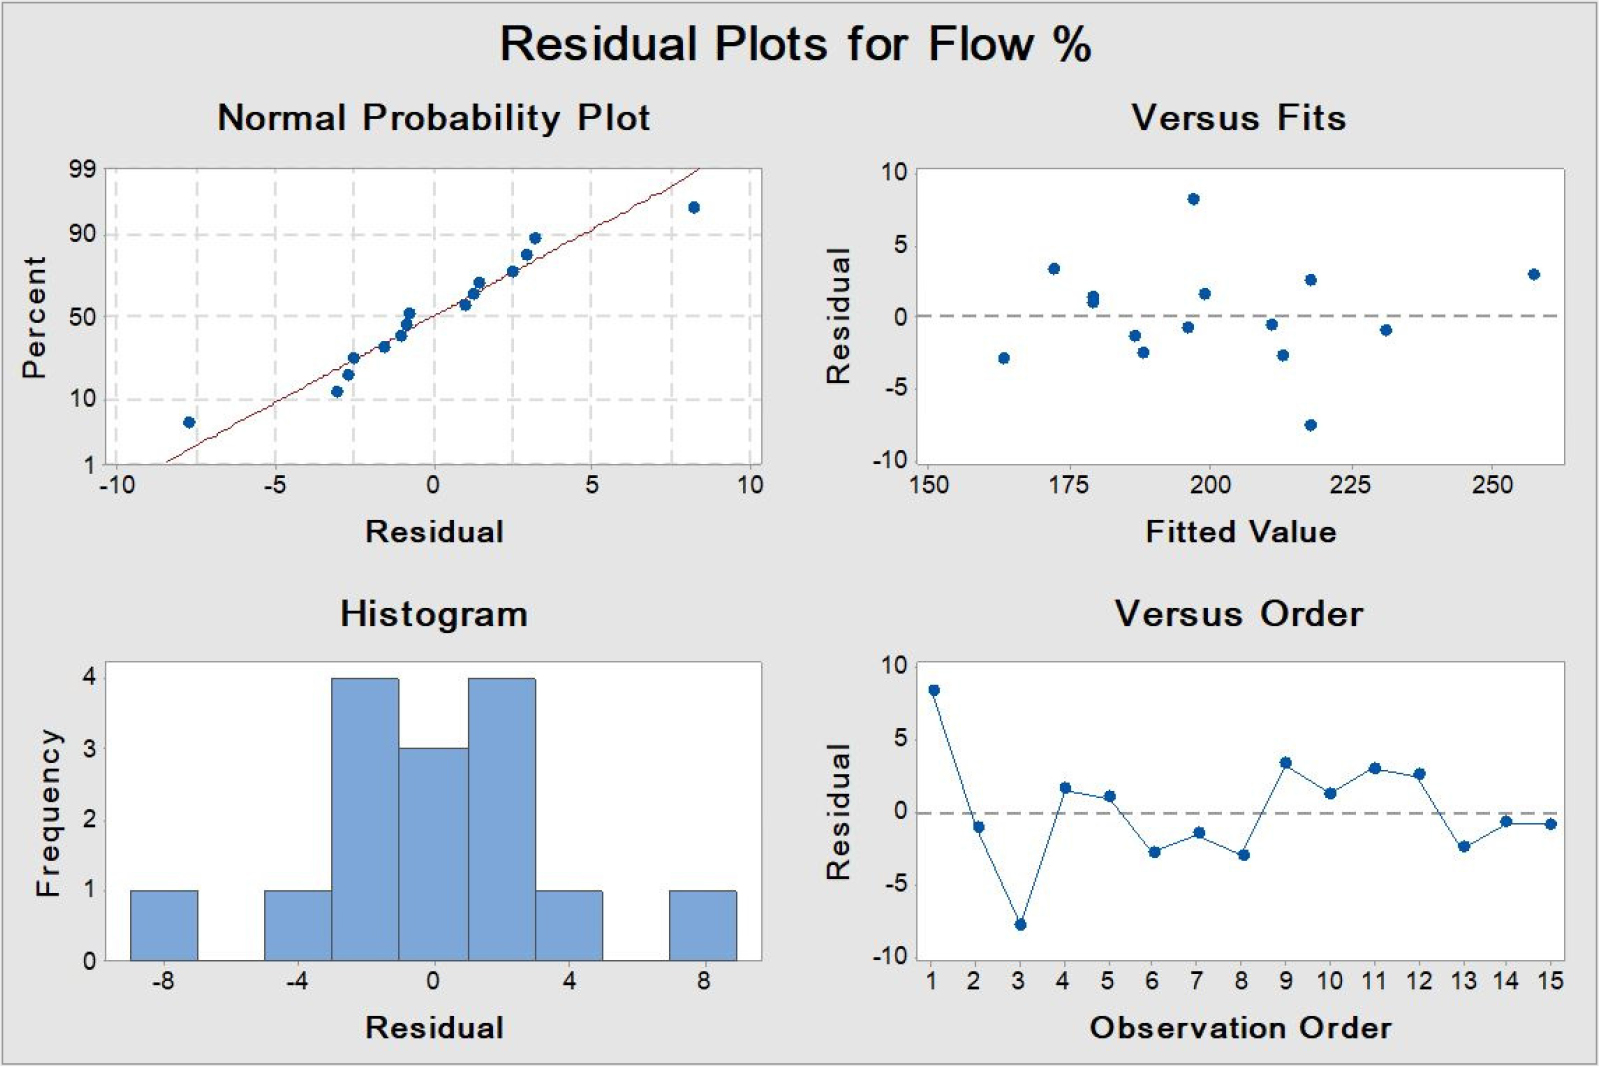
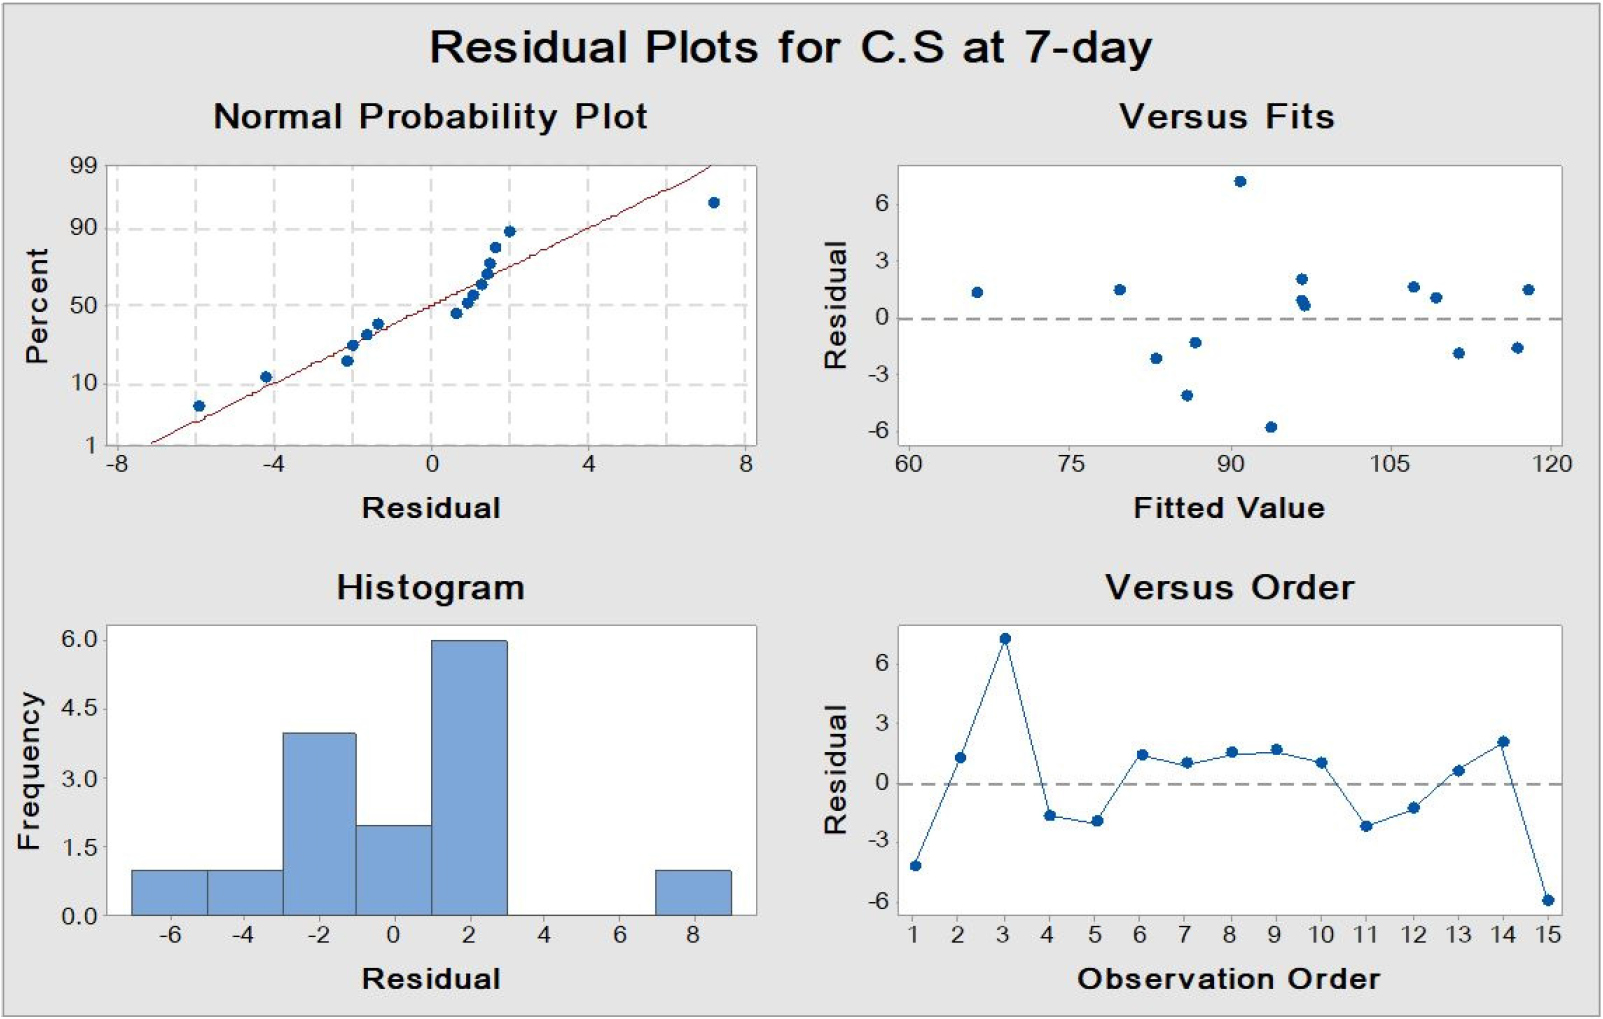
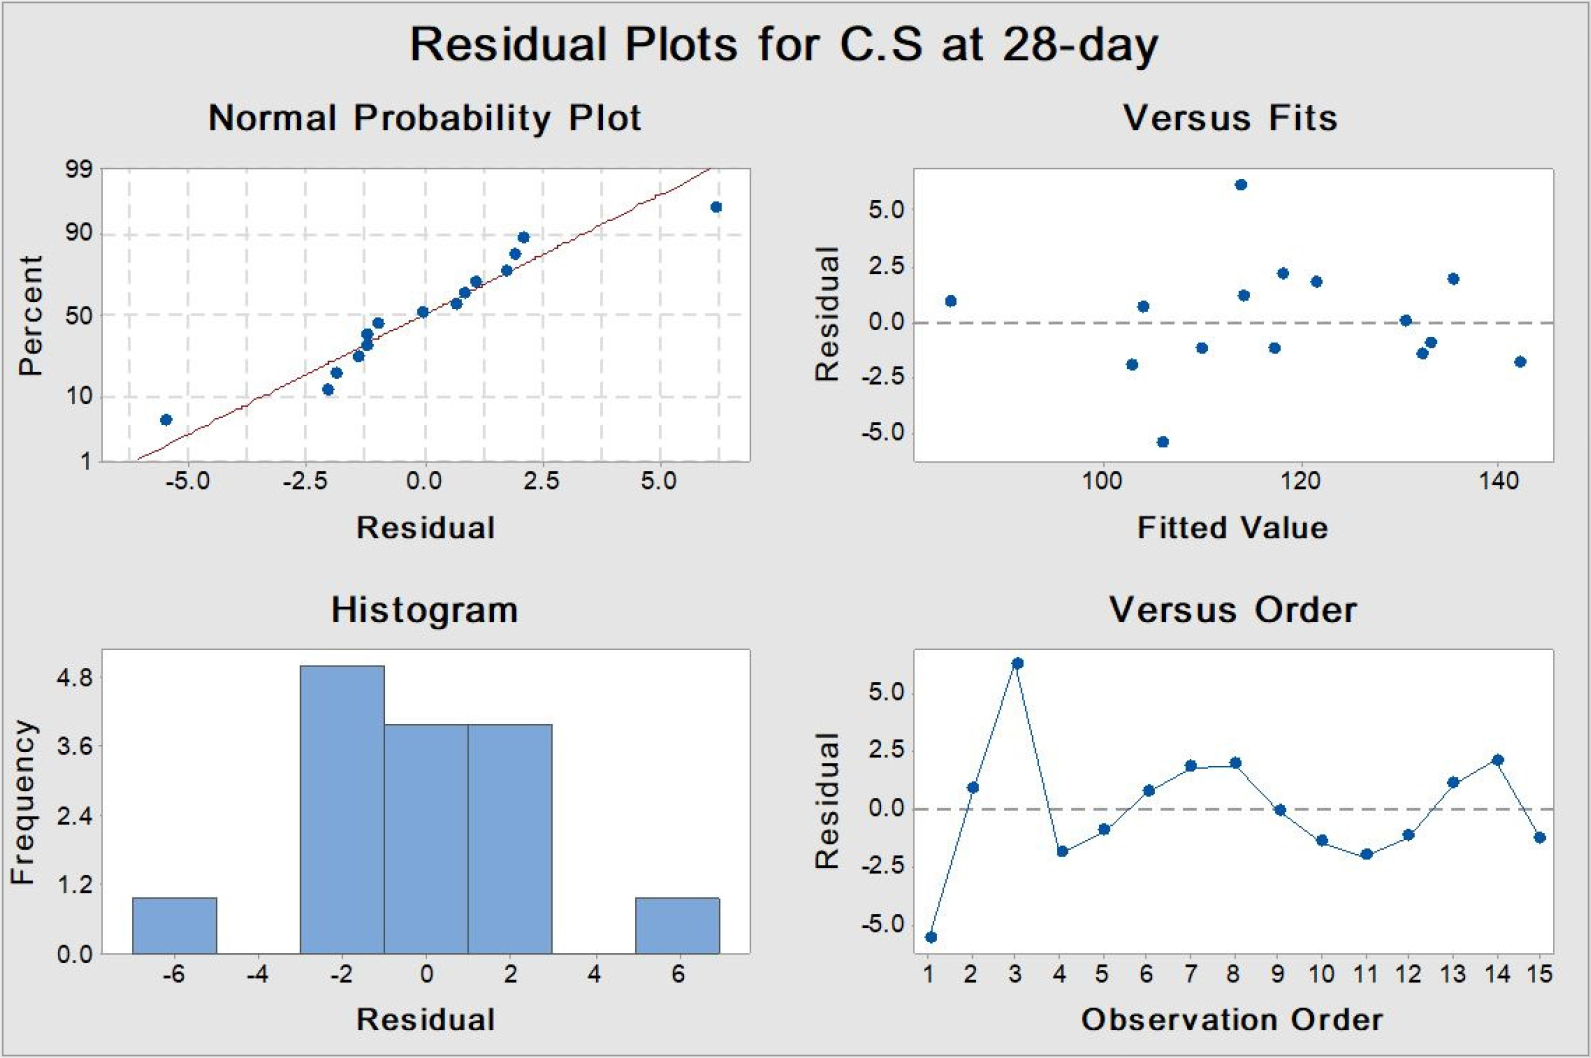
From these figures, it can be detected that the predicted values agreed with the experimental results revealing that the developed model can be used to predict flow, C.S at 7-day, and C.S at 28-day within the limits of the variables studied.
Surface and Contour Plots Analysis
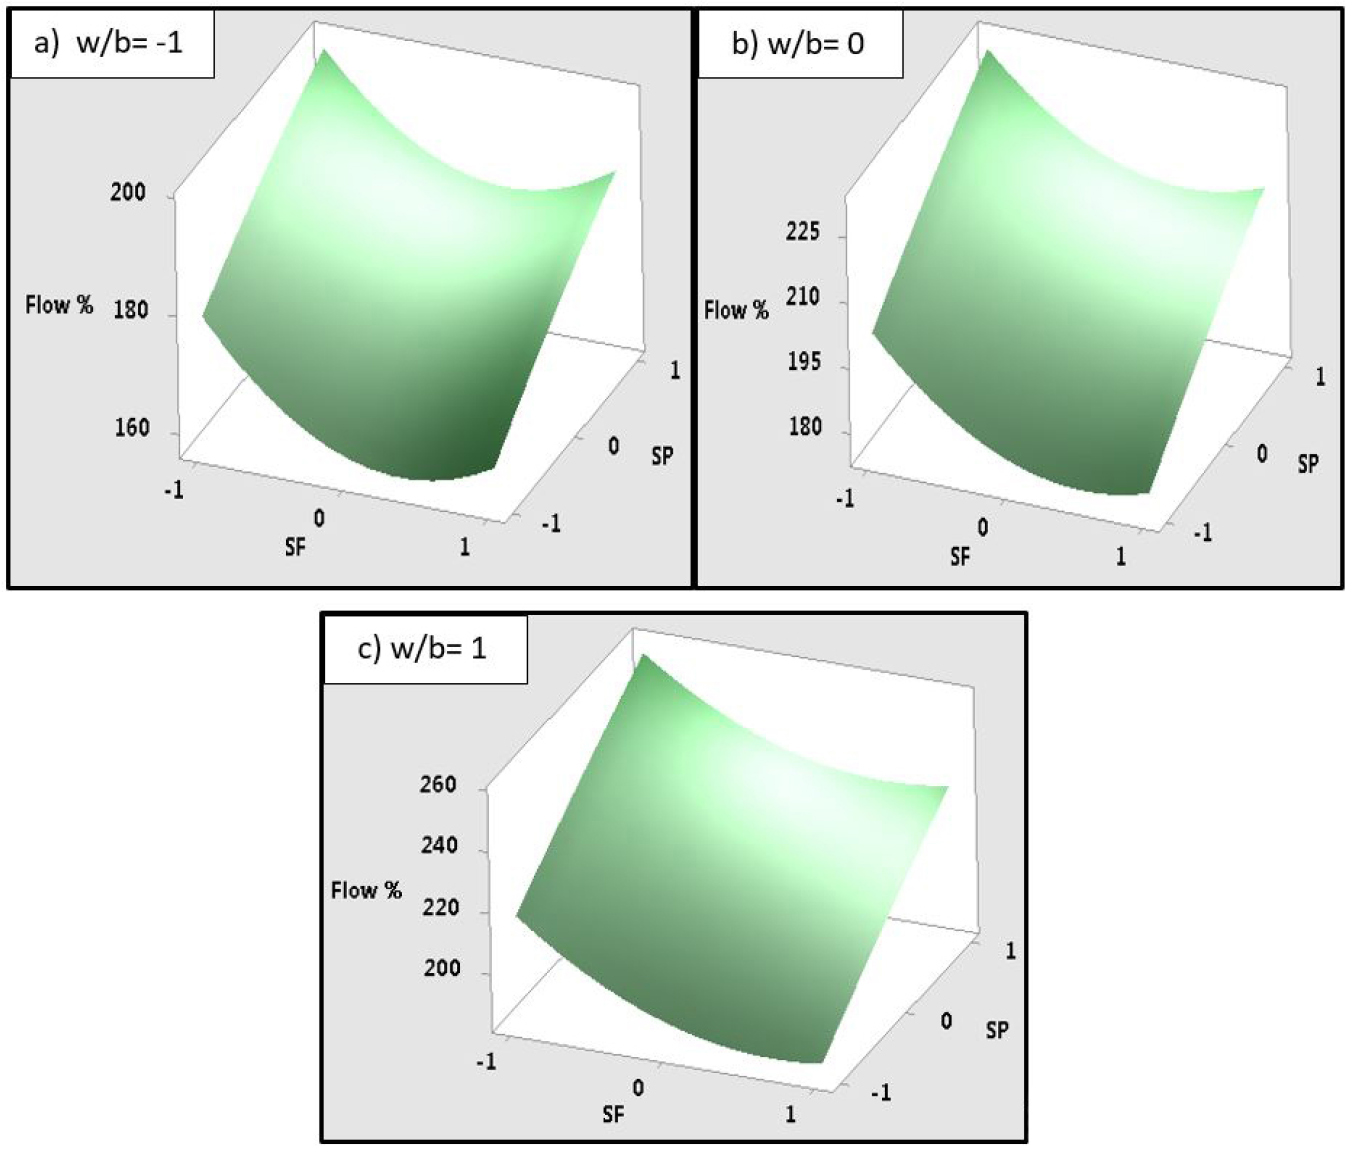
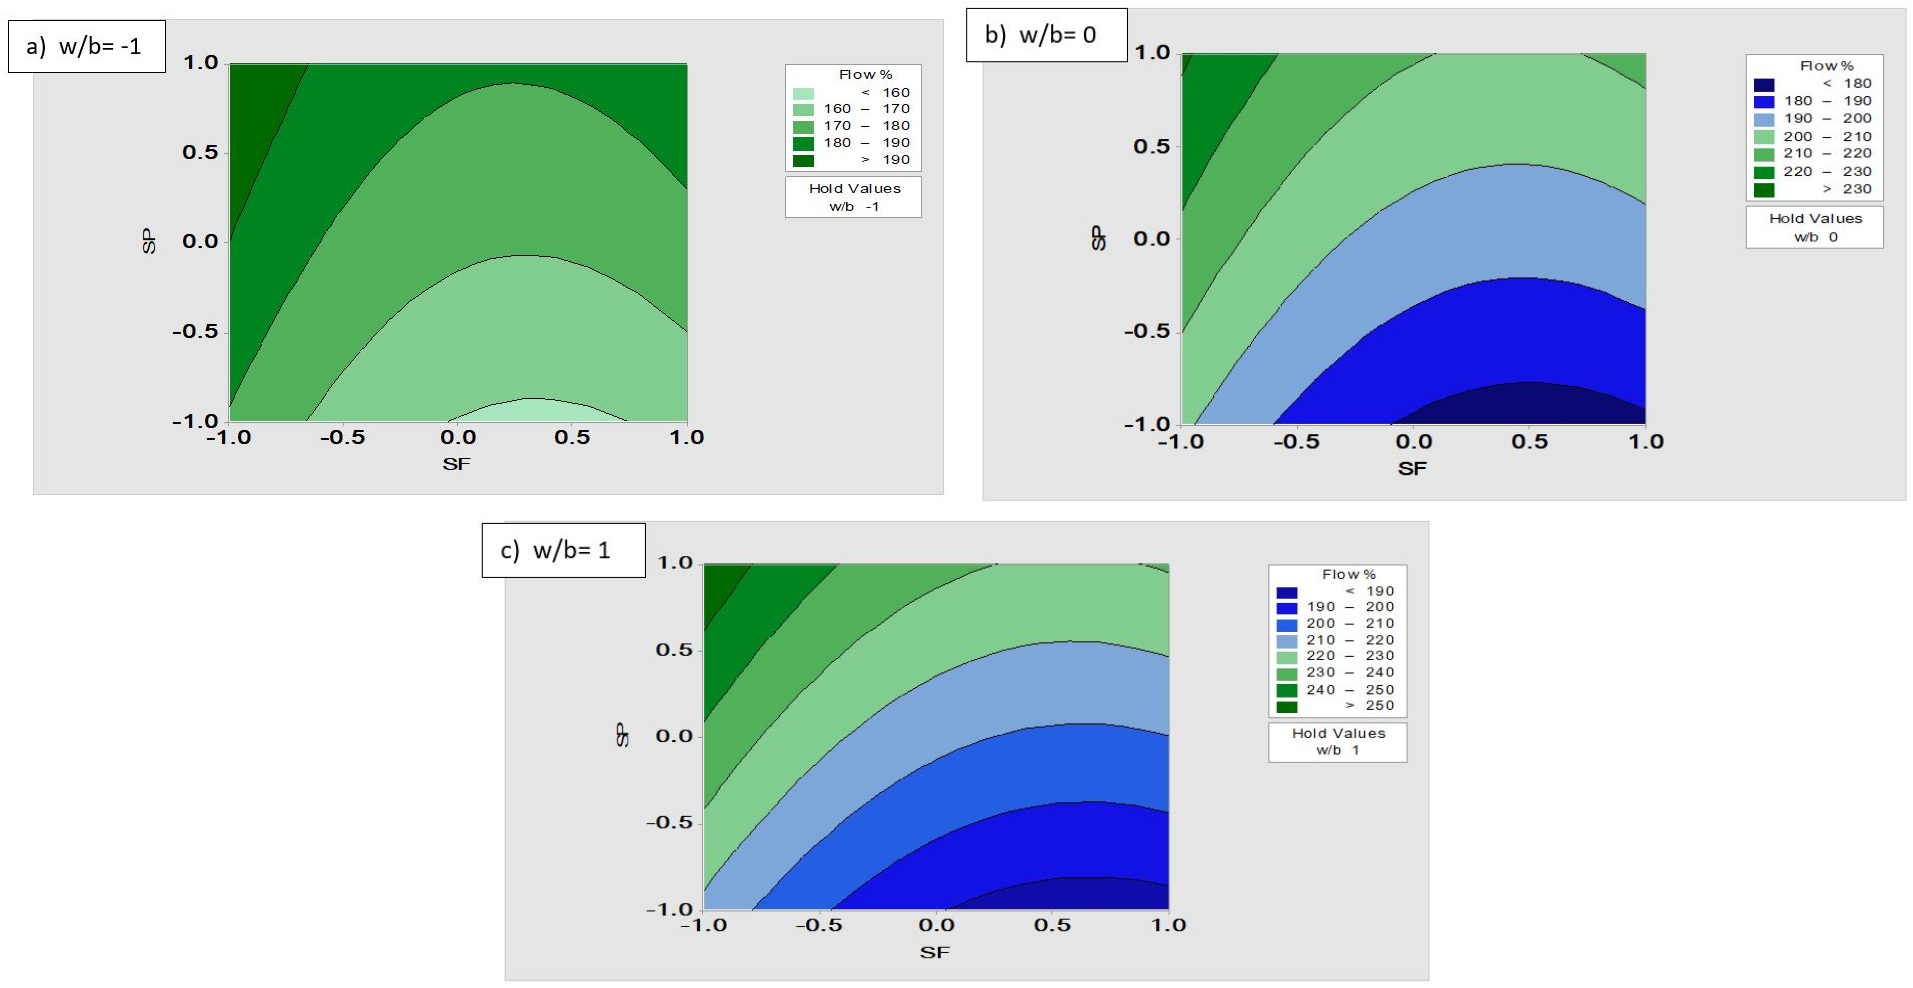
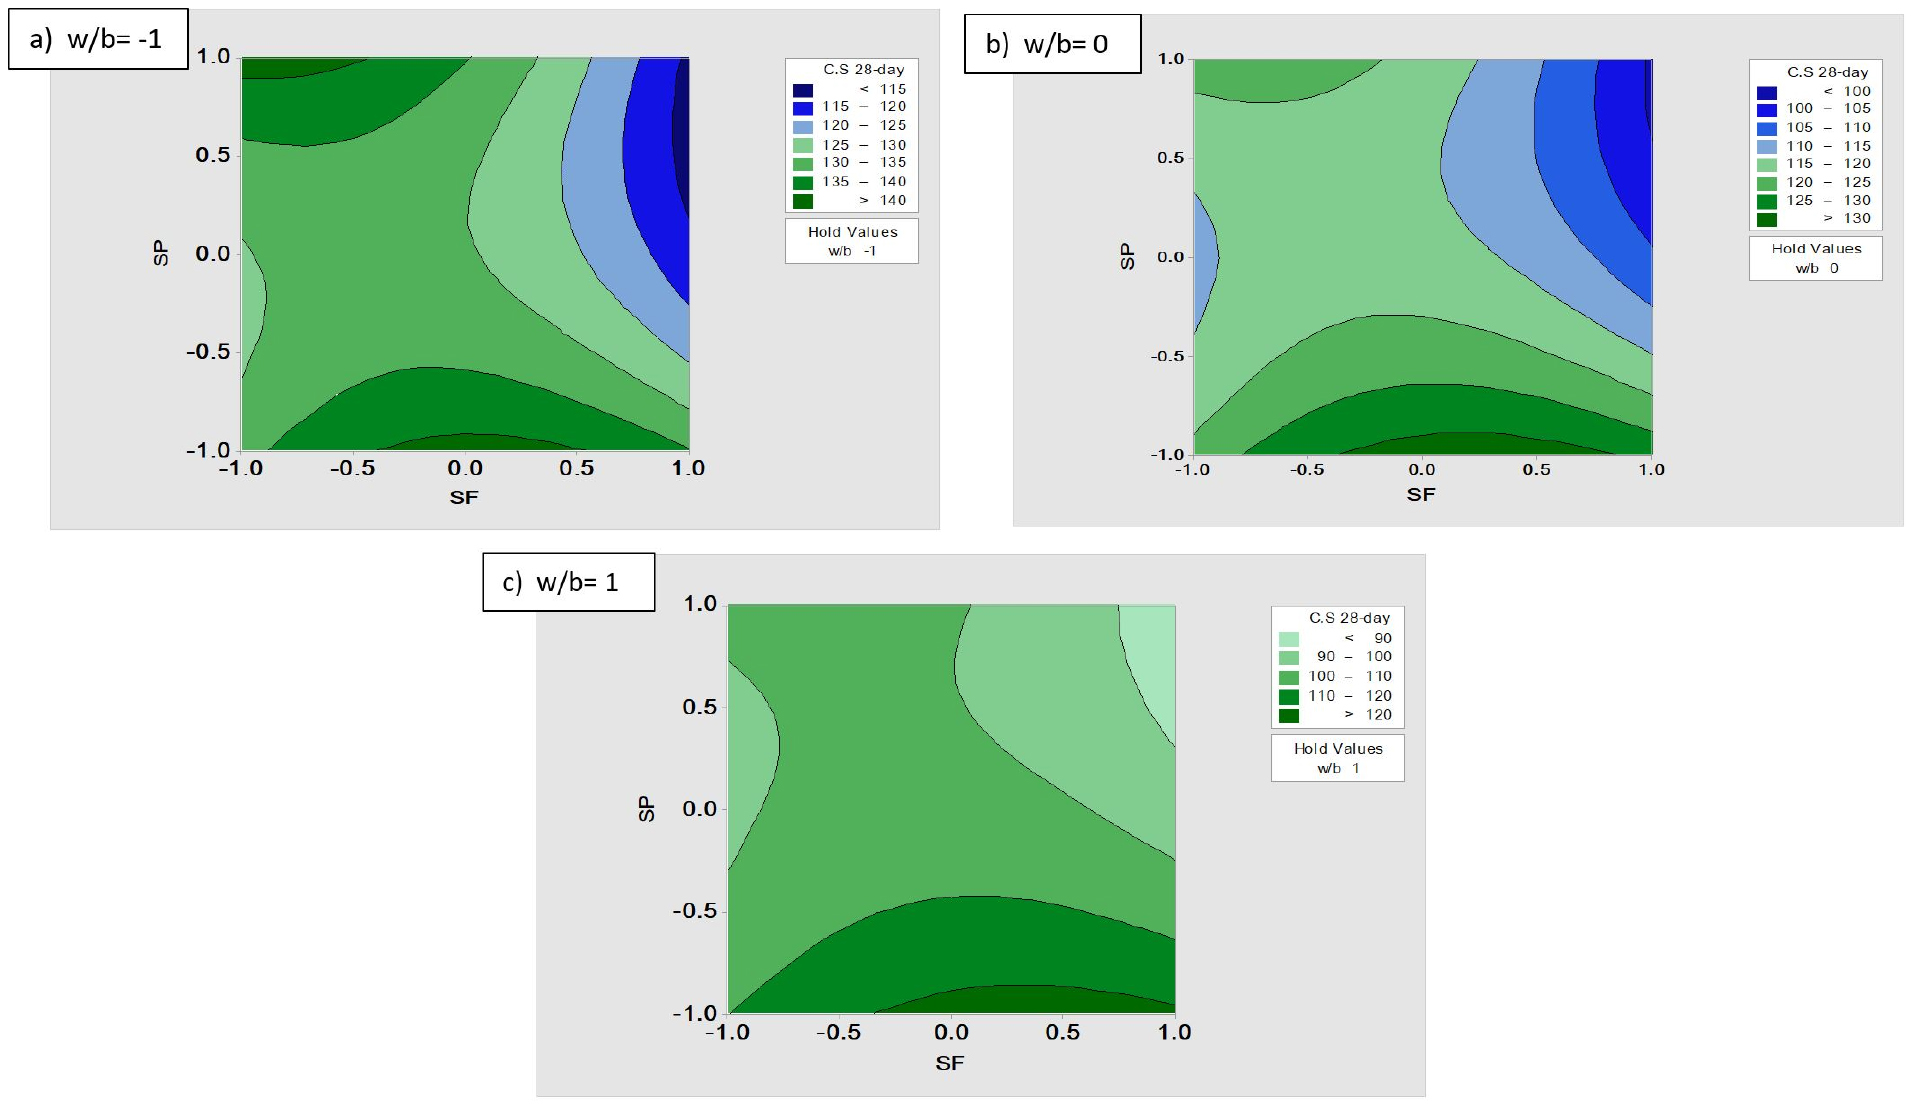
To recognize the effect of independent variables on the responses, response surface plots and contour plots were displayed in Figures 10, 11, 12, 13. In these plots, the response was plotted on the z-axis and the independent variables SF and SP were plotted in the ‘x’ and ‘y’ direction, respectively.
Figures 10 and 11 show that the significant positive influence of the w/b ratio and SP dosage on the flow while the silica fume had a significant negative effect. From these Figures, it can be observed that the increase in the content of silica fume up to 215 kg/m3 decreased the value of flow of the mixtures significantly, and beyond 215 kg/m3 to 240 kg/m3, the decrement of the flow of the mixes was diminished. The addition of silica fume influenced the flow of mixes, whereas, the influence of w/b and SP dosage was substantial on flow. This is agreed with derived Eq. 2.
According to the 3D-surface plots and contour plots, the maximum (C.S 28-day) was conforming to the 15%, 1.5% and 15% content of fly ash, nano silica and glass powder, respectively.
Figures 12 and 13 indicate that the 28-day compressive strength was decreased significantly with increasing SF content, SP dosages and w/b ratio. Whereas, the effect of the w/b ratio on C.S at 28-day was predominant. From these Figures, it can be detected that the increase in the content of silica fume from 190 to 215 kg/m3 increased the 28-day compressive strength insignificantly of the mixtures, and beyond 215 kg/m3 to 240 kg/m3, the 28-day compressive strength of the mixes was decreased. This is agreed with derived Eq. 4.
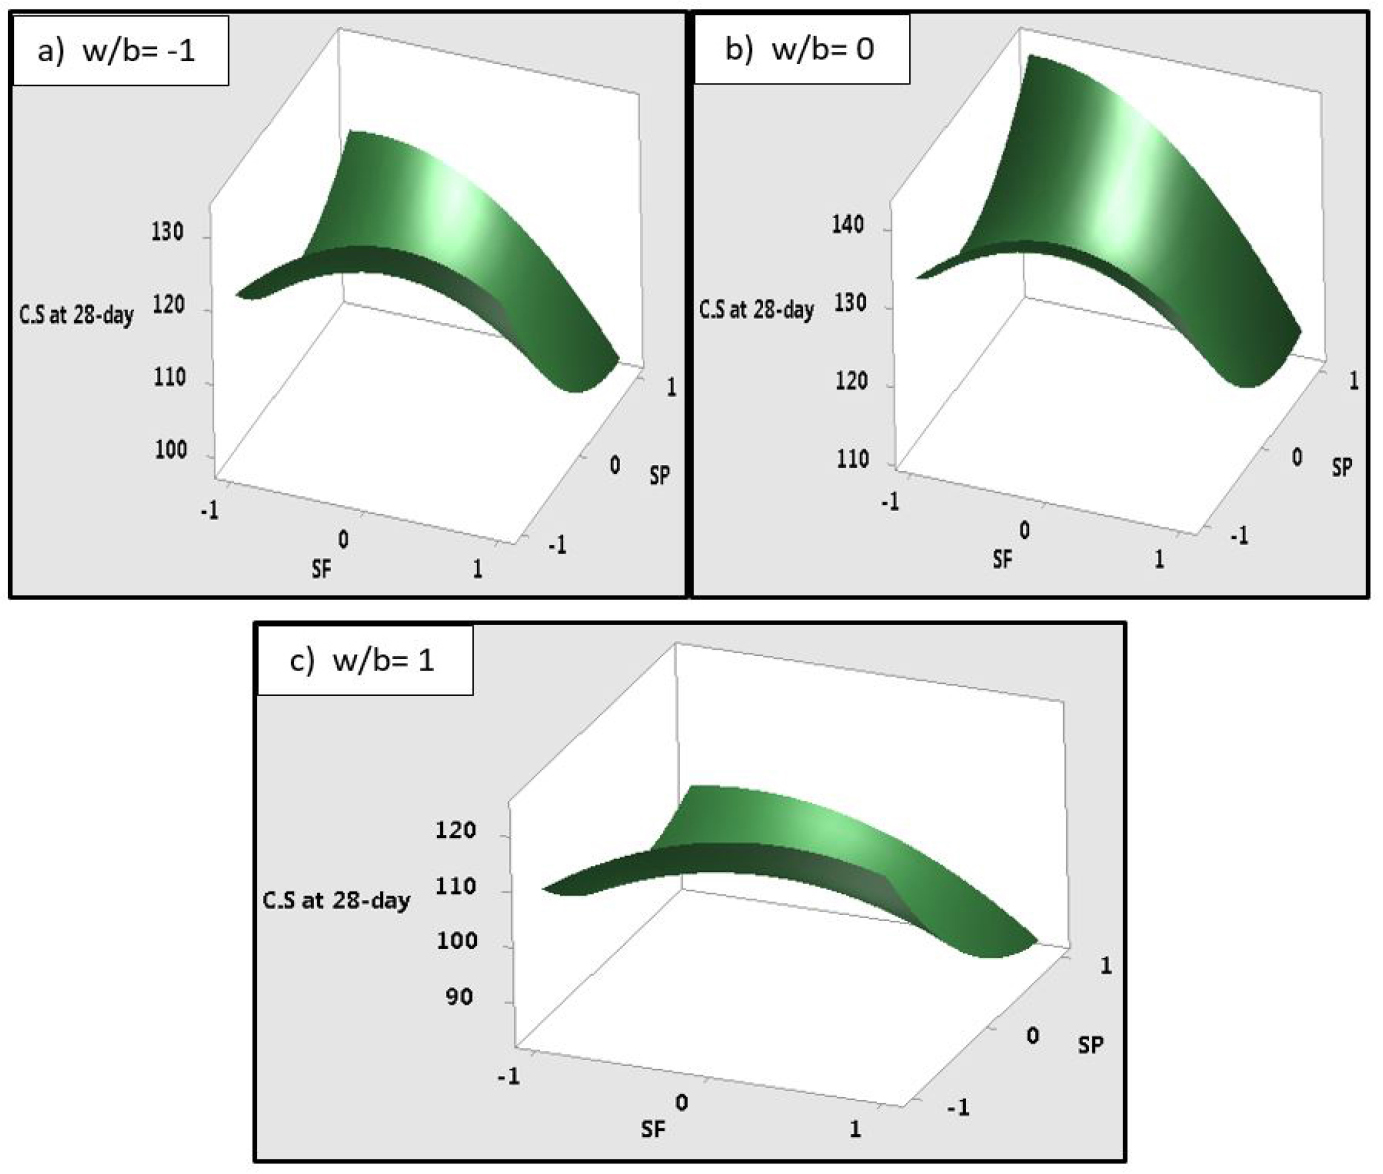
Figure 12 and 13 indicate that the 28-day compressive strength was decreased significantly with increasing SP dosage from 2 to 2.75 L/m3, while this decrement was diminished with increasing SP from 2.75 to 3.5 L/m3.
Optimization Process
The optimization process was performed to conclude the optimal solution of the independent factors that would result in the best response. After creating the statistical model between the independent factors and responses, all factors were varied independently and concurrently to optimize the objective functions [16].
In a statistical optimization process, the objective would be to relate either response or mix independent variables. The optimization process can attain by either maximizing or minimising the response or by fixing the value of the response on a definite target. The function of global desirability established by Derringer and Suich, [29]Eq. (5) was used to optimize the responses under multi-objective criteria.
Where:
D: composite desirability;
n: the number of responses;
ri: the relative importance of each individual function; and
di: individual desirability functions.
The importance determines the relative importance of independent factors and it ranges between 1 (minimum importance) to 5 (maximum importance). Individual desirability ranged between (0 to 1). One characterizes the ideal case; zero shows that one or more responses are outer their satisfactory bounds. When the composite desirability (D) is equal to 1, the combination of the various criteria is generally optimal, thus the value of response is close to the target values.
The objectives of optimization for every response are observed in Table 5. Responses optimization have been suggested to select the optimal variables of mixture design to produce UHPC mixture by maximizing the 28-day compressive strength while targeting the flow of UHPC at 210 mm according to The ASTMC1856 [25] recommendations that recommended the flow of UHPC must be ranged between 200 and 250 mm.
In this scope, the 28-day compressive strength and the flow of UHPC were described as a “maximum.” and “target” objective, respectively. Finally, one optimum solution that fulfilled the specified constraints was achieved (Table 6).
Table 5.
Responses Optimization
| Responses | Goal | Lower | Target | Upper | Importance |
| C.S at 28-day (MPa) | Maximum | 85.23 | 140.17 | 5 | |
| Flow, mm | Target | 160.0 | 210.00 | 260 | 5 |
Table 6.
Optimal mixture proportions in coded and real values
| Mixture | SF | SP | w/b | Composite desirability |
| Coded | -1 | 1 | -0.675808 | 0.810461 |
| Real | 190 kg/m3 | 3.5% | 15.675808% |
Experimental Validation Study for Optimization
The experimental validation was carried out for the optimal mixture, and the results were achieved with lesser than 5% of variation. The results of the validation tests and the arrangement are presented in Table 7.
The predicted optimized value of 28-day compressive strength and optimized value of the flow of UHPC were 135.740 MPa and 210 mm respectively, while the experimental value of them was 132.18 MPa and 220 respectively. This means only a 2.62% and 4.76% variation between the predicted and experimental.
The mix proportion of the optimized mixture was presented in Table 8 and Figure 14.
Table 7.
Predicted responses vs. experimental values
| R28, MPa | Flow, mm | |||||
| Mixture | Optimization | Experimental | Variation | Optimization | Experimental | Variation |
| Criteria | 135.740 | 132.18 | 2.62% | 210 | 220 | 4.76% |
Conclusions
In this research, local materials were utilized to investigate the influences of some crucial variables on the fresh properties and compressive strength of UHPC under normal curing conditions. The following conclusions were drawn from the experimental results and statistical model analysis.
1.Normal curing regime is the best choice for the cast-in-place UHPC, as well as it is the most economical and applicable technique.
2.Mix flowability is directly influenced by with all variables studied. It is increased considerably when increasing the w/b ratio and SP dosage and decreased significantly when increasing silica fume content.
3.A statistical model was designed and then statistically confirmed to optimize the w/b ratio, SP dosage, and silica fume dosage to develop a UHPC mixture with the best fresh mixture response (flow) and the maximum 28-day compressive strength.
4.The results of the lack of fit test and high values of coefficients of multiple determinations (R2) revealed the accurateness of the second-order model to predict flow and compressive strength at 28 days.
5.The optimum proportion of the independent variables against maximum compressive strength at 28 days and 210 mm flow were attained, which maintains highly significant to design UHPC mixes. The attained results revealed that the optimum values of the variables were (w/b = 15.68%, SP = 3.5%, and SF = 190 kg/m3) getting compressive strength of 132.18 MPa at 28 days and 210 mm flow.
Author Declarations
-Funding: no funding.
-Conflicts of interest: The authors declare that they have no conflict of interest.
-Ethics approval: This study does not contain any studies with human participants or animals performed by any of the authors.
-Consent to participate: This study does not contain any studies with human participants or animals performed by any of the authors.
-Consent for publication: This study does not contain any studies with human participants or animals performed by any of the authors.
-Availability of data and material: All data generated or analysed during this study are included in this article.
