

Introduction
Method
The Municipality of Feliz
General Approach and Estimated Flow Categories
Data Collection and Estimates
Results and Discussion
Total Food Flows and Production Patterns
Residues and Their Environmental Impacts
Conclusions
Introduction
The history of cities is deeply related to history of food production, as the surplus production of the fields was a requirement for the city’s emergence (Agudelo-Vera et al. 2011). It also can be said that the relationship between food production and cities have been in a continuous change along the centuries and that both developments determine significant pressure on the environment. With the growth of urban population, its demand also grew, in such a way that the different societies started to create complex social and infrastructure systems to provide resources and services for these high density populated areas (Lee, 2006 apud Agudelo-Vera et al. 2011). Initially, a significant proportion of the demanded resources was extracted from the cities’ surroundings, that became dependent of food supply from the surrounding rural areas, as well as from other resources, such as fibers, oil and construction materials (Billen et al. 2008).
Changes that occurred in the last century, like the population growth in large cities, the relatively low cost of transport, the global economy marked and the food preservation techniques promoted a previously unseen expansion in the agricultural market, together with a considerable spread of the cultivation areas (Billen et al. 2008). Between 1950 and 1985, the world population doubled and the global production of food grew almost three times (Agudelo-Vera et al. 2011). As a result, the supply network and consumption became much more complex. But, certainly, cities, and particularly the large ones, did not reduce their dependency from the agricultural areas, wherever where they located.
The high pressure made by the urban markets, thus required new production solutions and significant changes in the rural areas. The environmental impacts of such increase in the production scale were, at least, of the same order. According to Wirsenius (2003), the food and agriculture system is among the largest anthropogenic activities in terms of appropriation of land and biological primary production, as well as alteration of the grand biogeochemical cycles of carbon, water, and nitrogen. Moreover, the connections between the origin of the demands and the final environmental impacts became much more difficult to be identified.
These profound transformations have had a major influence on the urban metabolism, as pointed by Barles (2007). The term urban metabolism emerged a few decades ago, from the recognition that, in analogy to natural systems, the urban systems can also be understood as having a metabolism. Such concept was first used by Wolman (1965), who analyzed and quantified the overall flows of energy, water, materials, and wastes into and out of a hypothetical American city. Since then more than 20 studies have been conducted applying the metabolic approach to real cities, municipalities and metropolitan areas. The most recent studies on urban metabolism adopted the Material Flow Analysis (MFA) method, which accounts for flows of materials and energy, usually in units of mass, entering and leaving a society or economy.
It should be stressed that most of the previous studies focused on the totality of flows (not only on food flows) occurring in a city, municipality or metropolitan region. In addition, given the profile of the already investigated localities, such as metropolis or cities with regional centrality, the food flows are almost exclusively imports for citizens’ consumption, as the local production is nearly null. In other words, when one tries to understand the role of the different profiles of cities and municipalities, in face of a food and agriculture system, the results of such studies only allow to visualize the “consumption tip” of the whole chain of supply and consumption. On example of such a study is the one conducted by Barles (2009), for Paris.
Only a reduced number of studies have been focused on the investigation of agriculture specific flows. According to Wirnesius (2003), in general terms, there has not been an emphasis on explicit descriptions of the physical flows associated to a food system. In particular, physical descriptions, with basis on mass and energy units, are very rare. The majority of studies do not cover the main flows in the food system. In spite of the production, distribution and consumption patterns constitute a central topic in the international debate on sustainable development, physically coherent descriptions and analysis of the food and agriculture systems, in relation to the flows, resources use and process efficiency (such as those related to livestock food production) are relatively scarce (Wirsenius, 2003).
Identified the knowledge gap, the objective of this paper is to present an analysis of the food system and flows and their environmental implications, in the municipality of Feliz, in the State of Rio Grande do Sul, Brazil, that was adopted as a research case study. The study included: (a) a quantification of the municipality’s food flows over a one year period; (b) the identification of food production and consumption patterns; (c) the analysis of environmental impacts related to land contamination and residues generation.
The choice of the case study resulted from the analysis of the Brazilian context, where the small municipalities, that perform a central issue in the food supply system, are the ones that have to withstand the environmental impacts derived from its production. As practical contributions of this study, it is believed that a deeper comprehension of the food and agriculture system flows and their relation with potential environmental impacts can help to generate guidelines toward a more sustainable territorial planning for these municipalities.
Method
The Municipality of Feliz
The municipality of Feliz was selected as representing the reality to be investigated. It has a total area of 95,372 Km² and has its economy almost equally distributed among the primary, secondary and tertiary sectors (Prefeitura Municipal de Feliz - PMF, 2013). The analyzed food flows considered data from the year 2011, when the municipality estimated population was of 12,421 inhabitants.
The primary sector is composed by 720 agricultural properties (PMF, 2013), with activities related to horticulture and livestock, with emphasis on poultry. The production of chicken meat of is characterized as integrating an “integrated cycle”, where the animals are raised in small properties, being sold to one or more industries located in the surroundings. In this system, the industrial sector provides support to the farmers, supplying the animal´s food, technical assistance e veterinary services. This integrated system is a characteristic of the Brazilian livestock system. According to Tanimoto (2010), in 2010, Brazil was the world largest exporter of chicken meat, that is the animal commodity highest level of trading by the country. Between 1997 and 2005 the exports of chicken meat grew five times, from 673 thousand tons to 2.9 million ton.
General Approach and Estimated Flow Categories
On the same way as in recent studies, the procedures adopted here were based in the general approach of Material Flow Analysis (MFA) methods. It is conceptually grounded on a model that relates human systems and environment, considering the first included in the second (EUROSTAT, 2001). The food system of the municipality of Feliz is understood as connected to the natural environment of the municipality and to other systems (municipalities), by flows of materials.
According to such model, cities and municipalities and their subsystems are open systems, dependent on the external environment to supply part of their functions, by provision of resources and assimilation of residues (Bai, 2007). All resources required by systems are called inputs, that come from the environment (category extraction), or from other systems (category importation). All materials that leave the system are called outputs, that can be extracted or processed locally and later exported (category exportation) or can be expelled materials, after being “metabolized” (category emissions to nature / residues).
The administrative limits of the municipality of Feliz, in 2011, were taken as the geographic and temporal limits of the study (analyzed system). In Brazil, the municipalities are considered as the territorial administrative units with the lowest position in the political hierarchy. A number of consumption and production estimates aimed at identifying, along a year, the main inputs and outputs in relation to the food municipal system. No consideration is given in the study to the circulation of materials inside the system. All flows are measured in mass units (tons) as it enables comparisons. Food flows include not only the consumed food, but also the wastewater generated by the population, as well as the main input and output flows related to agriculture.
In such a way to better describe all importation, extraction and exportation flows some subcategories were created to better identify them. Its hierarchy followed a classification system adopted by countries integrating MERCOSUL, known as Nomenclatura Comum do MERCOSUL (NCM). This system is based on the Harmonized System (HS), that is the international system for classification of commodities, based upon a structure of codes e corresponding descriptions (Brasil. Ministério do Desenvolvimento, Indústria e Comércio Exterior, 2012).
With regard to residues flows there is smaller number of subcategories, as the resources tend to be mixed after being “metabolized”. The discrimination of flows categories, as well as the procedures to their estimate and the adopted sources of data are presented in the following section.
Data Collection and Estimates
The first column of Table 1 identifies what flow categories estimates were adopted, while the second indicates the procedures and sources of data. As previously mentioned, all collected data refer to 2011, with exception of some agricultural flows, where some data were extracted from Brazilian statistics referring to 2006 (IBGE, 2007), considering that the annual Municipal Agriculture Studies (PAM - IBGE), do not include the totality of cultivated cultures.
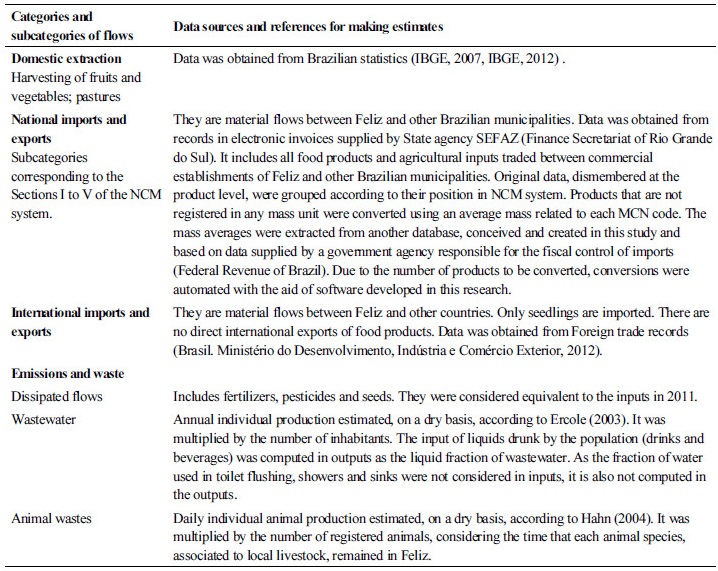
Human consumption was estimated, by product, in accordance with EUROSTAT (2001), where:
CONSUMPTION = EXTRACTION + IMPORTATION - EXPORTATION
Results and Discussion
The following three sections present, respectively: the total flows in the food system of the municipality of Feliz; the population consumption patterns; the environmental impacts associated to wastes generation.
Total Food Flows and Production Patterns
Figure 1 presents the total food flows in the municipality of Feliz, in 2011. Following the model described in section 2.2, the food system is located in the center of the figure, being surrounded by the local nature. This system is physically delimited by the municipality’s territorial limits (shown by the dotted external line). The arrows at left represent input flows, while the arrows on the right of the figure represent outputs. Flows originating from the nature in Feliz are considered extraction, while those that come from other municipalities identify imports. In addition to the flows separation according to their origin and destination, they were also divided in three groups: (a) in black, in the top, are the livestock flows, where consumption and production flows are characterized, (b) in dark gray, the horticulture flows, with corresponding consumption and production; (c) in light gray, at the bottom of the figure, are the commerce and food related industrial sectors flows. In the last group, the imports are either resold for local consumption or used as input by small scale food industries. The developed method did not allow for the separation of these last flows.
The total food flows show a total input of 114,096.90 t of materials. From this, 97,182.03 t are related to food imports and inputs into agriculture and 16,914.87 t are linked to extraction (including pastures for the livestock sector and other products harvested in the rural area of the municipality). The total output is 87,080.7 t, where 66,843.51 t are associated to exports and 20,237.19 t are residues released to nature.
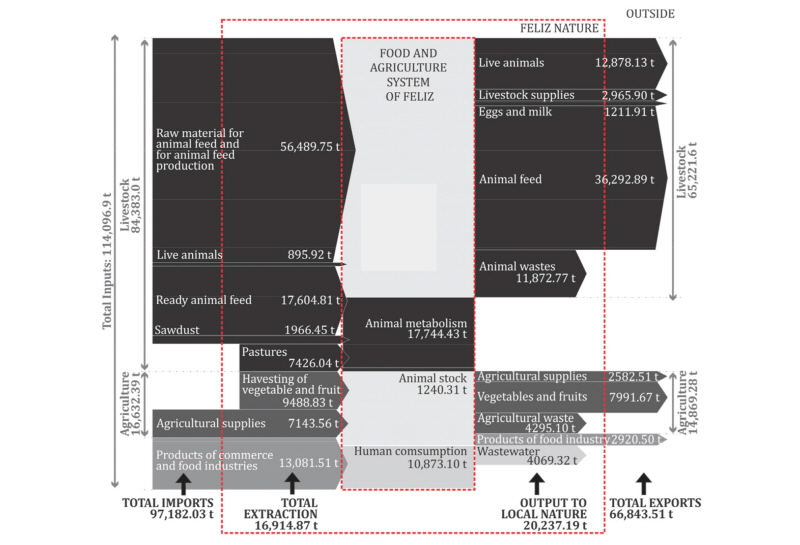
The flows identified inside the Food and Agriculture System of Feliz (inside the dashed line) correspond to animal stock and human consumption, totaling, respectively, 1,240.31 t e 10,873.10 t. The animal stock identifies the livestock both born or being raised in the municipality, either for local consumption of for future exportation.
The above referred total food flows can be compared to the total material flows, occurring in 2011, as found by Kuhn (2014), in her PhD thesis. According to Kuhn, the total materials input into the municipality in 2011 resulted in 347,453.32 t. Thus, the total food input, of 114,096.90 t, represent 32.8% of the total materials input. Almost exactly proportion (33%) was represented by the fraction of food output (87,080.7 t) when compared to total materials output (263,855.5 t).
Looking at the production patterns, it can be noticed that livestock flows are higher than those associated to the other agricultural sectors and even to the flows associated to commerce and food industries, representing 74% (84,383.0 t) of total inputs and 74.9% (65,221.6 t) of total outputs. The group of materials with higher contribution in this sector is that related to raw materials for livestock feeding, representing, on its own, 49.7% of total inputs. This group of materials, composed by corn, soya bean, residues of poultry industry, grain bran and husk, limestone, salt and bicalcium phosphate, gets into the livestock productive system as components of rations and partly is used to feed directly the animals. Also significant is the input of manufactured rations that, together with pastures, are directed to livestock feeding.
The output of livestock products is identified as rations or rations constituents, live animals and animal derived products. The most significant materials group is that of ready rations, representing 41.7% (36,292.89 t) of total output. A more detailed analysis of the results showed that the municipality of Feliz has poultry establishment where rations are prepared to further distribution among producers in the neighbor municipalities. The second major contribution to exports is associated to live animals (mostly chicken) that are sold to slaughterhouses in other municipalities.
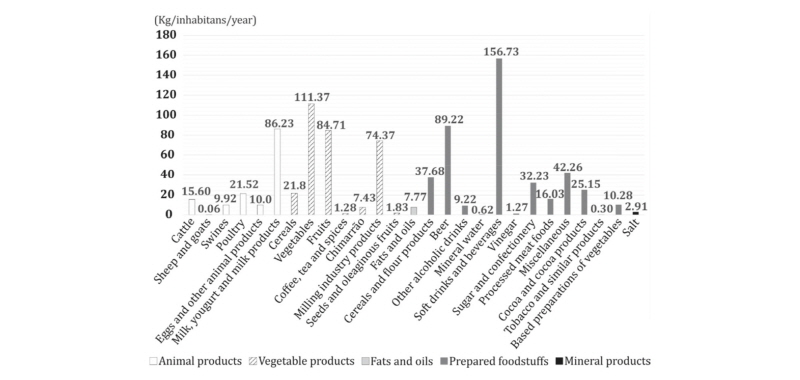
Figure 1 also shows a subcategory named animal metabolism, identified by a value that corresponds to the difference between the food consumed by the animals and the sum of live animals total exports in addition to the total of animal excrements locally produced. This large difference between inputs and outputs in animal sector is made clear when looking at the food conversion values. For bovines, for example, an average conversion value of 7.5 kg of dry mass/kg of weight increase was adopted (Rodrigues & Cruz, 2003).
Horticulture is the second major determinant of material flows. It requires the import of raw materials and supplies (7143.56 t), that contributes to the production of fruits and vegetables (9488.43 t). From the total horticulture production 84.2% (7991.67 t) is exported and the rest is consumed locally. A fraction of the imported raw materials and supplies for horticulture is sold to other municipalities.
The flows associated to commerce and food industries include, mostly, processed food for human consumption in the municipality of Feliz. The small outputs (2920.50 t) of this sector are connected to the production of small local food industries.
Consumption Patterns
The total food consumption by the population, in 2011, was estimated as 10,873.10 t, what means a per capita consumption of 875.38 kg. Comparing the results shown in Figure 2 with the NCM system classification of products categories it can be seen that 48% of the total consumption is associated with industrialized food; 34.5%, are horticultural products; 16.3%, are animal derived products; 0.9%, are fat and cooking oils and 0.3%, minerals (salt). Beverages, mostly soft drinks (157.48 Kg/cap) and beer (89.22 Kg/cap), are the individual products identified as having the highest consumption by the inhabitants of Feliz. These are followed by vegetables (111.37 Kg/cap), milk and its derivatives (86.23 Kg/cap) and fruits (84.71 Kg/cap).
Residues and Their Environmental Impacts
Table 2 quantifies the residues generated, according to the type of production. The solid residues generated by livestock represent 58.6% of the total residues produced by the food and industrial agriculture chains in the municipality of Feliz. Among these residues, those of poultry are the most significant. The highly industrialized system of poultry production requires almost exclusively industrialized food for feeding. At the same time, the confinement of the animals required the use of antibiotics and other chemical products to reduce the risks associated to pathogens. This production system started to be questioned in the 90’s, in respect to whether the use of animal excrements would be suitable for bovine feeding or for soil fertilization, due to the associated emerging contaminants (Hahn, 2004).
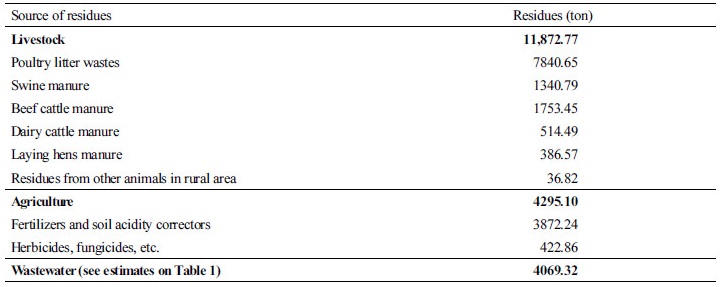
Both the agriculture and human residues are similar in terms of quantity, although with a very different composition. The agriculture residues include fertilizers, soil acidity correctors, herbicides and fungicides that are dissipated into nature, contaminating soils, atmosphere and waters.
The municipality of Feliz, in its Environmental Plan 2007, recognized this contamination and stressed the bad management of used agriculture toxic product’s packaging as one problem to be faced (PMF, 2007). Domestic effluents also are constituted, predominantly, by organic matter. As such, the risk of environmental contamination, in this case, is related to the bad management of such effluents. According to IBGE (2010), from the 4182 permanent households, 32% were served by a rudimental soakaway; 53% had a septic tank and 14% were served by domestic sewers, piped directly into the local Caí River.
Conclusions
This paper presented a quantification of food flows and an analysis of the food system of the municipality of Feliz, in the State of Rio Grande do Sul, as well as an analysis of the environmental implications related to local wastes generation. The authors are unaware of any previous study in the same direction, in Brazil. As a contribution to knowledge, the paper also presents a method for performing such estimates, with basis on methods that consider the urban metabolism, as a whole. The method allows assessing the participation of the food system in comparison to the other systems present in the municipality.
It was concluded that the flows in the food system are relevant, when compared to the overall flows occurring in the municipality, being responsible for about one third of the total mass of the input and output flows. As far as the production patterns are concerned, the livestock flows represent about 75% of the inputs and 80% of the outputs of the food system.
In relation to consumption, it was observed that the population of the municipality requires, in absolute values (in terms of mass) similar quantities to those of several Brazilian capital cities. When compared the consumption and production of food for humans, it was noticed an excess quantity of production of 83% (8290.6 t), when the fraction of food resulting from animal production is considered. It was also noticed that, occupying only 22% of the total area of the municipality, the horticultural production reached a total mass that is 3.9 times higher than that consumed by local population. This does not imply that the municipality is self sufficient in terms of food, as it produces a limited number of products, most of them being not locally industrially processed, and it imports the majority of products having its origin in the food industry.
With regard to residues, it can be said the total mass with origin in the agriculture and livestock systems are significant, when compared to those food system sectors that do the conversion of raw products into industrially processed ones. Although being more significant, the livestock residues are much more easily managed than those from agriculture that usually are dissipated into the environment and can be toxic.
A general analysis of the food system of a municipality, as the one performed in the present study, allow planers and managers to identify and propose strategies connecting flows from different sectors, in such a way to migrate from a model of linear metabolism to one almost circular. For example residues from one sector, such as manure, can used as resources, as a fertilizer, into agriculture, thus replacing chemicals and saving money.
Studies like this allow the evaluation the food (in)dependency of a municipality and the establishment of guidelines to increase its resilience. Furthermore, they can create opportunities to develop regional or national policies that contribute to the evaluation of the environmental management strategies in use in municipalities with different profiles and can help to the creation of specific policies. Such actions enabling practical application of studies like the present one, are considered of fundamental importance to achieve more sustainable cities and municipalities.
