

Introduction
Material and methods
Material
Framework of fire risk evaluation
Spatial information-based platform of fire risk evaluation
Results
Discussion
Conclusions
Introduction
The recent advent of the intelligent revolution era has highlighted the importance of developing a smart city that can enhance urban efficiency, improve the benefits of citizens and quality of their lives, and achieve sustainable innovative growth based on technologies, such as techniques that apply spatial information, the Internet of Things (IoT), the cloud, big data, mobile technology, and artificial intelligence (AI) [1, 2, 3].
The implementation of a smart city requires the establishment of urban infrastructure related to construction, civil engineering, and transportation, network connections, and data sharing based on IoT technology, as well as the development of intelligent services that have practical use. It is also crucial to connect spatial information platforms, which are utilized to integrate actual and cyber spaces and to facilitate information exchange [4]. To meet such requirements, the United States has initiated a Virtual 3D-City project to perform urban design based on three-dimensional (3D) spatial information in the fields of car navigation, emergency rescue management, training, promotion, and education. The United Kingdom has operated spatial analysis centers to generate content pertaining to traveling, urban planning, and public promotion on spatial information platforms. Finland has implemented an Arena 2000 Real Cyber City project to build virtual reality cities and apply these cities to the fields of traffic control, fire and accident monitoring, and traveling based on geographic information system (GIS) services [5, 6]. South Korea has also made numerous attempts to use spatial information platforms and implement smart cities. For example, the Land and Geospatial Informatrix Corporation operates a national spatial information portal that provides various types of basic information on the development of spatial information technology. The Ministry of the Interior and Safety offers a service called Korea Safety Map to provide services that are related to security, nearby searches, and the safety of traffic, facilities, industries, and health care, as well as safety against disasters, forest fire, and accidents [7, 8, 9].
Smart cities, whether newly developed or existing, should protect citizens from different types of disasters [10]. For this reason, intelligence augmentation systems for disaster management, which presents the optimal solution by analyzing information on disastrous situations in real time, have been developed as core technologies for smart cities. In addition, the use of AI algorithms that analyze fire prone facilities based on spatial information has been employed to ensure fire safety in smart cities [11, 12, 13]. Firebird, which is a framework developed by the Atlanta Fire Rescue Department in Atlanta, USA, is a representative algorithm that uses spatial information to analyze fire prone facilities. This framework predicts fire prone commercial buildings with a 70% accuracy based on machine learning and Geocoding as well as coordinate information, and its performance has been constantly improved through research [14, 15]. Furthermore, several countries have conducted research to develop technologies that can generate fire risk maps by using information regarding the location of the target area collected by unmanned aerial vehicles and information on building properties according to the environments and purposes of use [16, 17, 18, 19, 20, 21, 22].
This study analyzed the applicability of fire risk evaluation technology based on spatial information as a core technology for smart cities. To this end, fire risk evaluations based on spatial information were performed for an area designated as a target zone for a housing environment improvement project in Daegu, South Korea.
Material and methods
Material
Figure 1 shows an aerial photograph of the target area selected for the case analysis in this study. Daegu Metropolitan City classified this area as a target zone for the housing environment improvement project in accordance with the Act on the Improvement of Urban Areas and Residential Environments formulated in South Korea. The housing environment improvement project was initiated to conserve, maintain, and improve residential environment by enhancing the residential environment in urban areas, which are characterized by residences of low-income citizens in a group, extremely poor rearrangement infrastructure, and excessively concentrated deteriorated and defective buildings, or expanding rearrangement infrastructure and community-based facilities in areas characterized by concentrated detached houses and multi-unit houses. Table 1 presents the standards that were employed for the designation of target areas for this project. First, the number of deteriorated or defective buildings should account for two-thirds of all buildings in the target area. Second, the target area should meet at least one of the standards for designation of the target area related to unlicensed buildings––the proportion of occupied roads having widths below 4 m, proportion of houses located on roads 4 m or more in width, land area below the standard established by ordinances of local governments, and building density (the number of building units built per hectare within a maintenance area).
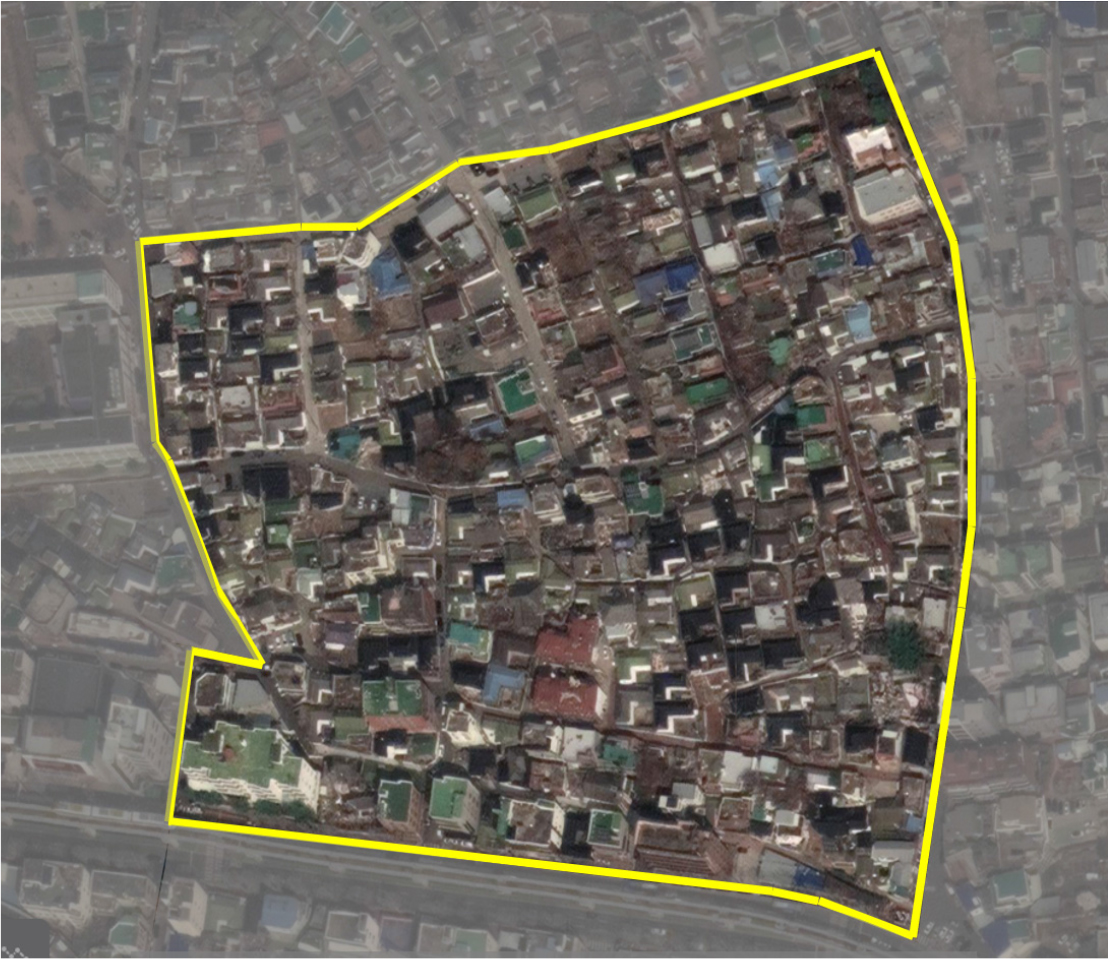
Table 1.
Standards for designation of the target area for the housing environment improvement project
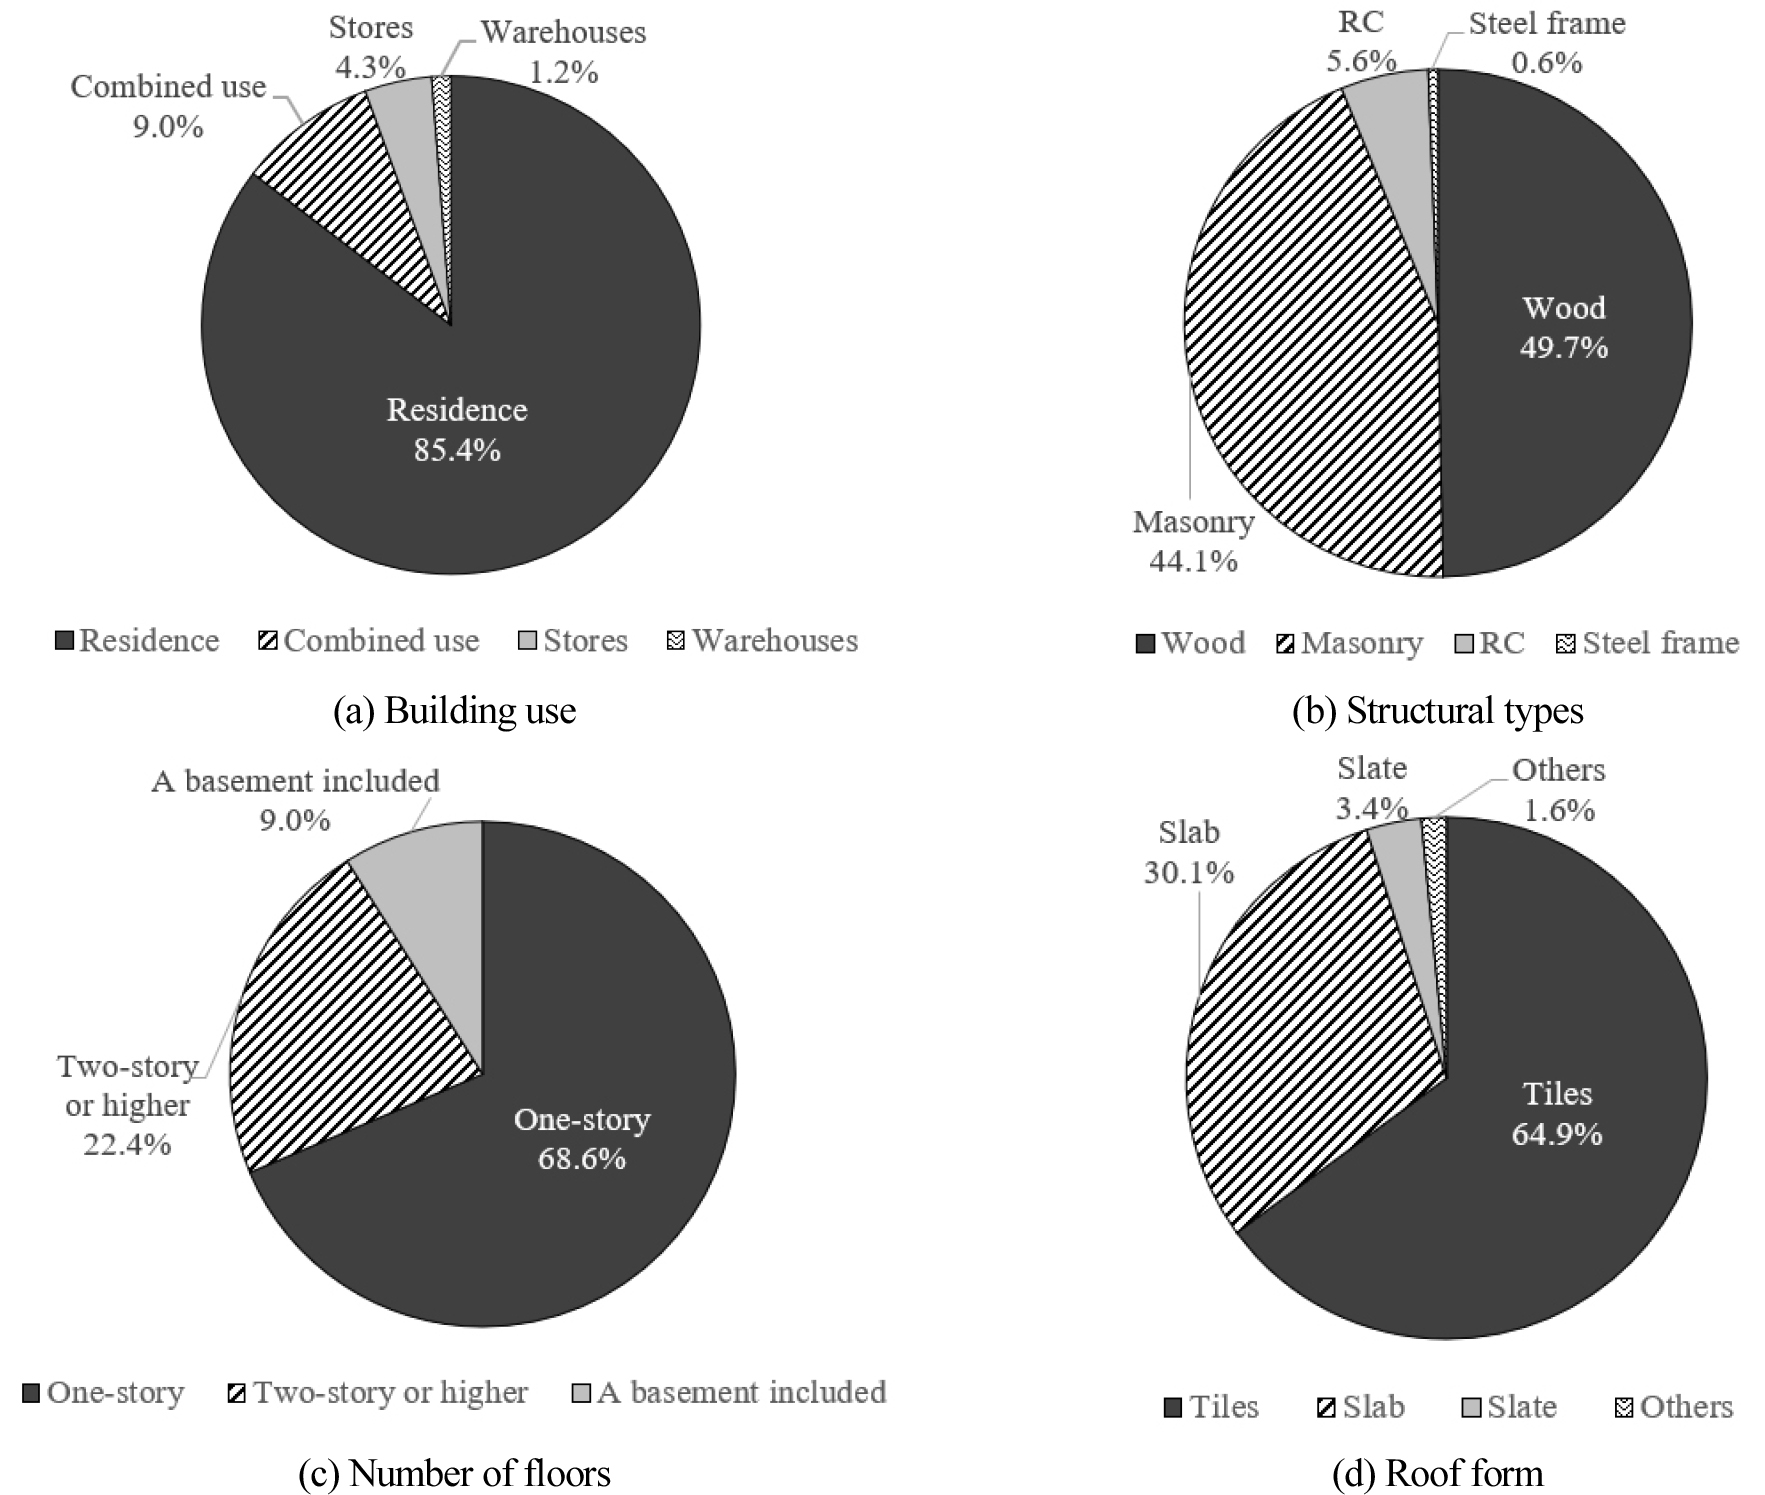
The target area considered for case analysis is 64,032 m2, and consists of 386 units of houses and commercial neighborhood facilities. Of these units, 322 were registered in building ledgers provided in the form of electronic documents by the Korean government, and the mean flood area of the registered units was 62.74 m2. With respect to building construction, approximately 85% of the registered units were houses, and approximately 50% were built of wood. These conditions raised concerns over the spread of fire in the event of its occurrence. Approximately 68% of buildings located in the target area were one-story buildings, and approximately 65% of buildings had roofs with tiles. Figure 2 shows the composition of buildings in the target area according to building ledgers.
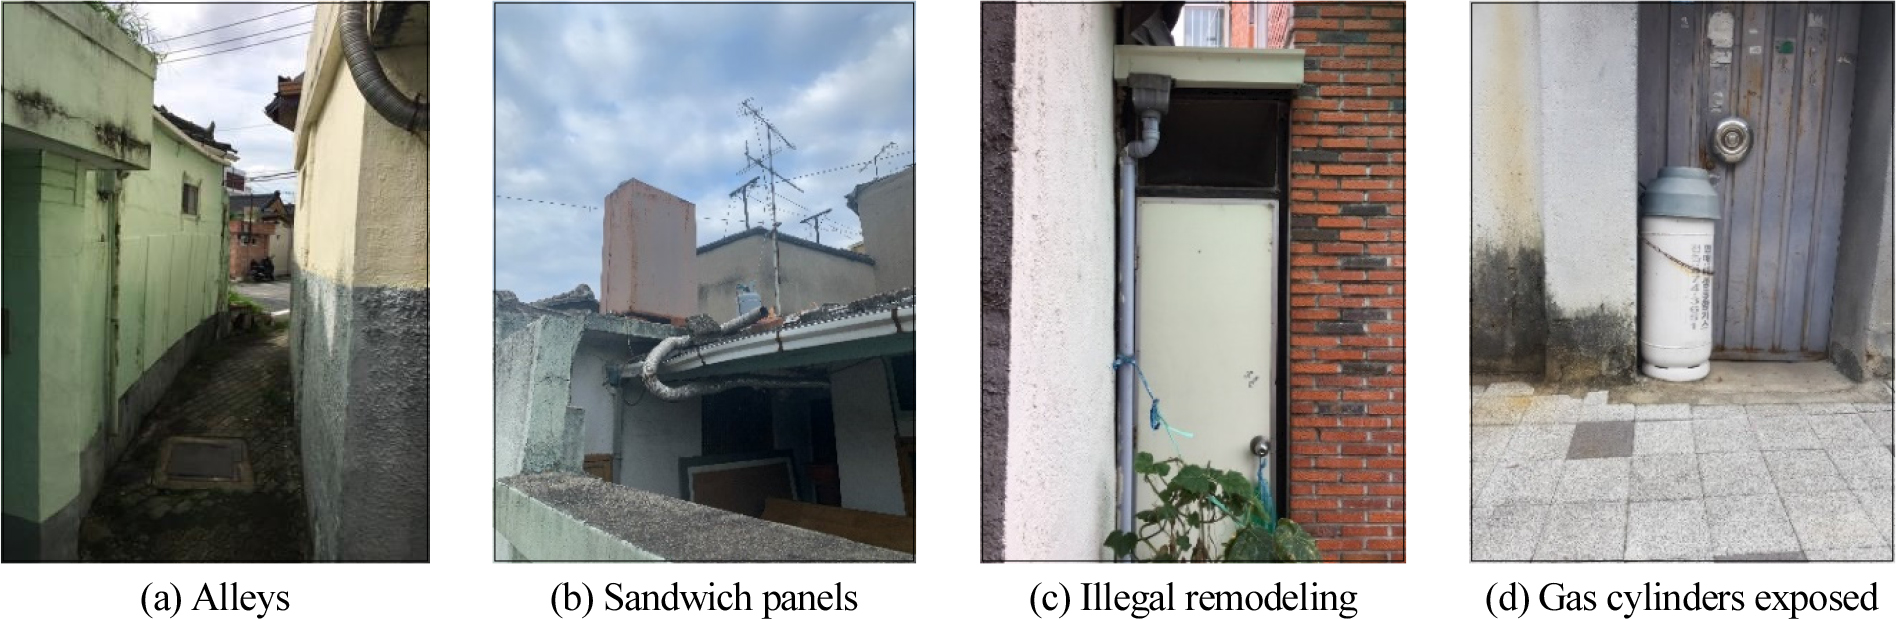
A field inspection was conducted in the target area. The inspection result showed that inner and outer roads in this area had widths up to 4 m and that 24 alleys had widths up to 2 m. Outdoor fire hydrants were not installed in the area of field inspection, and only five outdoor fire hydrants were installed for public use in the event of fire. Given these conditions, early fire suppression was expected to be challenging. It was also found that the exterior of four building units was made of sandwich panels vulnerable to the spread of fire and that there were storage units that had been illegally modified or installed and multiple roofs had been illegally enlarged. Electrical installments in buildings showed comparatively satisfactory performance; however, nine externally exposed gas cylinders increased probabilities of fire occurrence and spread of damage caused by the fire. Figure 3 shows fire risk elements that were detected by the field inspection in the target area.
Framework of fire risk evaluation
This study evaluated fire risks in an area of concentrated deteriorated buildings by applying the concept of a main fire risk evaluation system [23, 24]. Main evaluation categories that were applied in this study included construction information, risk elements, and firefighting facilities. Evaluation items that were applied in this study are as follows: year of construction, building structure, total floor area, illegal remodeling, illegal parking, types of exterior materials, electrical equipment, gas cylinders, outdoor fire extinguishers, outdoor fire hydrants, distance to the 119 safety center, and distance to an accident and emergency (A&E) department. The aforementioned categories and items were derived through a survey conducted based on 181 firefighting experts, including firefighters, professors and researchers at universities, and workers responsible for managing practical tasks in industrial sectors and fields related to fire insurance in a previous study [25]. Moreover, an analytic hierarchy process (AHP) based on 81 firefighting experts was implemented to derive the weights according to each evaluation item, which indicate the relative significance of each evaluation item [26].
Among the evaluation categories, the category of construction information is evaluated based on a construction information index, which is obtained by the multiplication of scores of each evaluation item and weights for each item according to the year of construction, structure, and total floor area of the target building. The category of firefighting facilities is evaluated based on a risk element index and a firefighting facility index, which are obtained by the multiplication of scores for each evaluation item, weights for each item, and weights for each category. Each category index that is evaluated can be calculated as a fire risk index (= the construction information index × the risk element index / the firefighting facility index), which integrates the evaluated category indexes as a single index. The value of the fire risk index can be applied as a fire risk grade. Table 2 presents the fire risk evaluation items for districts filled with deteriorated buildings and weights for each item applied in this study. Table 3 list the fire risk indexes and grades.
Table 2.
Table 2. Fire risk evaluation items and weights applied to districts filled with deteriorated buildings
| Evaluation Categories | No | Evaluation items | Description | Evaluation criterion | Score | W1 | W2 |
| Construction information | 1 | Year of completion | Year of completion to reflect the aging level of the building | 40 years ≤ Year of completion | 1.5 | 0.287 | - |
| 30 years ≤ Year of completion < 40 years | 1.4 | ||||||
| 20 years ≤ Year of completion < 30 years | 1.3 | ||||||
| 10 years ≤ Year of completion < 20 years | 1.2 | ||||||
| 5 years ≤ Year of completion < 10 years | 1.1 | ||||||
| Year of completion < 5 years | 1.0 | ||||||
| 2 | Building structure | Building structure such as reinforced concrete or masonry | Wooden and Other structures | 1.5 | 0.408 | ||
| Brick, Block, and Stone structures | 1.3 | ||||||
| Reinforced concrete, Precast Concrete, Steel, and Steel Reinforced Concrete Structures | 1.0 | ||||||
| 3 | Gross floor area of building | Gross floor area of building to reflect the building dimension | 660 m2 < Gross floor area | 1.5 | 0.305 | ||
| 330 m2 < Gross floor area ≤ 660 m2 | 1.3 | ||||||
| Gross floor area ≤ 330 m2 | 1.0 | ||||||
| Risk element | 4 | Illegal alterations | Status of alterations of the building, such as an illegal extension | Illegal alterations of the building | 5 | 0.304 | 0.581 |
| No illegal alterations of the building | 1 | ||||||
| 5 | Illegal parking | Status of day/night illegal parking interfering with fire truck entry | Frequent illegal parking within a 50-meter radius of the building | 5 | 0.129 | ||
| Occasionally illegal parking within a 50-meter radius of the building | 3 | ||||||
| No illegal parking within a 50-meter radius of the building | 1 | ||||||
| 6 | Type of building cladding | Flame-retardant performance of the main finishing material for exterior walls of the building |
Use of hazardous materials (sandwich panels) | 5 | 0.234 | ||
|
No use of hazardous materials (sandwich panels) | 1 | ||||||
| 7 | Electrical equipment | Status of changes in the risks of old poles and electrical equipment | Adjacent radius distance ≤ 10 m | 5 | 0.167 | ||
| 10 m < Adjacent radius distance ≤ 20 m | 3 | ||||||
| 20 m < Adjacent radius distance | 1 | ||||||
| 8 | LNG cylinder | Status of installation and use of LNG cylinders outside the building | Adjacent radius distance ≤ 20 m | 5 | 0.167 | ||
| 20 m < Adjacent radius distance ≤ 40 m | 3 | ||||||
| 40 m < Adjacent radius distance | 1 | ||||||
| Firefighting facility | 9 | Outdoor fire extinguisher | Whether equipped with an outdoor fire extinguisher within the effective radius | Adjacent radius distance ≤ 10 m | 5 | 0.234 | 0.419 |
| 10 m < Adjacent radius distance ≤ 20 m | 3 | ||||||
| 20 m < Adjacent radius distance | 1 | ||||||
| 10 | Outdoor fire hydrant | Whether equipped with an outdoor fire hydrant within the effective radius | Adjacent radius distance ≤ 20 m | 5 | 0.295 | ||
| 20 m < Adjacent radius distance ≤ 40 m | 3 | ||||||
| 40 m < Adjacent radius distance | 1 | ||||||
| 11 | Distance to 119 Safety Center | Distance between the building and 119 Safety Center | Shortest distance ≤ 1km | 5 | 0.280 | ||
| 1 km < Shortest distance ≤ 3km | 4 | ||||||
| 3 km < Shortest distance ≤ 5km | 3 | ||||||
| 5 km < Shortest distance ≤ 7km | 2 | ||||||
| 7 km < Shortest distance | 1 | ||||||
| 12 | Distance to A&E | Distance between the building and A&E in the vicinity | Shortest distance ≤ 1km | 5 | 0.191 | ||
| 1 km < Shortest distance ≤ 3km | 4 | ||||||
| 3 km < Shortest distance ≤ 5km | 3 | ||||||
| 5 km < Shortest distance ≤ 7km | 2 | ||||||
| 7 km < Shortest distance | 1 |
Table 3.
Fire risk indexes and grades
| Fire risk index | 0.2 ≦ FRI∠2 | 2 ≦ FRI∠3 | 3 ≦ FRI∠4 | 4 ≦ FRI∠5 | 5 ≦ FRI ≦ 7.5 |
| Fire risk grade | Excellent | Satisfactory | General | Cautious | Dangerous |
Spatial information-based platform of fire risk evaluation
This study utilized drones, orthophotos, and numerical maps, all of which were part of spatial information technology, to obtain data for fire risk evaluation. Building ledgers were also used to collect data related to the category of construction information. Fire risks in the target area were evaluated by applying the fire risk evaluation platform for districts with a large proportion of deteriorated buildings, which was developed based on the aforedescribed fire risk evaluation system for districts with a large proportion of deteriorated buildings and QGIS.
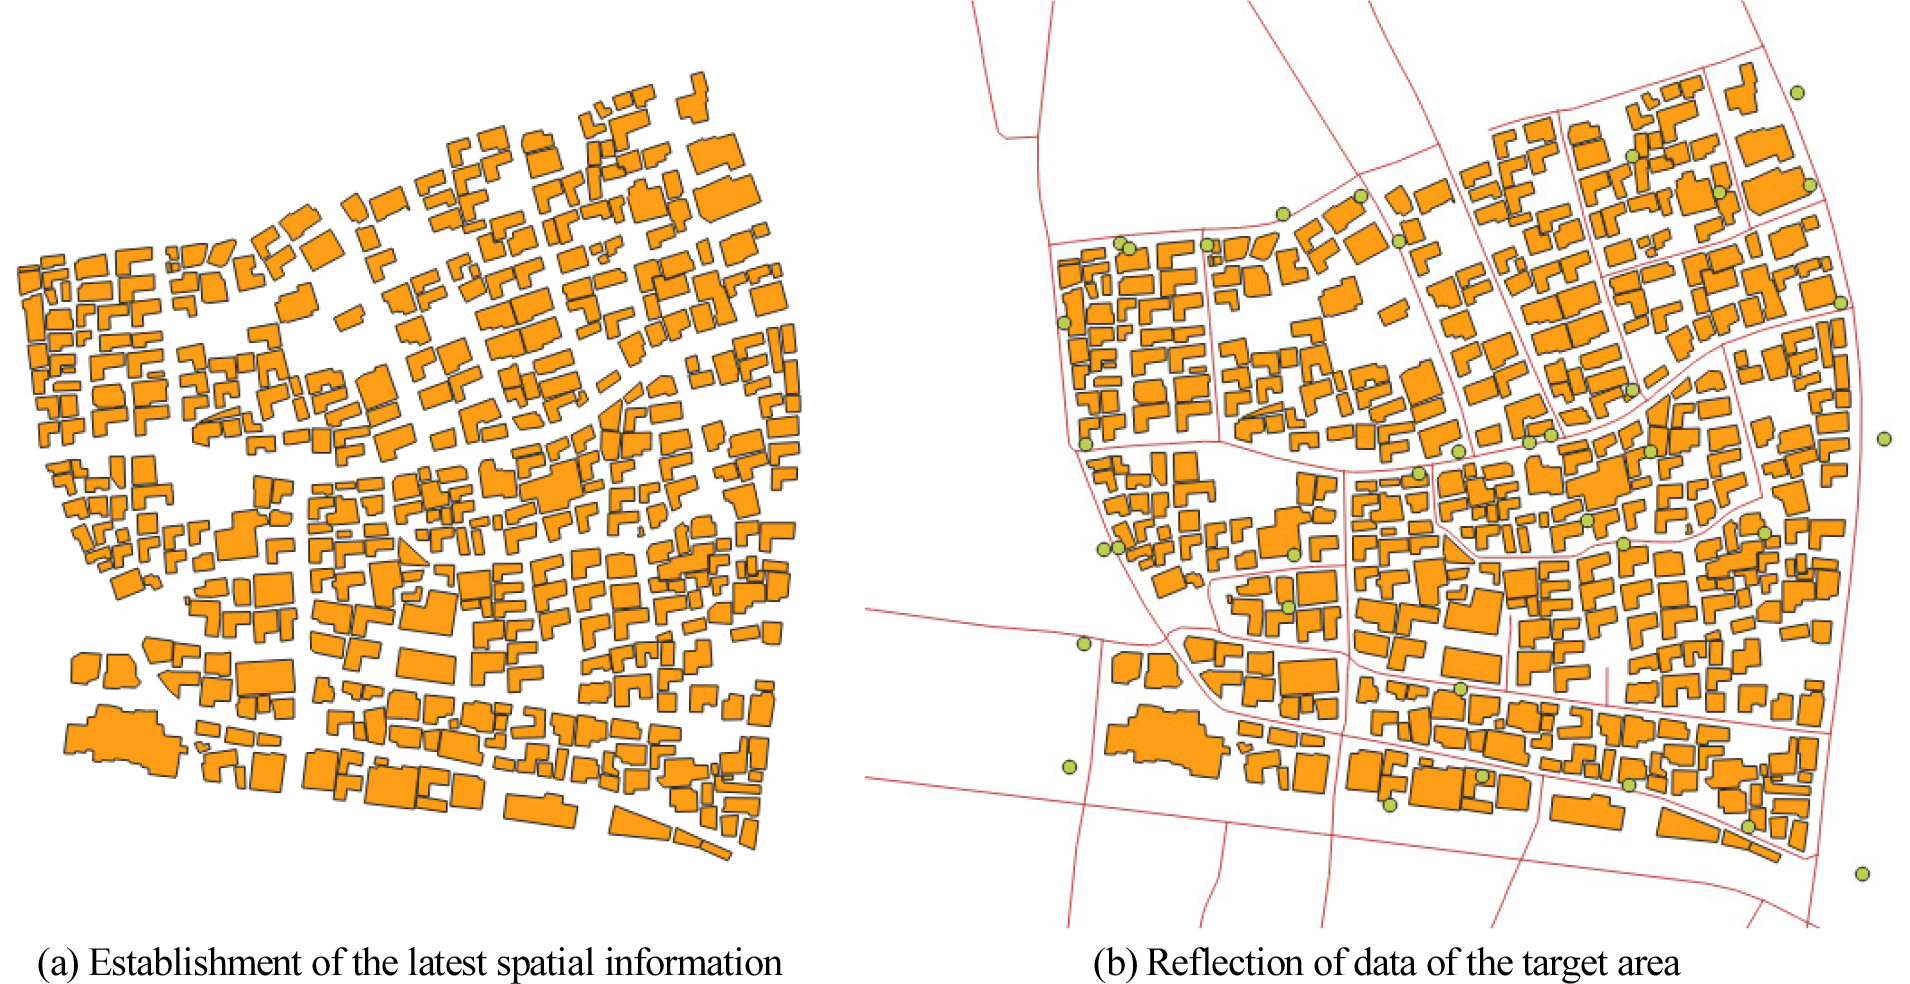
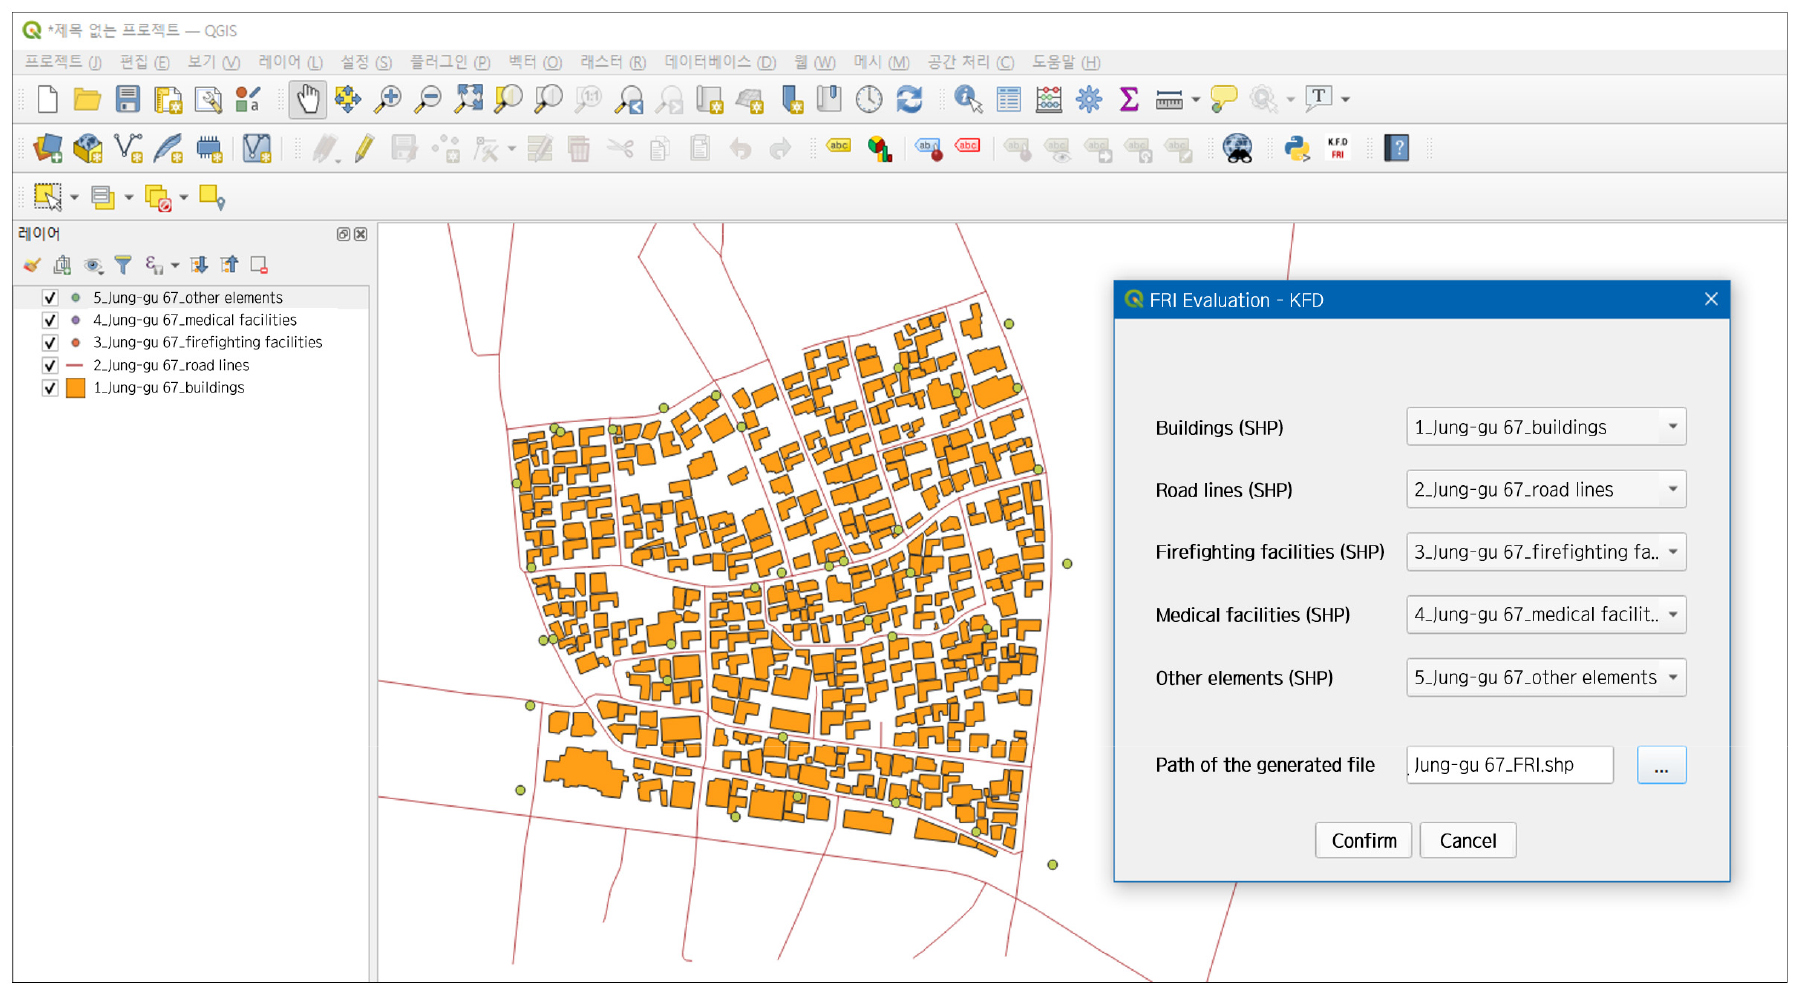
Specifically, this study collected photographs of the target area acquired by drones and numerical maps on this area, and established the latest spatial information by reflecting the most recent images acquired by drones and numerical maps. Figure 4(a) shows the latest spatial information that was established. Further, pre-processing of spatial information was performed to distinguish buildings from roads and reflected details (e.g. buildings, road lines, firefighting facilities, medical facilities, and other elements) of data of the target area that were obtained to evaluate fire risks based on spatial information. Figure 4(b) shows spatial information obtained through pre-processing, and Figure 5 shows the fire risk evaluation platform for districts with a high proportion of deteriorated buildings, which was utilized in this study.
Results
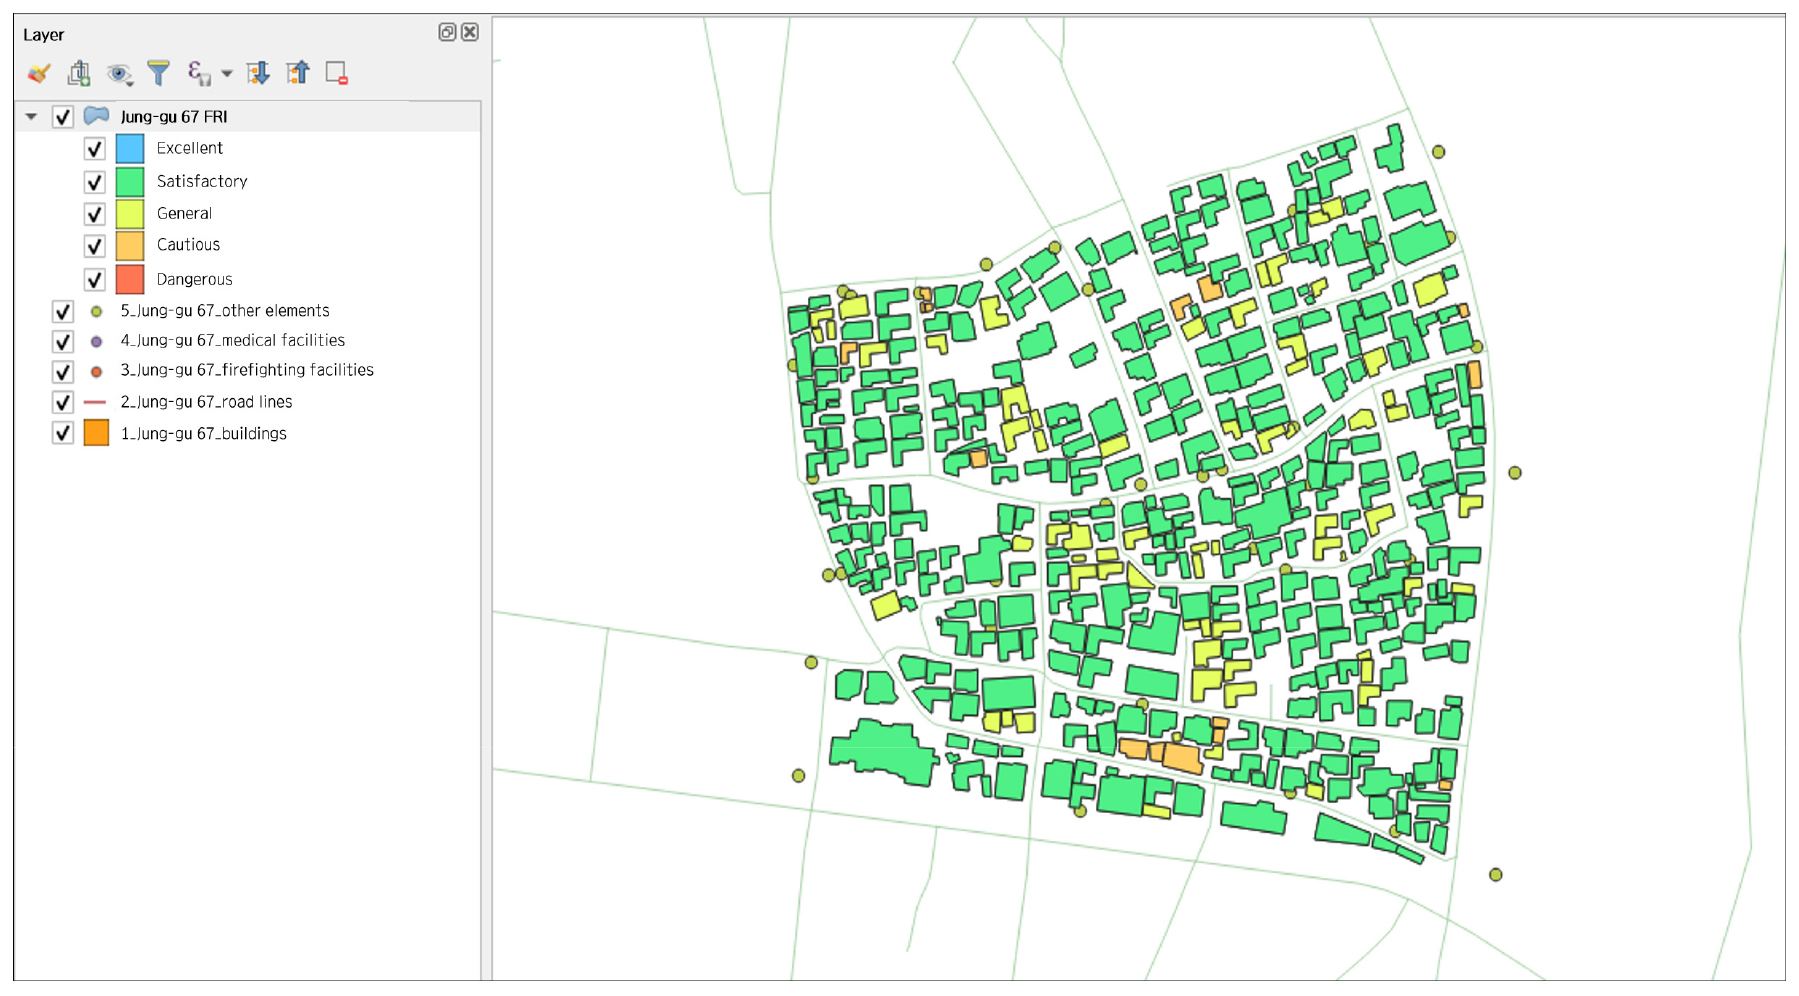
Figure 6 illustrates the result of evaluating fire risks in the target area. As indicated in this figure, the evaluation result is as follows: 305 units showed a satisfactory level of risk risks; 66 units showed a general level; and 15 units showed a cautious level. This evaluation result indicates that the target area exhibits a satisfactory level of fire risks.
Moreover, the evaluation results of fire risk indexes were examined according to the evaluation items. In terms of the category of construction information, the year of construction and building structure had significant effects on this category. All 15 building units that showed a cautious level of fire risks had been in use for over 40 years. In addition, these buildings were built of wood, which is prone to fire. With respect to risk elements, illegal modeling and types of exterior materials had significant effects on this category. It was found that 11 units of the 47 building units that were illegally remodeled or enlarged showed a cautious level of fire risks, and that four building units that used sandwich panels as exterior materials showed a cautious level of fire risks. With respect to firefighting facilities, the presence of outdoor fire extinguishers and the distance to the 119 safety center exhibited significant effects on this category. Although outdoor fire hydrants did not exist in the target area, most buildings were located within a 40-m radius of outdoor fire extinguishers. A total of 89 building units showed the shortest distance of 1 km or less from the 119 safety center, and the remaining buildings had the shortest distance of 5 km or less from the center.
The analysis results indicate that spatial information technology can be effectively applied to evaluate fire risks based on the unit of a building or a district. In addition, it was verified that the application of this technology also led to the effective calculation of scores for each evaluation item.
Discussion
This study analyzed the applicability of fire risk evaluation technology based on spatial information as a core technology for smart cities. To this end, it conducted fire risk evaluations based on spatial information in an area designated as a target zone for a housing environment improvement project in Daegu, South Korea. This study has significance because of the following reasons. First, it reflected the perspective that the safety of both newly and previously developed cities should be considered for the analysis of smart cities. Second, it utilized spatial information to evaluate fire risks of both a rapidly increasing number of deteriorated buildings and the target area on which these buildings were concentrated. It is expected that the findings of this study will be used to conduct further research on the application of the proposed fire risk evaluation technology as a core technology for smart cities to achieve a more efficient fire risk management in districts with a large proportion of deteriorated buildings by the application of a wider variety of case analyses and a more specific evaluation standard and grading system.
Furthermore, the analysis showed that the fire risk evaluation platform applied in this study can be combined with wireless sensor network technology, which is a core technology for implementation of smart cities, to perform fire risk evaluation based on various types of detection data linked in real time as well as disaster safety evaluation and analysis from various aspects. Specifically, the combination of the fire risk evaluation platform with wireless sensor network technology will provide the foundation for fire prediction technology that enables users to predict fire spread patterns by analyzing the state of installation of flame and smoke detectors and real-time detection data. The fire risk evaluation platform can also be integrated with augmented reality (AR), virtual reality (VR), and mixed reality (MR) technologies to ensure applicability in a wider variety of fields, such as disaster prevention, prediction, analysis, and education.
Conclusions
This study analyzed the applicability of fire risk evaluation technology based on spatial information as a core technology for smart cities. To this end, it conducted fire risk evaluations based on spatial information in an area designated as a target zone for a housing environment improvement project in Daegu, South Korea. The main conclusions are outlined as follows.
The levels of fire risk of 386 deteriorated building units located in the target area considered for case analysis were evaluated in this study. A total of 305 units showed a satisfactory level of risk risks, 66 units showed a general level, and 15 units showed a cautious level. Thus, it was determined that the target area showed a satisfactory level of fire risks.
It was determined that the category of construction information was significantly affected by the year of construction and building structure. All 15 building units that showed a cautious level of fire risks were made of wood and had been in use for over 40 years. With respect to risk elements, illegal modeling and types of exterior materials had significant effects on this category.
It was found that 11 units of the 47 building units that had been illegally remodeled or enlarged showed a cautious level of fire risks, and that four building units that used sandwich panels as exterior materials showed a cautious level of fire risks. With respect to firefighting facilities, the presence of outdoor fire extinguishers and the distance to the 119 safety center exhibited significant effects on this category. Most buildings were located within a 40-m radius of outdoor fire extinguishers, and the shortest distance between the entire buildings and 119 safety centers was 5 km or less.
The analysis results indicated that spatial information technology can be effectively applied to evaluate fire risk based on the unit of a building or a district. In addition, it was verified that the application of this technology also led to the effective calculation of scores for each evaluation item. Further research will be carried out to increase the extent of application of the proposed fire risk evaluation technology as a core technology for smart cities by analyzing a wider variety of cases and applying a more specific evaluation standard and grading system.
