

Background
Overview of Building Information Modeling
Introduction to BIM and its Key Features
Evolution and Adoption of BIM
Benefits of BIM
Barriers to BIM Adoption
Research Method
Results
Personal Characteristics
The Ranking and Importance of Factors
Cause-and-Effect Matrix
Multiple Linear Regression
Discussion
Conclusions and Limitations
Background
In recent years, the construction industry has experienced a paradigm shift with the widespread adoption of Building Information Modeling (BIM) [1]. This transformative approach has profoundly influenced how projects are conceptualized, designed, and executed [2]. It moves beyond the limitations of traditional drafting, offering a comprehensive model-based platform that serves as a centralized hub for the entire lifecycle of a construction project [3]. BIM is a methodology that enables the integration of various data, both geometric and non-geometric, to assess the current condition of an asset [4]. This comprehensive virtual representation of a building or infrastructure project provides construction managers with unprecedented insights, allowing them to make informed decisions, optimize processes, and enhance collaboration among all stakeholders [5].
The integration of BIM into construction management has been a transformative development as it facilitates the continuous exchange and management of information throughout the project’s lifecycle, from the initial design stages to the final construction and operation phases [3]. BIM maintains a clear overview of the project’s progress, identifies potential issues early on, and leverages data-driven insights to make more efficient decisions. In addition, BIM yields numerous benefits, including improved communication and coordination among project stakeholders, enhanced integration of construction drawings, accelerated project delivery, reduced costs, and improved job site safety [6]. However, the adoption of BIM also faces a lot of barriers, such as resistance to change, lack of standardization, and perceived high costs [7].
BIM has gained considerable traction in Vietnam’s construction industry as it is increasingly recognized for its potential to enhance project efficiency, collaboration, and overall quality [8]. However, adopting BIM also comes with significant challenges. Nguyen et al. [9] identified six key factors that enable BIM adoption in Vietnam: technical feasibility, human resources and management, company business vision, political environment, economic viability, and legal aspects. Additionally, Nguyen [10] emphasized the importance of legal considerations, including the clarity and feasibility of a BIM adoption roadmap, the strategy for building the industry’s BIM capacity, the system of laws and regulations governing BIM-enabled projects, the need for new standards and codes for BIM-related processes, and an incentive system for early adopters of BIM. As a result, the adoption of BIM in Vietnam has been relatively slow compared to other countries, with the technology still in its infancy, particularly in the operation and maintenance phase of buildings [8].
Although numerous studies have assessed the adoption of BIM, significant gaps remain in understanding the causal relationship between its barriers and benefits. While it is clear that reducing barriers leads to increased benefits and vice versa, the depth of this relationship and the models used to evaluate it have not been fully explored. Therefore, there is a pressing need for a clear framework to assess how specific barriers and benefits of BIM in construction are interconnected. This paper aims to examine the causal relationship between these factors, offering valuable insights to help construction industry professionals overcome the challenges of BIM adoption.
While BIM is an excellent tool for managing construction projects, this study specifically focuses on its application in prefabricated construction projects due to their unique characteristics. A key distinction of these projects is that the manufacturing of components often occurs simultaneously with the construction phase, requiring a high level of detail and accuracy in both design and execution. In this context, BIM proves particularly beneficial because of its ability to comprehensively integrate design information from the outset, enhancing precision and coordination throughout the project lifecycle [11].
Overview of Building Information Modeling
Introduction to BIM and its Key Features
Building Information Modeling (BIM) has emerged as a transformative process in the architecture, engineering, and construction (AEC) industry. Over the past two decades, the shift from traditional 2D drawing methods to BIM’s 3D digital representations has reshaped project management, design, and construction processes. According to Eastman et al. [12], BIM enhances collaboration and coordination among various project stakeholders by enabling the creation, exchange, and management of digital models throughout a building’s lifecycle.
BIM has gained traction as a pivotal technology in the construction industry, reshaping the fundamental approaches to project design, construction, and management [13]. The development of BIM can be viewed from several perspectives, including design, estimation, construction processes, building life cycle, performance, and technology [14]. BIM encourages the integration of roles among all stakeholders on a project, enabling improved collaboration, communication, and management of project documentation [15]. The literature highlights the broad applicability of BIM throughout the entire construction project life cycle, from the pre-construction planning and design stages to the post-construction operations and maintenance phases [6]. Specifically, recent research has delved into the potential of BIM to support and enhance building refurbishment and maintenance practices [16].
Succar [17] highlighted BIM’s core features, including its multi-dimensional nature (3D for visualization, 4D for time, 5D for cost, and 6D for sustainability), the integration of multidisciplinary data, and its capability for lifecycle management. BIM enables users to simulate real-world performance before construction, aiding in decision-making and risk mitigation [15]. Azhar [15] also emphasizes BIM’s role in reducing waste through accurate estimation and material planning, thus supporting sustainable construction practices. This finding aligns with the work of Hardin and McCool [18], who found that using BIM can reduce costs by up to 20% in the construction phase and improve operational efficiency in the post- construction phase.
Evolution and Adoption of BIM
Eastman et al. [12] describe BIM as a fundamental paradigm shift from traditional methods to a model- based approach. The concept of BIM as an intelligent, data-rich model that encompasses the physical and functional characteristics of a building was revolutionary for its time. The global adoption of BIM has varied, with Western countries like the UK, the US, and parts of Europe leading the way. Mandates like the UK’s BIM Level 2 requirement for government projects have spurred widespread adoption [19]. In contrast, developing countries face slower adoption due to challenges such as a lack of skilled personnel, financial barriers, and weak regulatory frameworks [20].
The integration of BIM into construction management has been a topic of increasing interest among both researchers and practitioners, as it offers numerous benefits in terms of efficiency, collaboration, and project delivery [13]. By creating a comprehensive digital model of a building or infrastructure project, BIM enables construction teams to visualize and coordinate the various components of a project with unprecedented clarity [2]. This visual representation and enhanced coordination, in turn, empower stakeholders to make more informed decisions, minimize errors, and streamline the overall construction process [21].
The application of BIM extends beyond the design and construction phases, as it can also be leveraged for building refurbishment, maintenance, and operations, providing a centralized repository of data that facilitates better decision-making throughout the entire building lifecycle [22]. Indeed, Ahn et al. [2] concluded that BIM has explored a wide range of applications, from the pre-construction stage, where BIM can enhance planning and design, to the construction phase, where it improves coordination and productivity, as well as the post-construction phase, where BIM facilitates facility management and sustainability efforts.
Benefits of BIM
Numerous studies highlight the benefits of BIM in various project phases. For instance, Gu and London [23] argue that BIM significantly improves project collaboration by acting as a single source of truth, reducing information silos that often lead to errors. They noted that projects using BIM report better communication, fewer change orders, and improved coordination between stakeholders. From a financial perspective, Bryde et al. [24] conducted a meta- analysis and found that BIM reduces project costs by 10-15% by minimizing rework, improving material ordering, and optimizing construction schedules. Similarly, Jung and Joo [25] assert that the accurate visualization of project designs helps reduce miscommunication and design conflicts, leading to more efficient project delivery. BIM’s capacity for lifecycle cost analysis and operational management ensures that sustainability considerations are integrated from the design stage to post-construction operations, as noted by Teo et al. [26].
BIM has offered a range of benefits that have the potential to revolutionize construction management practices [3]. By creating a highly detailed, multi- dimensional digital model of a building or infrastructure project, BIM enables construction professionals to visualize, simulate, and analyze the project in a virtual environment before any physical work begins [15]. By providing a centralized, collaborative platform for all project stakeholders, BIM facilitates the integration of design, engineering, and construction expertise, allowing for the identification and resolution of potential issues early in the process [3]. One of the primary ways in which BIM can enhance the efficiency and coordination of construction projects is by improving the flow of information and collaboration among project stakeholders [27].
In addition, BIM provides enhanced visualization and productivity, better coordination of construction drawings and documents, faster delivery, and reduced costs [2]. Specifically, the model-based approach of BIM allows construction managers to gain greater insight into the various components and relationships within a project, enabling them to better integrate and manage these elements throughout the construction process [3]. Furthermore, BIM’s ability to embed virtual information directly into the building model can improve the overall quality and accuracy of construction documents, reducing the risk of errors and rework [24]. This early identification and resolution of design conflicts through BIM can help construction managers avoid costly changes and delays during the construction phase as they can address issues before they manifest on the physical site [27]. In addition to these tangible benefits, the adoption of BIM can also support the sustainability of construction projects. BIM’s integration of expertise from design and project participants can promote resource management and worker safety, resulting in reduced waste and environmental impact [28]. As the construction industry continues to face increasing pressure to deliver more efficient, cost-effective, and environmentally responsible projects, the advantages BIM offers will become increasingly crucial to the success of construction management practices [3].
Barriers to BIM Adoption
Despite its advantages, several barriers to BIM adoption remain. Khosrowshahi and Arayici [1] identify the high initial costs of software, training, and infrastructure upgrades as major obstacles for small and medium-sized enterprises (SMEs). They also note that resistance to change, a common organizational challenge, impedes the full utilization of BIM. Eadie et al. [29] revealed issues related to interoperability between different BIM software platforms, which can result in data loss or miscommunication. This finding is supported by Volk et al. [30], who argued that while BIM offers significant advantages, technical and legal issues surrounding data ownership, intellectual property, and data security must be resolved.
BIM has been touted as an innovative technology for the construction industry [23]. However, the industry has been slow to adopt this approach, facing numerous barriers that impede its widespread implementation [21]. The construction industry, known for its traditional practices and reluctance to embrace new technologies, has shown significant resistance to the adoption of BIM [2]. One of the primary barriers to BIM implementation is the perceived cost associated with the transition, as construction companies often find it challenging to justify the investment required to reorganize their organizational structures and adapt to the new processes and workflows introduced by BIM [21, 31].
Another significant obstacle is the lack of clear understanding and communication of the tangible business value that BIM can offer [32]. The construction sector, particularly small and medium-sized enterprises (SMEs), has recorded unsatisfactory productivity levels, largely due to the reliance on a large proportion of low-skilled foreign labor [31]. Therefore, construction companies need to evolve from using traditional approaches, which are unsustainable in terms of waste generation and resource depletion, to advanced methods like BIM [33]. Moreover, the construction industry is plagued by fragmentation, as various stakeholders, such as designers, contractors, and subcontractors, often work in silos, hindering the unified flow of information and collaboration required for effective BIM implementation [21, 31].
Research Method
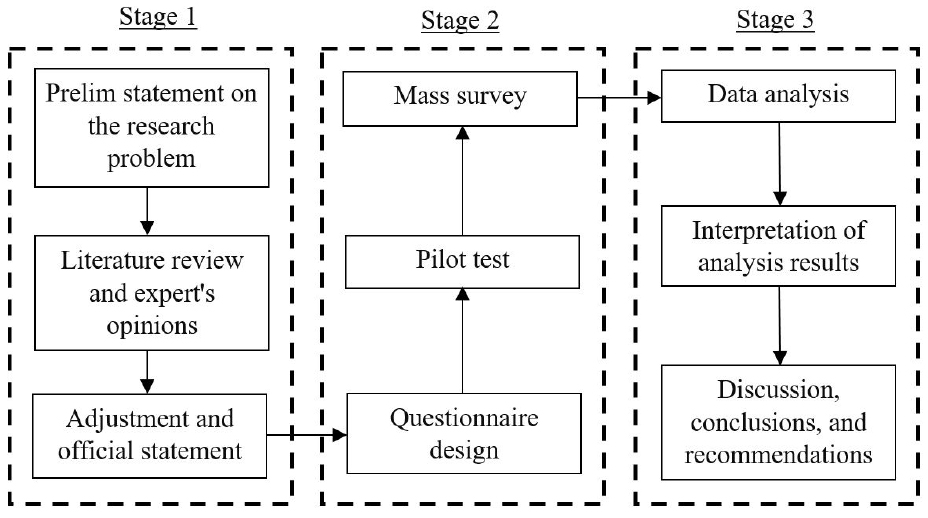
The research process, outlined in Figure 1, consists of three phases, each containing three sub-tasks. Phase 1 focuses on identifying the research problem, Phase 2 involves data collection, and Phase 3 centers on analyzing the research results.
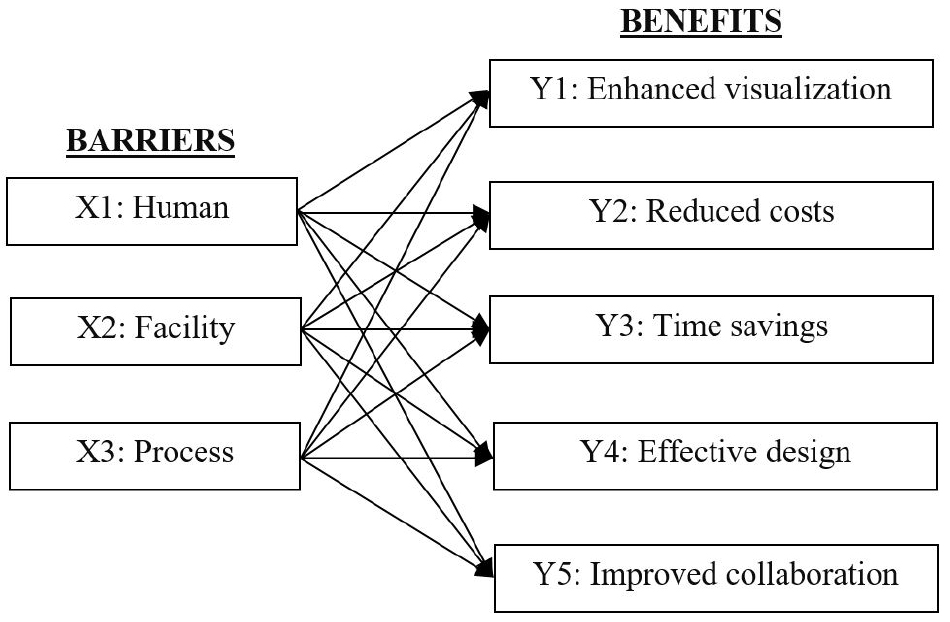
Based on the research overview, this study identified 29 benefits and 19 barriers to BIM use. Since then, interviews have been conducted with three experts to re-evaluate these benefits and barriers about (1) current practices of prefabricated construction projects and (2) the timing of using BIM within the pre-construction phase. These experts, each with ten years of experience in BIM and holding key positions in large companies, made additions, adjustments, and combinations to some of the benefits and barriers. The results of this step revealed 19 significant benefits and 11 barriers, as shown in Table 1. For benefits, they are classified into five groups: enhanced visualization, reduced costs, time savings, effective design, and improved collaboration. The barriers are divided into human, facility, and process. Based on these benefits and barriers, this study proposes a model representing their relationship, as depicted in Figure 2.
Table 1.
19 benefits and 11 barriers of BIM adoption in prefabricated construction projects
| Code | Content | Representative source | Code | Content | Representative source |
| Benefits | Y41 | Offering more extensive displays of relevant project information | Khosrowshahi and Arayici [1] | ||
| Y1 | Enhanced visualization | Y42 | Easily incorporating design changes | Eastman et al. [12] | |
| Y11 | Presenting visual representations of one or more design options | Eastman et al. [12] | Y5 | Improved collaboration | |
| Y12 | Providing detailed instructions for correctly processing components in the factory | Eastman et al. [12] | Y51 | Enhancing collaboration between designers during the design phase | Eastman et al. [12] |
| Y13 | Developing advanced construction methods that offer competitive advantages | Experts’ opinion | Y52 | Strengthening coordination between contractors and other stakeholders during the prefabrication phase | Ahn et al. [2] |
| Y14 | Offering safe and efficient production solutions | Zhang et al. [48] | Benefits | ||
| Y2 | Reduced costs | X1 | Human-related | ||
| Y21 | Effectively controlling the quantity of completed work to minimize additional expenses | Azhar [15] | X11 | Lack of high-quality human resources with formal training | Nguyen et al. [9] |
| Y22 | Quickly extracting work quantities for more accurate project estimates | Farnsworth et al. [45] | X12 | Lack of data sharing between units involved in the project | Wong and Gray [47] |
| Y23 | Proposing construction methods that are both visually appealing and technically sound, leading to cost reductions | Ahn et al. [2] | X13 | Limited experience in managing information models, leading to inaccurate outcomes | Boktor et al. [39] |
| Y24 | Accurately determining the final project cost, laying a solid foundation for unit cost discounts before construction | Experts’ opinion | X14 | Resistance to change in work processes among professionals | Ahn et al. [2] |
| Y25 | Optimizing design to reduce project costs and timelines | Azhar [15] | X2 | Facility-related | |
| Y26 | Reducing waste or reusing excess materials to lower expenses | Cheng and Ma [43] | X21 | High investment costs for equipment, infrastructure, and software licenses | Ahn et al. [2] |
| Y3 | Time savings | X22 | Ineffective integration between different software tools | Ahn et al. [2] | |
| Y31 | Optimizing the construction site layout to reduce transport times | Experts’ opinion | X23 | Limited features in certain tools, reducing technical and volume accuracy | Choi [44] |
| Y32 | Timely adjusting designs based on contractor feedback to speed up the design process | Experts’ opinion | X3 | Process-related | |
| Y33 | Detecting design conflicts early to minimize design time | Khosrowshahi and Arayici [1] | X31 | Extended time is required to generate large amounts of detailed information in the model | Samuelson & Stehn (2023) [49] |
| Y34 | Providing detailed plans for material procurement, resulting in shorter delivery times | Eastman et al. [12] | X32 | Absence of a comprehensive legal framework, standards, regulations, and documentation | Alsofiani [21] |
| Y35 | Developing comprehensive mobilization plans for construction equipment and tools, reducing delivery times | Experts’ opinion | X33 | The inability to account for unforeseen factors | Experts’ opinion |
| Y4 | Effective design | X34 | Challenges related to information security | Mitchell and Lambert [46] | |
Data were collected via a questionnaire comprising five parts: (1) an introduction explaining the survey’s purpose, (2) assessment of benefits, (3) assessment of barriers, (4) evaluation of the application process, and (5) collection of personal information. The data from part 4 were used in a separate research project. A 5- point Likert scale was employed, where 1 represented ‘very low’ and 5 indicated ‘very high’. The questionnaire was distributed to stakeholders using a convenience sampling method. Respondents included investors, consultants, contractors, and suppliers who have implemented BIM in their construction projects.
The analysis tools used in this study include descriptive statistics, such as frequency, mean, and standard deviation. Multiple linear regression (MLR) analysis is applied to develop an evaluation model with benefits as the dependent variable and barriers as the independent variable. The general model is structured as follows:
Where, is the dependent variable, is the independent variable, 𝛼 is a constant, and 𝛽 is the coefficient for the independent variable.
The model’s accuracy is evaluated using percentage error (PE), as shown in Eq. (2), mean percentage error (MPE), as shown in Eq. (3), and mean absolute percentage error (MAPE), as shown in Eq. (4).
Results
Personal Characteristics
After approximately two months of data collection, a total of 155 responses were received from stakeholders. Four responses were excluded due to missing information, leaving 151 valid responses for analysis. The results, presented in Table 2, reveal the following characteristics: 96 out of 151 respondents (63.6%) are engineers, 106 (70.2%) are employees, 68 (45%) are contractors, and 86 (57%) have less than three years of experience working with BIM. The survey sample is relatively appropriate because the research problem involves all stakeholders, and BIM has only been used in Vietnam for the past decade. Therefore, it can be concluded that the data provided by the respondents is reliable.
Table 2.
Respondent’s personal information
The Ranking and Importance of Factors
This study ranked and evaluated the factors that both benefits and barriers to BIM based on their mean values, as shown in Tables 3 and 4. Using a 2-dimensional 5-point Likert scale, ratings below the mean (1 and 2) and above the mean (4 and 5) were grouped for classification purposes. The classification scale was defined as follows: 1.0–1.8 = ‘very low’, 1.8–2.6 = ‘low’, 2.6–3.4 = ‘medium’, 3.4–4.2 = ‘high’, and 4.2–5.0 = ‘very high’.
The results in Table 3 indicate that 10 out of 11 barriers had a high impact, with mean values above 3.2, while 1 out of 11 were rated as medium, with mean values below 3.2. Table 4 shows that all 19 benefits were rated high when using BIM during the pre-construction phase.
Table 3.
Linguistic assessment and rank of barriers to BIM adoption
Table 4.
Linguistic assessment and rank of benefits of BIM adoption
Additionally, the assessment values for each benefit factor in Table 4 were used to determine the coefficient for each benefit group. This coefficient is essential for determining the causal matrix in later analysis. The process has three steps as follows:
•First, determining the sum value of assessment for a factor:
Where, is the sum value for a factor, is the number of responses for each scale value, is the values on the scale, indicates the order of values on the scale, and indicates the number of factors in a group.
•Second, computing the mean for each group:
Where, is the mean value for a factor group, is the number of factors in that group, and indicates the number of groups.
•Third, identifying the importance coefficient for each group:
For example, for factor Y1, the count numbers for values 1, 2, 3, 4, and 5 from the collected data are respectively 4, 5, 35, 69, and 38; thus, the sum value is as follows:
Similarly, = 574, = 564, = 540
Thus, the mean value of group Y1 is below:
Similarly, = 546, = 563, = 579, and = 582.
Similarly, the coefficients of groups Y2, Y3, Y4 and Y5 are as follows:
The results of the calculation are also presented in Table 4.
Cause-and-Effect Matrix
This study posed the question: ‘How do barriers impact the benefits of BIM?’ to construct the cause- and-effect matrix. The same 5-point Likert scale as previously used was applied. The survey results are summarized in Table 5.
Table 5.
Cause-and-effect matrix
The matrix construction process involves five steps:
•Count the number of responses (N) for each barrier group relative to the benefit groups, according to the scale values:
For example, the benefit group Y1, “Enhanced visualization,” received 3, 11, 40, 70, and 27 responses indicating that the barrier group X1, “Human-related” has a corresponding impact at levels of ‘very low’, ‘low’, ‘medium’, ‘high’ and ‘very high’.
•Calculate the assessment value () for each benefit group based on the corresponding barrier group using the following formula:
Where, represents the assessment value of the barrier group (i = 1, 2, 3, 4, 5) for each benefit group , and is the number of responses at each scale level.
For example, for group X1, the assessment values are:
•Calculate the sum of the assessment values () for barrier groups according to each scale value:
Where, is the number of benefit groups (n = 5)
For example, for group X1, the values of are defined as follows:
Similarly, , , , and
•Compute the sum of the assessment values () of a barrier group:
Where, is the number of barrier groups (k = 3)
For example, for group X1, the value of is:
Similarly, and
•Calculate the importance level (IL) of each barrier group for all the benefits:
For example, for group X1, the importance level is:
Similarly, the value for groups X2 and X3 is:
Multiple Linear Regression
Multiple linear regression (MLR) was used to establish the relationship between the barrier variable (dependent) and the benefit variable (independent), as illustrated in Figure 2. The key assumptions for regression analysis, including equal variance, independence, linearity, and multicollinearity, were all tested [34]. The analysis results are summarized in Tables 6, 7, and 8.
All the assumptions for regression analysis were met. Specifically, the ANOVA test results show a significance value of less than 0.05 (see Table 6), indicating that the means of the surveyed groups have the same variances [35]. The Durbin-Watson test produced a value close to 2, confirming that the residuals are independent and not autocorrelated (see Table 7) [36]. The linear correlation analysis shows correlation coefficients (R) greater than 0.8, demonstrating a strong linear relationship between the variables (see Table 7) [37]. Lastly, the multicollinearity test results show VIF (Variance Inflation Factor) values below 10, indicating that multicollinearity is not present (see Table 8) [36].
Table 6.
ANOVA results
Table 7 presents the R-square values for the models: Model 1 for Y1 is 69.7%, Model 2 for Y2 is 69.2%, Model 3 for Y3 is 77.4%, Model 4 for Y4 is 77.3%, and Model 5 for Y5 is 85.7%. In regression analysis with multiple independent variables, an R-square value of 70% is considered acceptable [38]. This value indicates that the proposed models effectively reflect the causal relationship between the variables.
Table 7.
Model summary
| Model | R | R Square | Adjusted R Square | Std. Error of the Estimate | Change Statistics |
Durbin- Watson | ||||||||
| R Square Change | F Change | df1 | df2 | Sig. F Change | ||||||||||
| Dependent Variable: (Y1) – Enhanced visualization | ||||||||||||||
| 1 | 0.835a | 0.697 | 0.690 | 0.392 | 0.697 | 112.46 | 3 | 147 | 0.000 | 2.291 | ||||
| Dependent Variable: (Y2) – Reduced costs | ||||||||||||||
| 2 | 0.832a | 0.692 | 0.686 | 0.398 | 0.692 | 110.03 | 3 | 147 | 0.000 | 2.191 | ||||
| Dependent Variable: (Y3) – Time savings | ||||||||||||||
| 3 | 0.880a | 0.774 | 0.770 | 0.339 | 0.774 | 168.10 | 3 | 147 | 0.000 | 2.361 | ||||
| Dependent Variable: (Y4) – Effective design | ||||||||||||||
| 4 | 0.879a | 0.773 | 0.768 | 0.360 | 0.773 | 166.83 | 3 | 147 | 0.000 | 2.016 | ||||
| Dependent Variable: (Y5) – Improved collaboration | ||||||||||||||
| 5 | 0.926a | 0.857 | 0.854 | 0.284 | 0.857 | 293.43 | 3 | 147 | 0.000 | 1.978 | ||||
Table 8 provides the coefficients of the regression equations, along with test values such as standard errors, t-test values, significance levels, and multicollinearity checks. The regression equations for each benefit and barrier, as outlined in Eq. (1), are rewritten as follows:
Table 8.
Coefficients
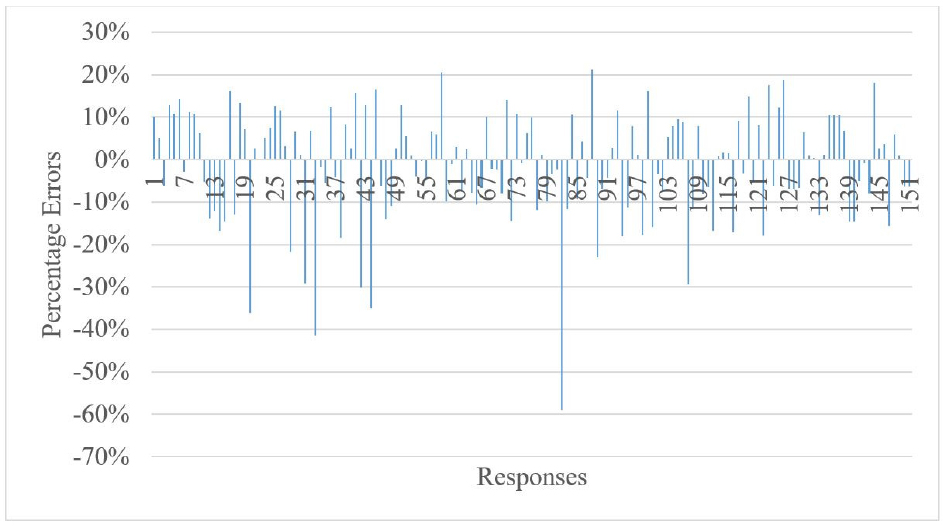
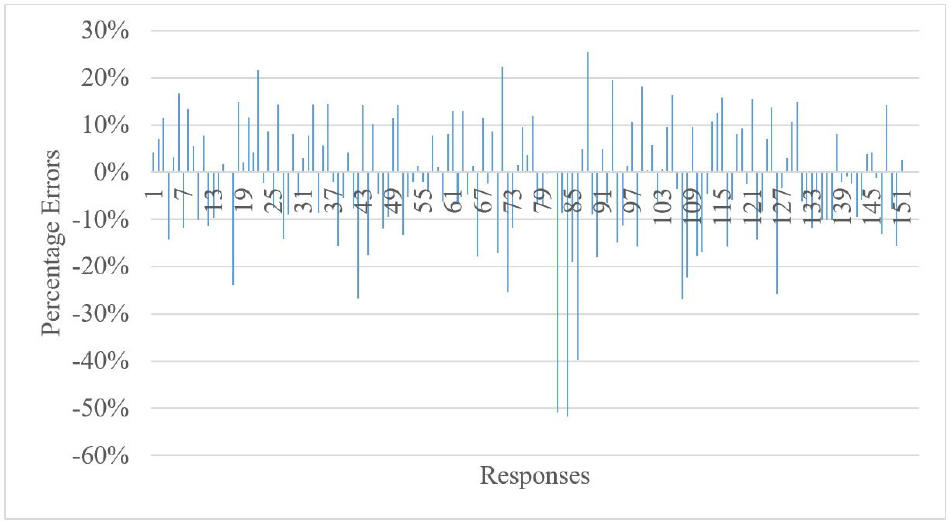
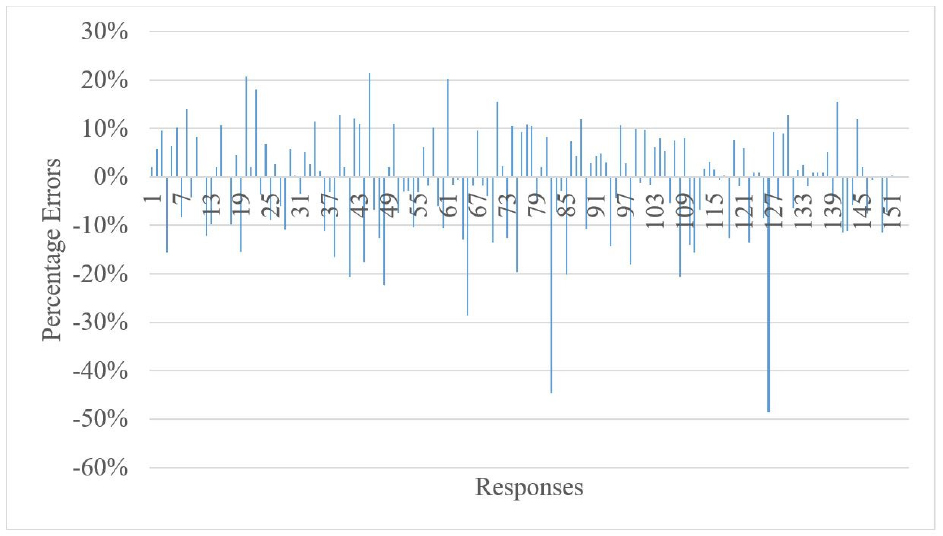
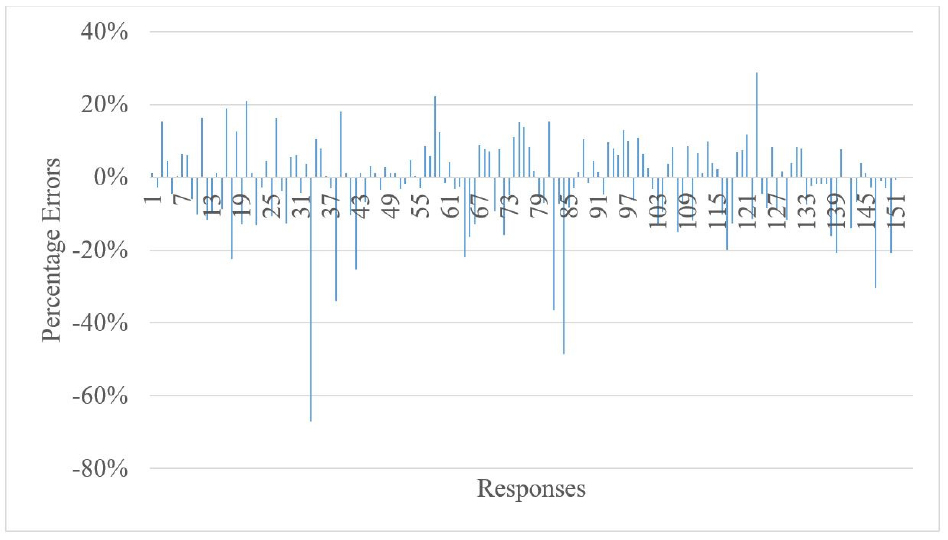
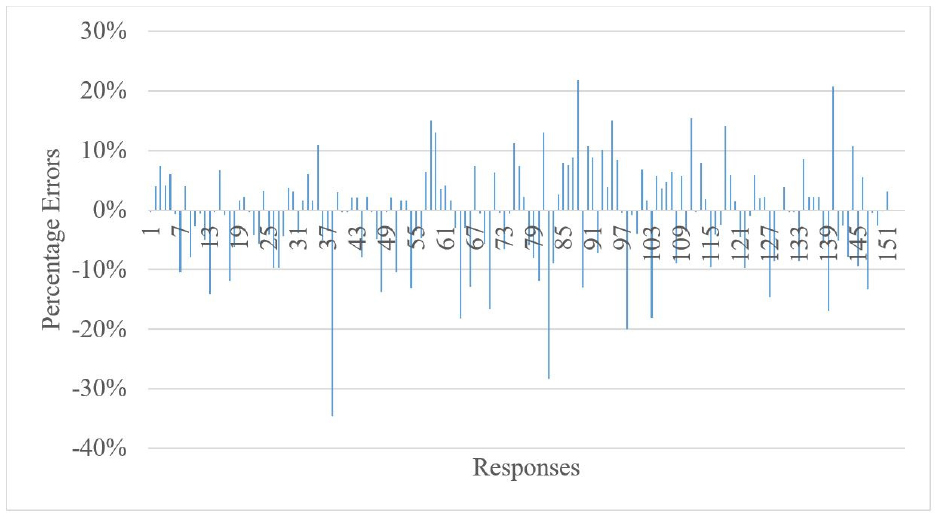
The accuracy of the proposed regression equations was assessed using Eq. (3), Eq. (4), and Eq. (5). The results of the percentage error (PE) calculations are shown in Figures 3, 4, 5, 6, 7, and the MPE and MAPE errors are presented in Table 9. Overall, the errors fall within acceptable limits, supporting the conclusion that the proposed models are applicable.
Discussion
The study’s results indicated that the effects of human-related, facility-related, and process-related barriers to BIM adoption are high. Three issues need to be further clarified as follows:
•Lack of high-quality human resources:
Numerous studies have identified the lack of education and training as a significant barrier to BIM adoption. For instance, a survey of mechanical contractors in the United States found that 58% had less than three years of BIM experience and considered themselves beginners in using this technology [39]. Similarly, a study on BIM adoption among quantity surveyors in government agencies in Malaysia revealed that a lack of BIM training is a major obstacle to its widespread implementation [40]. This challenge is particularly prevalent in the construction industries of many countries, where a substantial portion of the workforce often lacks the necessary formal training and expertise required to effectively leverage the advanced capabilities of BIM, which is a significant impediment to its widespread adoption an industry-wide scale [31].
Moreover, the construction sector’s reliance on a large proportion of low-skilled foreign labor has exacerbated the issue, as these workers frequently lack the necessary skills and knowledge to properly utilize BIM, thereby contributing to an overall unsatisfactory productivity level in the industry [31]. Ahn et al. [2] concluded that a combination of targeted education and training initiatives, investment in skill development programs, and the establishment of industry- wide standards and incentives can promote the adoption of BIM.
•High investment costs:
Existing studies have consistently found that the perceived high costs associated with BIM implementation, including the acquisition of necessary equipment, infrastructure, and software licenses, are a primary obstacle preventing more widespread adoption of this innovative technology across the construction sector [40]. In addition, the initiation of BIM often requires large initial investments not only for the technology itself but also for training and development [41]. This financial burden can be particularly challenging for small and medium-sized enterprises in the construction industry, which may lack the resources to overcome these barriers [42]. Notably, Alsofiani [21] highlighted the need for clear guidelines, standards, and government initiatives to address these financial barriers and facilitate the uptake of BIM, particularly among smaller construction companies.
The lack of a clear understanding of the long-term benefits and return on investment of BIM further compounds the challenge, as construction firms may be hesitant to make the necessary upfront investments without a clear business case [41]. While the benefits of BIM have been well-documented, the industry has yet to reach a tipping point where the technology is widely embraced. Overcoming the financial hurdles and developing a more robust business case for BIM adoption will be crucial in driving its increased utilization across the construction sector [21].
•Absence of a comprehensive legal framework:
Several studies have highlighted the critical role of clear standards, guidelines, and documentation in facilitating BIM adoption [23]. The lack of a comprehensive legal framework that adequately addresses the various contractual, liability, and intellectual property concerns associated with BIM usage has created uncertainty and hesitation among industry stakeholders, hindering the broader acceptance and implementation of this transformative technology [21]. One of the primary challenges is the ambiguity surrounding allocating roles, responsibilities, and data ownership within a BIM-enabled project [41].
Without a clear set of guidelines and protocols governing these crucial aspects, project participants find themselves unsure of their rights and obligations, leading them to refrain from fully embracing BIM due to concerns over potential legal disputes and financial liabilities that may arise [31]. Furthermore, the absence of standardized BIM-specific contractual frameworks and procurement models has made it challenging for organizations to continuously integrate this technology into their existing project delivery processes as they struggle to navigate the legal and commercial complexities associated with BIM implementation [21, 41].
Conclusions and Limitations
BIM is an effective tool for managing construction projects, particularly in the context of digital transformation. Numerous studies have shown that BIM offers significant benefits throughout the project lifecycle, but some barriers must be addressed. In the pre-construction phase, BIM plays a crucial role by providing a multi-dimensional information model for subsequent stages. This technology is critical in developing countries like Vietnam, where BIM expertise and infrastructure are limited, making these barriers more significant.
Based on expert surveys, this study identified the main barriers and benefits of using BIM in the pre- construction phase of construction projects. The average ranking results indicate that the key barriers include low-quality BIM human resources, high infrastructure investment costs, and the lack of a legal framework for BIM. Additionally, the assessment of the benefits, in descending order, highlighted improved communication among project participants, efficient construction design, enhanced visualization through multi-dimensional modeling, time savings in design and management during the early stages, and reduced costs associated with design errors and resource waste, as the top-ranked factors.
From the causal relationship analysis between barriers and benefits, this study identified the relative importance of the barriers. The results showed that human-related barriers accounted for 34.5%, facility- related barriers for 32.8%, and process-related barriers for 32.7%, indicating that these barriers have a similar level of influence. The multiple regression analysis of the relationship between BIM barriers and benefits revealed that human-related barriers strongly impact the benefit groups of visualization enhancement and cost reduction. In contrast, process-related barriers significantly affect time savings and design efficiency. Human-related and process-related barriers have equal influence on the benefit group of communication improvement, while facility-related barriers have a lesser impact. Eventually, the models for each barrier- benefit relationship are highly suitable, with R-square values exceeding 70%. The error rates, including a Mean Percentage Error (MPE) of around 2% and a Mean Absolute Percentage Error (MAPE) of approximately 10%, demonstrate the high accuracy of the proposed models in predicting the benefits achieved.
This study is exploratory and based on a limited set of factors and surveys; therefore, it has certain limitations. The number of identified benefits and barriers may not fully capture the complexity of the research problem. Additionally, the data collected is limited and may not represent a broader range of stakeholders, particularly those with long-term experience in applying BIM. Moreover, linear regression may not fully reflect the intricate relationships between barriers and benefits. Future studies should consider these limitations to enhance their research.
