


Introduction
Methodology
Dataset
Generating Frames and Feature Extraction
Classification Algorithms
Results and Discussions
Conclusion
Introduction
The phenomenon of deceptive behavior is one of the social phenomena which are widespread in the social life and are constantly observed in human relations. Human beings also tend to lie as a means of evading the negative effects or any societal threatening situation. As some would be deemed as petty, some types of deception can lead to severe social and legal consequences [1]. The level of human capability in being able to discriminate well between true and false statements has proven to be limited using empirical evidence. Averaged detection accuracy with a lack of technological aid is approximately 54 percent, which is only slightly higher than random guessing [2].
Under these constraints, automated deception detection systems continue to receive more and more interest in various areas of application, such as airports and other screening procedures, forensic case solving, interrogation, hiring procedures, and advertising solutions. In the criminal justice setting, it is especially urged that effective and consistent methods of differentiating between veridical and deceptive people need to be cultivated. The Polygraph test has been found to be the key to traditional lie detection since it is used to monitor physiological cues thought to be linked with lying [3, 4]. Polygraph tests are usually used in a criminal investigation with suspects and witnesses. They however require special equipment, physical sensors and trained examiners in order to be implemented which restricts scalability and can only be applied in real world situations.
In order to overcome such limitations, alternative solutions have emerged in the form of data-driven and machine learning based solutions. These techniques make use of behavioral data obtained on the people who are presumed as deceptive or truthful. In addition to physiological surveillance, there are a number of methods aimed at behavioral and communicative indicators. Monitored behavior such as a look in their eyes, changes in posture, facial expressions, body language, tone of voice and the language can be observed and used to provide objective clues that are likely to indicate that a person is lying. Detection of deception as a scholarly effort as applied to demeanor is described as the analytical work that categorizes truthfulness directing the use of these observable signals of behavior in an interview setting or a conversational exchange.
In spite of the fact that physiological detection instruments like polygraph and MRI based systems were considered in the area of deception detection, the diagnostic validity of these instruments is controversial [5]. In addition, expensive operations and transparency of the processes also limit their applicability in naturalistic conditions. On the contrary, video-based deception detection has a number of benefits. Video data collection is non-invasive, it is cost efficient and it does not necessitate the continuous expert monitoring once a trained model is obtained.
Although the use of surveillance technologies in smart and sustainable buildings has been increasing, most of the traditional monitoring technologies are dominated by manual observation or rule based detection mechanism with limited capability in interpreting complex human behavior pattern. Conventional surveillance approaches focus primarily on surveillance reporting of activities rather than intelligent behavioral analysis; limiting their ability to conduct proactive intelligence activities to identify potential risk or suspicious activity actions. Recent advances in machine learning have led to automated interpretation of visual cues from surveillance data; however, some of the current research heavily relies on deep learning architectures, which need large amounts of labeled datasets and sizable computational resources and specialty hardware for real time deployment. Furthermore, a limited amount of research has investigated the nature of lightweight behavioral monitoring frameworks that integrate both the facial and hand gestures analysis for risk assessment in building environments. To overcome such limitations, an intelligent gesture based behavioral monitoring system is proposed in this study based on multimodal visual information, which is obtained from facial and hand movements and tested the actual effectiveness of this method using a number of classical machine learning classifiers. The novelty of the proposed approach is computational efficiency, interpretability, practicality to be implanted in smart building infrastructures and uphabsPredictive performance. By systematically comparing a multiple classifiers while analysing gesture based behavioural features, this work helps advancing present intelligent surveillance research, bringing presence of a scalable and non invasive framework for automated behavioural risk discrimination in sustainable building environments.
The multimodal video analysis involves visual, acoustic and linguistic attention. In many cases, visual analysis uses classifiers that have been trained on low levels motion descriptors that can detect micro expressive movements which are subtle involuntary movements on the face and which are related to hidden emotions [6]. It is possible to extract deceptive inference out of patterns in these micro expressions. Besides using the facial expressions of tightening eyebrows or frowning [6], verbal expressions (hesitation or silence) and language patterns taught by the psycholinguistic analysis also play a role in modeling the deception [7]. Temporal dynamics between sequential video frames are another factor that improves the predictive ability because behavioral inconsistency through time can denote priming intentions.
Intelligent monitoring technologies have an important role to play in boosting safety and operation efficiencies in sustainable building environments. Modern smart buildings increasingly feature integrated surveillance and analytics systems to monitor the activities of occupants, control infrastructures, and help ensure facility security (offices, transportation hubs, educational campuses, public institutions, etc). Behavioral Risk Assessment Based on Automated Video-Analysis, the detection of suspicious or aberrant activities can be identified early, thus a preemptive response can be used by building management systems to respond to potential safety threats. Unlike traditional surveillance systems which only capture events, smart behavioural surveillance has the potential to help real time decision making by automatically analysing human gestures, movement patterns and interactions in monitored spaces. This capability is contributing to the sustainably management of infrastructure, through providing better occupant safety, decreased need for constant manual supervision, and efficient resource deployment in security areas. Therefore, the blending of machine learning driven behavioral analysis into the building surveillance systems create an effective mechanism that aids in improving safety, resiliency, and operational sustainability into the modern smart building environment.
The use of machine learning algorithms is among the key principles of designing deception analyzers to analyze criminal cases. Those algorithms include Decision Tree and Random Forest used to create predictive models [7]. The studies indicate classification accuracy between 60 percent and 75 percent in the cases when the multimodal feature fusion is implemented through mixing linguistic and gestural data. Other algorithms such as Support Vector Machine, random forest, naive bayes and logistic regression have also been tested in the situation of video based type of deception. Comparative results indicate that Support Vector Machine and random forest tend to perform well than Naive bayes and Logistic regression in the overall performance of predictors.
A more in-depth analysis shows that the performance of algorithms is determined by the modality of the features used. Linear Support Vector machine gives good performance in abacus training by using Improved Dense Trajectory features. Random Forest can be used with high level micro expression descriptors effectively. KERNEL Support Vehicle Machine is better when used on Mel Frequency Cepstral Coefficients of the speech signal [6]. These results highlight the significance of matching the structure of the classifiers with the features.
The first publicly availed collection of data specifically aimed at deception detection is a real life courtroom database offered by Perez Rosas et al. in 2015. This data comprises 121 video clips based on the process of court trial. The recordings were obtained in terms of publicly available web sources and can be discussed as unconstrained and reflecting the real conditions of the world. An experimental evaluation has been done using a sub-set of 104 clips (50 truthful and 54 deceptive samples) [6].
Another data set is as a result of publicly available records of multimedia trials where deceptive and truth behaviors could be verified independently. There were selection criteria that were applied to create sufficient data. Such limitations meant that the main speaker had to be recognizable, they needed to have their face visible enough during most of the video, visual sharpness has to be capable of analyzing expressions successfully, and the sound needed not only to be intelligible to enable the speaker to be transcribed from speech.
There is still a need to identify the best machine learning method in detecting deception based on facial and hand gesture features. The performance of the classifier depends on the configuration of parms and strategies of features selection. This paper critically reviews the various classification algorithms when the parameters are varied in an attempt to find the most successful model in detecting video based deception. The different classifiers considered include Decision Tree, Support Vector machine, K nearest Neighbor, and Naive Bayes which are compared through the usage of n Fold cross validation on court trial video features to determine the best level of accuracy.
A standardized set of trials in a court is used to measure algorithmic performance. The data will be divided into, training and testing subsets to test the capability to generalize. The results to the existing and future machine learning body of literature include enhancing the empirical evidence on the operation of the classifier in behavioral analysis signal tasks.
This study assesses the effectiveness of several distinguishing models to identify deceit in the real courtroom setting. The data is gathered at The Innocence Project site and it is a collection of 121 video clips which are classified as either false or true. These videos are transcribed and the verbal and nonverbal features that are relevant are extracted. Finding and validation training data is performed on several classification algorithms and systematic parameter optimization methods are used in order to maximize predictive accuracy.
There are six main classifiers which are compared: Random Forest, Decision Tree, Linear Discriminant Analysis, Support Vector Machine, and Naive Bayes. They are compared in order to determine their effectiveness on the chosen data set. The rest of the research is designed in the following way. Section 2 details the methodology and the classification algorithms that were used. Part 3 is devoted to the discussion and results of the experiment. The final section 5 provides some of the main findings and implications.
Methodology
Dataset
In a bid to evaluate non-verbal behavioral indicators with cheating behaviors, the courtroom trials on tape were systematically gathered in the real world. Multimedia sources that are publicly available and include videos of trial hearings were explored with an aim to find genuine examples of true and dishonest behavior that could be reasonably deduced. Video videos were tagged depending on judicial results and situational authentication. There were three possible outcomes of trials, namely, guilty, not guilty and exoneration. These results were the points, of reference, in classifying either of the clips as deceptive or truthful. In cases where the accused received a guilty verdict, the parts where the accused stated that they did not commit the crime were identified as deceitful. On the other hand, interviews made by witnesses who testified in line with the factual information that was confirmed were described as true. In some scenarios, lie was found in suspect responses denying the commission of criminal activities whereas in others, the suspect response when answering questions of facts considered as being true that had been earlier verified through law enforcement agencies was termed as true. When it comes to witness testifying, statements that had been professionally confirmed by the police were classified as truthful. Conversely, the statements that were found to be false in favor of a person that was to be found guilty were termed as deceptive. In exoneration cases, the accused individuals were classified with the truth of their statements made. The last dataset consists of 121 video clips, each of which should be classified separately. The mean length of a clip is about 28 seconds. There are 61 clips that are labeled deceptive and 60 clips labeled truthful. The data is of 56 different speakers, comprising of 21 and 35 men and women between the ages of 16 and 60 years.
The dataset used in the current study is composed of courtroom trial videos which are available from the multimedia sources that are available for the public as a record for real legal proceedings. A total of 121 video clips were collected which represent statements from 56 different people involved in the trial cases. The participants include both male and female speakers in the ages approximately 16 and 60 years. Each clip is on average about 28 seconds long. The data set contains 61 clips which were labeled as deceptive and 60 clips labeled as truthful as per verified judicial outcomes and contextual evidence presented during the trials. In deceptive cases subjects deny their involvement in criminal activities even if they end up being proven guilty, whereas truthful samples define statements consistent with verified cases evidence or testimonies proved by the legal investigations. All videos were gathered from publicly available sources and thus do not involve direct interaction with human participants and collection of personal data by the researchers. The recordings represent unconstrained real world conditions including lighting variations, camera angles, facial visibility variation, and background noise. These characteristics make the dataset suitable for the evaluation of behavior analysis systems in realistic surveillance situations.
Generating Frames and Feature Extraction
Initially, the video clips were processed to obtain a number of frames. Each frame contains a binary value representing true or false for each gesture type. We considered nine features, and every feature comprises of different types of gestures. We divided the feature set with binary values into facial gestures and hand gestures. So, each video instance provides a binary value for 39 fields where each field stands for a type in nine different features: General face, Eyebrows, Eyes, Gaze, Mouth, Lips, Head Movements, Hands, and Hand Trajectory. All the types of features that represent facial expressions such as General face, Eyebrows, Eyes, Gaze, Mouth, Lips, and Head Movements are considered facial gestures, and the types of features related to hand movements such as Hands and Hand Trajectory are considered as hand gestures as shown in Table 1.
Table 1.
Classification of gestures based on the features
| Types of Gestures | Name of the Feature |
| Facial gestures |
General face, Eyebrows, Eyes, Gaze, Mouth, Lips |
| Hand gestures | Hands, Hand Trajectory |
Feature extraction based on gestures has been carried out in the form of structured analysis of visual features existing in each frame of the video. First, all the courtroom video clips were divided into a series of frames through a video frame extraction process. From these frames facial and hand areas were analyzed in a visual way to pick out particular behavioral information: eyebrow movement, eyes activity, gaze direction, mouth movement, lip compression, head orientation, and hand trajectories. Each identified type of gesture was described as a categorical indicator of the presence or absence of each of the behavioral signals within the frame sequence of a fluorescent hack. For each occurrence of a video, the presence of these gestures was to be encoded in a structured feature vector. Binary values were assigned to indicate the presence/absence of a given gesture type in the video segment, i.e., 1 means gesture was present in the video, 0 means the gesture was absent in the video. The extracted features were grouped into two major categories namely facial gesture features which comprises of general face movement, eyebrows, eyes, gaze, mouth, lips and head movement and hand or facial gesture features which comprises of hand posture and hand trajectory. This encoding process was able to metamorphose the visual behavioral information into a numerical version that could be used as a direct input for machine learning classification models.
Classification Algorithms
The processed data are taken as input to the various classifiers as mentioned in Figure 1. Several studies are done on different classification methods. Many researchers have compared the performance of different classification methods in different domains.
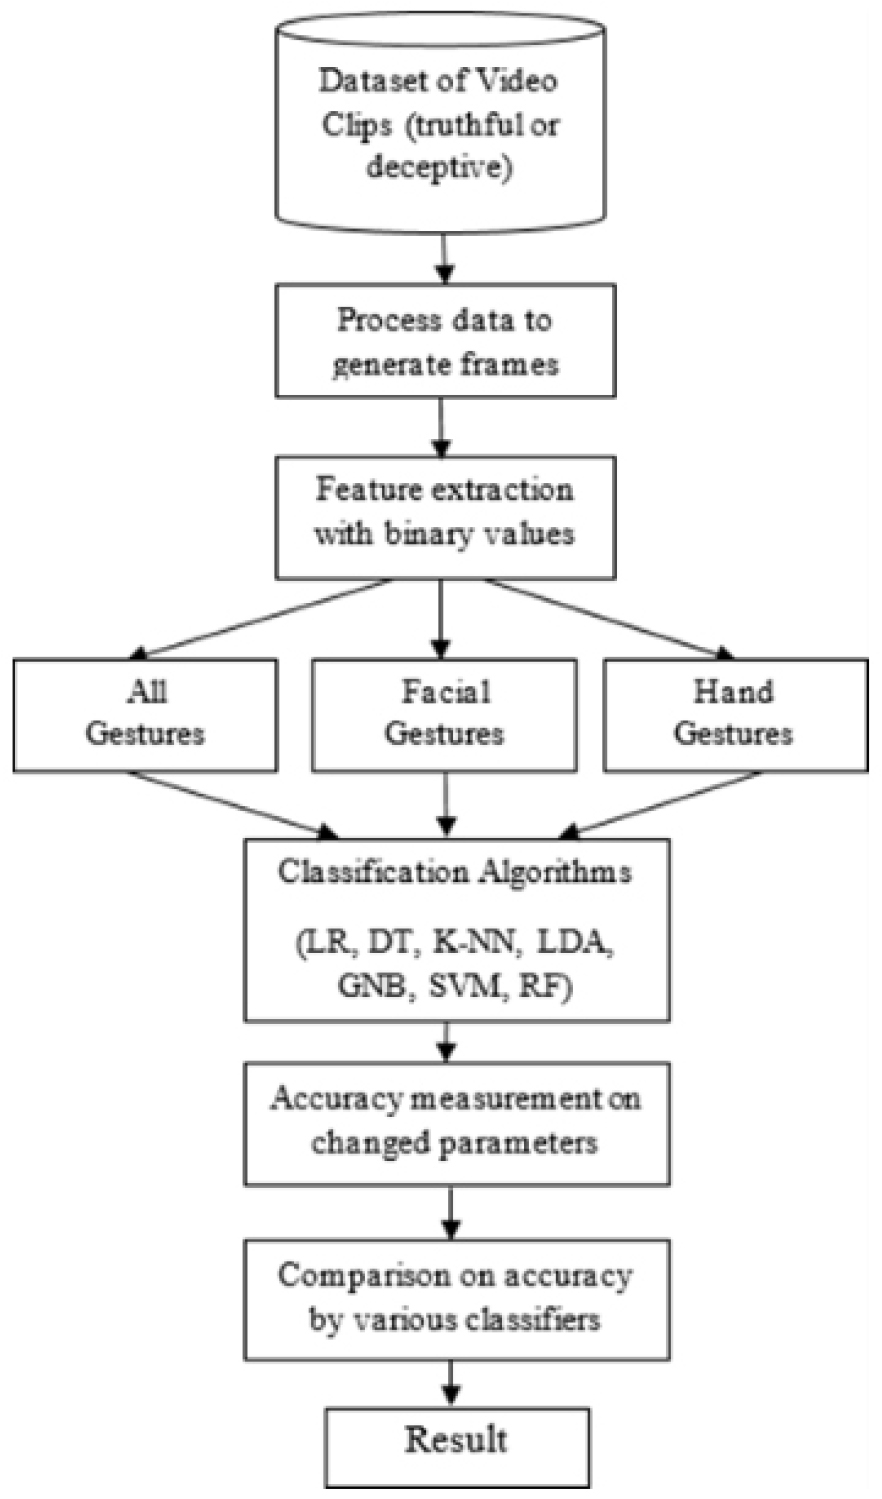
After the feature extraction stage, the derived feature based gesture vectors were collected into a structured format of a data set with rigor for machine learning analysis. Each video clip is associated with a single observation that has multiple gesture based attributes and a binary class label of either truthful or deceptive behavior. The dataset was split into training and testing subsets which was used to test the generalization ability of the classifiers. The feature vectors were used as input variables and the deception label as target output variable. Several classification algorithms - supervised classification algorithms - were tested to analyse their ability to separate deceptive and truthful behaviour patterns. The selected algorithms are Logistic Regression, Decision Tree, k Nearest Neighbor, Linear Discriminant Analysis, Gaussian Naive Bayes, Support Vector Machine and Random Forest. These algorithms were selected as they represent different modeling paradigms such as probabilistic models, distance based learning, linear discriminant approach and ensemble learning methods. During experimentation, parameters of the model were expanded on and tested with cross validation to find the model setup with the most accurate classification rate. The comparative evaluation of more than one classifiers allows to find the best classifying algorithm for gesture based behavioral risk detection for video monitoring systems.
Decision Tree (DT): Decision Tree is a supervised algorithm based on a hierarchy of learning that is commonly used in classification and decisions. The model is a concept of classification according to a hierarchical tree. The internal nodes might be characterized by the feature attributes and the branches are the possible values of the feature attributes. Assuming the value of an attribute of a set of instances, they can be classified at the root node by the value and go downwards until the root is reached [8]. Attributes based decision tests are represented by non leaf nodes with the class labels being leaf nodes. The values of the attributes are compared as per the tree structure to get the unknown class of a given tuple by X. A node on the root traverses a path to a node on the leaf that defines the decision rule that specifies the predicted class of the said tuple [9]. Decision Trees are used in machine learning and data mining applications as predictive models, where the input features are discrete, an input feature is observed and then the outcome categories are discrete [10]. Not only can they be operated on multidimensional feature space but they can also work with numerical variables and categorical variables. Decision Trees can be used to create decision boundaries which represent the complex nonlinear relationships. The overall aim of the use of Decision Tree algorithm in this study is to generate the target class using the decision rules using the information obtained by learning on already labelled data. Root nodes divide the dataset by given selected features, which could produce several branches. Final products of classification are leaf nodes. At every step in building a tree, the algorithm picks the attribute that produces the highest information gain among all the possible candidate features [11] and hence most optimal partitions.
Logistic regression (LR): Logistic Regression is a popular statistical learning algorithm that is applied in binary classification tasks and estimating predictors on the likelihood of categorical response. In contrast to the linear regression where the continuous values have to be predicted, Logistic Regression approximates the likelihood of an instance to be part of a given class. The technique uses the logistic function to convert a linear combination of features as input into a probability value normalised to 0-1. There is a linear boundary of the decision made in feature space and the probability of membership in a class is based on the distance of the data points to the boundary. The smaller the size of the dataset, the less apparent the predicted probabilities are around the ends, 0 and 1, as more data is available to be confident in classification decisions. Since Logistic Regression gives calibrated estimates of probability, and many other purely discriminative classifiers only give categorical results, it can give richer predictive interpretation. The estimates of probabilities can however be inaccurate when model assumptions have been violated. Theoretically, the concepts of Logistic Regression resemble Ordinary Least Squares regression to an extent that they both approximate relationships between outcome and independent parameters. The most important distinction is in the type of response variable, that means that the Logistic Regression is specially fitted to dichotomous or binary outcomes only.
Support Vector Machine (SVM): S A supervised learning framework created by Vapnik and colleagues and introduced as Support Vector Machine was originally designed to handle linear classification tasks [12]. SVM has over a period become one of the most popular machine learning methods in solving classification, regression and structured prediction tasks [13, 14]. SVM aims at identifying a representative separating hyperplane which maximizes the separating margin between two classes in a set of labeled training observations [15]. The distance of the hyperplane on the nearest data points of each group is called the margin. This margin maximization. These data samples nearest to the decision example are called support vectors [16]. The following points are important as they determine the position and orientation of the separating hyperplane. SVM builds the classifier based on those influential cases that form the boundary as opposed to using all the training samples. The best hyperplane is used to choose the hyperplane such that the margin between the decision surface and the nearest data points in each category would be large [17]. The efficiency of SVM in high dimensional feature spaces is one of the greatest benefits of the method. SVM is able to use the non linearly separable data and convert it to a higher dimensional plane where linearity is achievable using the application of kernel functions. This is what makes SVM to be able to deal with complicated decision boundaries in the large range of classification problems.
K Nearest Neighbor (KNN): K Nearest Neighbor is a simple yet general and popular supervised learning algorithm, which can be applied in classification as well as regression. It assumes that instances of data that are similar in nature are likely to be imposed closely in feature space. To classify an unlabeled example, the single example is given a label in one of the classes determined by the label of the nearest labeled examples provided in the training set. The parameter that is looked at is the number of neighbors that should be considered. It is a parameter that establishes the number of surrounding data that are investigated and then a class is allocated to the new instance [18]. A distance metric of such kind as Euclidean distance is often used to measure the concept of proximity. Within the KNN framework, the process of the classification consists of the calculation of the distance between a query instance and all the training instances. The nearest k samples are determined and by majority voting, the classification label is obtained. KNN techniques are generally divided into the structure based and structure less technique [19, 20, 21, 22, 23]. The structure based techniques are based on predefined organization of the data and use of this organization to help the neighbor search of data. Structure less approaches by comparison make direct computations on the complete data without the need of indexing structures. Here, the distance is calculated between the test case and the entire training cases and the smallest values of the distance are used to identify the closest neighbors. Although KNN is simple, and has an intuitively design, there are various limitations of the model. First, it is very memory-intensive since the complete training content should be stored. Second, the performance is very sensitive to the distance measure that is employed in gauging the similarity between the instances. Third, the theoretically best way to pick the value of k does not exist, it is often computed by cross validating or other time-consuming tuning methods [20].
Linear Discriminant Analysis (LDA): Linear Discriminant Analysis and Quadratic Discriminant Analysis are basic strategies in the wider framework of discriminant analysis methods of machine learning. Linear Discriminant Analysis has mostly been used in dimensionality reduction and supervised classification where aim of the task is to discriminate two or more classes with a linear decision boundary. LDA finds a model that is a linear combination of input features which best acts as class discriminative. This approach instead builds a projection vector that makes use of individual features individually but produces an effective reduction on the dimensions of the original feature space without sacrificing the class separability. This linear discriminant function is then classified. LDA has its theoretical basis on the Linear Discriminant which was first developed by Fisher as a statistical regression analysis and pattern recognition tool. The approach is based on the assumption that each feature distribution received in a common covariance and that the distribution is of a normal distribution. In these conditions, LDA completes the separation of the classes to maximum by maximizing the ratio of the between class variance and within class variance [21, 22, 23, 24, 25, 26]. The optimization process is done to make sure that the class means projected are as far as possible and there is minimal dispersion in each class. There are usually two main change strategies, which include class dependent transformation and class independent transformation. The class dependent transformation calculates transformation parameters on a per-class basis as compared to class independent transformation which estimates a transformation matrix which can be applied to all classes.
Random Forest: Random Forest is a supervised ensemble learning algorithm that is commonly applied in classification and regression. It has shown a good performance in pattern recognition tasks as well as bioinformatics and other high dimensional environments [23]. The main idea behind the Random Forest algorithm is to build a system of decision trees and to combine the results of such trees to enhance predictive power and strength. The model most often uses a bootstrap aggregation process called bagging to obtain multiple decision trees with random subsets of the training data. They are trained on randomly selected samples of observations on each of the trees. The ultimate classification choice comes about by majority voting on all the trees in the group. The mechanism of this aggregation decreases the variance and alleviates overfitting in comparison to a single model based on the decision tree [24, 25]. Random Forest has some common hyperparameters, as compared to the typical decision trees, such as depth of the trees and splitting rules. It however adds more randomness when constructing the trees. The algorithm tries to pick the best feature of a randomly selected sample of possible features at each split instead of trying out all possible features. This is a stochastic process of selecting features, which makes the models more diverse and perform better in terms of generalization. Splitting Nodes Node splitting is commonly conducted in terms of a decrease in Gini impurity, which quantifies homogeneity of class labels in partitions generated [26, 27, 28, 29, 30, 31, 32, 33, 34, 35]. Random Forest, by averaging the prediction of a series of trees, has shown to be a very good predictor and also estimates significance of features, which is very useful in features interpretation of classification problems.
Gaussian Naive Bayes: Gaussian Naive Bayes is a probabilistic classification algorithm that seeks to use the assumption of conditional independence between features to use the Bayes theorem. It is known to be one of the simplest, but efficient in machine learning classifiers. Conventional Naive Bayes processes are typically used on discrete or multinomial feature space. Nevertheless, in case of continuous variables, the Gaussian case is based on the assumption that the values in features of a single class are normally distributed. In this supposition, the chance of meeting a specific feature value is calculated with the parameterization of the parameter of a Gaussian probability density function with class specific estimates of the mean and the variance. Although it simplifies its implementation by making the assumption that features are independent, an assumption which is possibly not true in numerous real world applications, the Gaussian Naive Bayes can frequently perform competitively in high dimensional tasks. It is specially well adapted to lower level modeling and high speed classification by its computational efficiency, low parameter requirements, and closed form probabilistic formulation [36, 37, 38, 39, 40, 41, 42, 43, 44, 45, 46, 47].
Results and Discussions
To deal with the effectiveness of the proposed behavioral monitoring framework, a structured experimental validation strategy was used. The generated craft was split up into two subsets: training and testing, to test the generalization ability of each classifier. Model performance was mostly estimated according to the classification accuracy, which represents the ratio of correct predicted cases to the total number of samples. Accuracy measures accuracy very commonly used in binary classification problems in which one want to discriminate two classes such as truthful and deceptive behavior. In addition to assessing its accuracy, the performance of comparative classifiers were performed in all selected classifiers to see how they are comparable under the same feature representation and dataset condition. Each classifier was trained based on the extracted vectors of gesture based features and tested on unseen samples to test their predictive capability. The results were then summarized, through graphical comparison and tabular analysis, in order to determine the most effective algorithm for treating gesture based behavioral risk assessment.
We called the classifier functions for all the gestures, facial gestures and hand gestures consecutively. We changed the default parameter values used by the classifier functions to discover the highest accuracy. The highest accuracy achieved from every classifier are compared through charts to obtain the final result We used accuracy as performance metric for evalu- ation. We conducted the experiment to measure accuracy using seven classification algorithms: Logistic Regression, Decision Tree, K-NN, LDA, GNB, SVM and Random Forest. At first, accuracy was measured with all the gesture types including both facial and hand gestures. Then, we separately measured accuracy for facial gestures and hand gestures. Accuracy is the appropriate measurement of classification by the classifier of the test set tuples.
Observing the result, we see that the accuracy is more than 70 percent for every classifier used in this paper. We got the highest accuracy for K-NN and SVM which is 80 percent.
In order to better prepare the classifiers for prediction, a process of systematic hyperparameter tuning was followed for the model training. Each machine learning algorithm has a number of configurable parameters that affect the classification behavior and generalization capability of the algorithm. In this study, parameter tuning was done through iterative experimentation by adjusting some of the key hyperparameters associated with each classifier. For example, the number of neighbors and leaf size were varied in the case of the K Nearest Neighbor classifier and the regularization parameter and kernel configuration was varied in the case of Support Vector Machine model. Similarly, penalty parameters were modified for Logistic Regression and structural parameters were explored for tree based algorithms such as Decision Tree, Random Forest. During the tuning process, several combinations of parameters were tested and the combination that resulted in the highest classification accuracy was considered the best setting. The combination of parameters chosen for the final evaluation is summarised in Table 2. This parameter exploration process is to ensure that the results reported are not from classifiers that have only been calibrated with the default algorithm settings.
Table 2.
Impact of Parameters in Classifier Functions
We changed the default parameter values used for each classifier functions and chose the parameter values for which we found the highest accuracy. A small sight of the parameter values is shown in Table 2. The chart in Figure 2 shows the comparison in the accuracy of the classifiers. Keeping the hand gestures aside, we first considered the facial expressions for accuracy measurement table. The accuracy of the classifiers decision tree and random forest for both facial and hand gestures in Table 2 is inherited from the previous work [6].
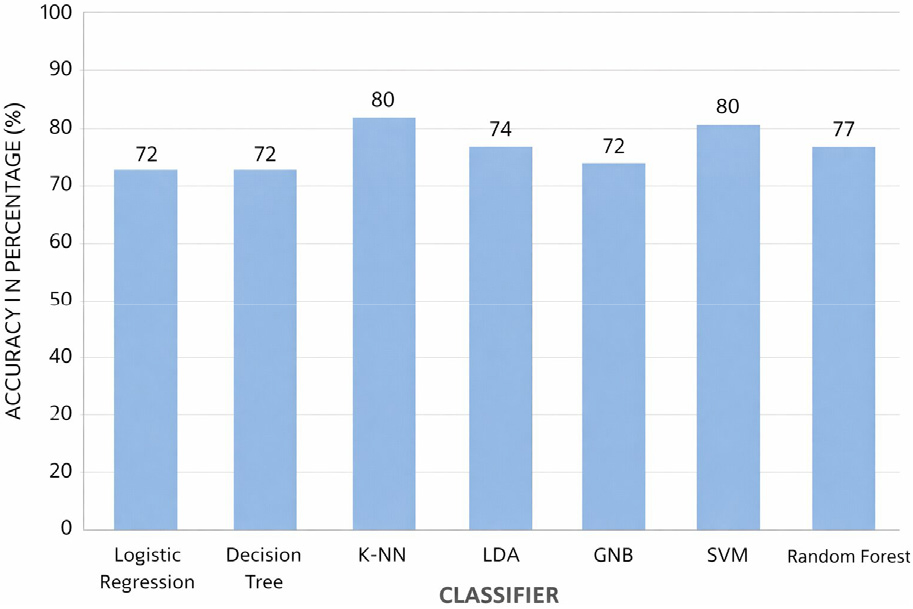
The comparative analysis of classification algorithms shows that there are some significant differences in predictive performance among the tested classification algorithms. Of all the classifiers evaluated, K Nearest Neighbor and Support Vector Machine gave the maximum overall accuracy with both facial and hand gesture features combined together. The good performance of K Nearest Neighbor can be attributed to the mechanism of instance based learning that can capture the similarity patterns among gesture based behavioral feature well without needing strong assumptions of the distribution of feature. Since the gesture features are representational behavioral cues, distance based classification methods can be used to successfully classify the similar behavioral pattern of truthful and deceptive samples. Similarly, Support Vector Machine has a good classification capability since it is able to build an optimal separating boundary with a maximum distance between classes in the features space. This characteristic helps the model to manage complicated relationships among multiple attributes of the gesture. In contrast, probabilistic models e.g. gaussian Naive Bayes have only an overall dependence of the features, which might not reflect the full instance of the interdependencies of facial and simultaneously occurring hand movements in human behaviour. As a result, algorithms that are more suitable to model feature interactions will tend to have an improved performance for classification in gesture based behavioral analysis.
Considering the facial gestures, we found maximum accuracy with the LDA classifier which is 79 percent. The bar chart in Figure 3 shows a comparative analysis of accuracy with various classifiers for all kinds of facial motions. Conjoining different types of hand movements and gestures, we gathered the accuracy findings in Table 2.
The highest accuracy which is 72 percent found with the hand gestures is in LDA classifier as depicted in Figure 4.
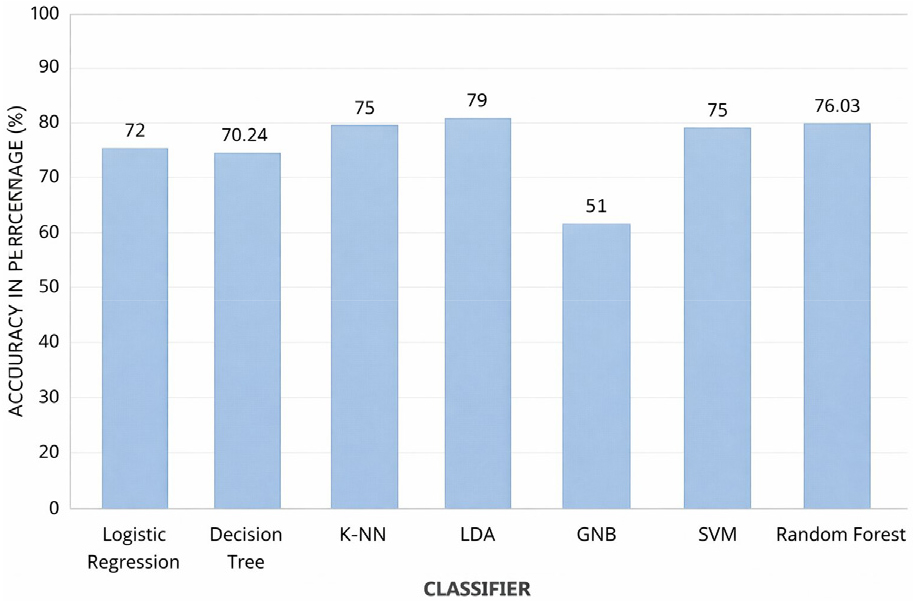
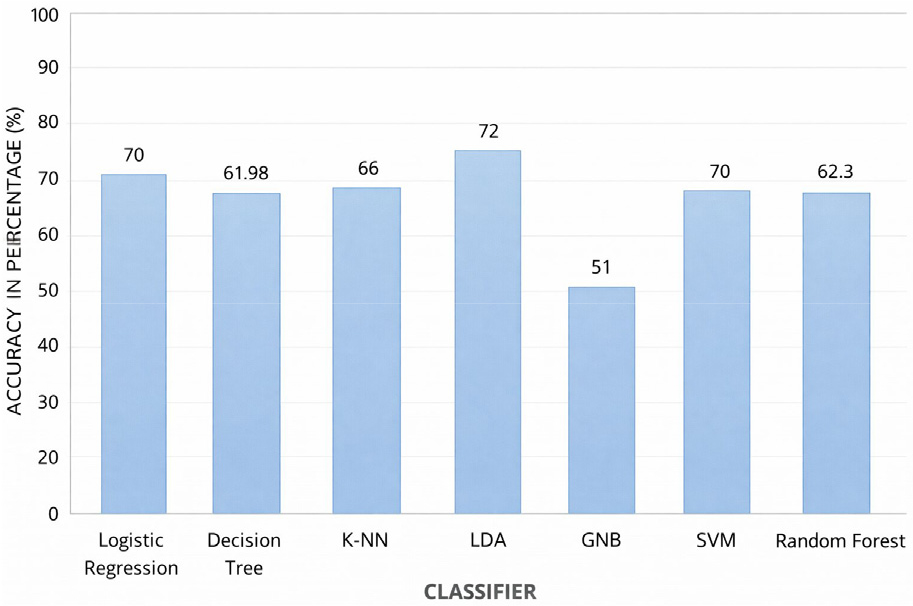
The accuracy results with classifiers logistic regression, K-NN, LDA and SVM strengthens the result previously achieved with decision tree and random forest. We found the highest accu- racy with LDA classifier individually for both hand gestures and facial gestures. This accuracy of LDA was achieved with default parameter values.
An additional observation made by the experimental analysis is the effect of various gesture modalities on classification performance. When facial gesture features were analysed separately the classifiers became more accurate predictors than models trained using hand gesture features alone. This results indicate that the facial expressions contain stronger behavioral indicators in relation to deceptive or truthful communication. Facial cues such as eye movement, gaze direction, lip compression and eyebrow movements often represent involuntary emotional responses that are not easy to consciously control, and are therefore valuable emotional signals for behavioural analysis. In contrast to this, hand gestures could be more consciously controlled and thus weaker discriminative information when in isolation. However, when both facial and hand gesture features are Hershey’s combination of the multi-modal representation enhances the total classification ability of the system. The combination of several gesture modalities means that the machine learning models will be able to capture complementary signals from the user behaviour which will result in an enhanced detection performance. This result underlines the importance of using multimodal behavioral analysis in intelligent video monitoring systems and the advantages of having more reliable systems to assess risk. The proposed intelligent video monitoring framework shows a number of practical implications to safety management in sustainable building environments. By automatically analyzing behavioral cues like facial expressions and hand gestures, the system can help building administrators identify potentially suspicious or risky behavior without having to automatically say “You’re suspicious!” This capability can be used to increase the effectiveness of security monitoring in environments such as corporate buildings, transportation terminals, educational institutions and other types of public infrastructures where large numbers of occupants interact in common spaces. Integrating behavioral analytics into existing infrastructure of surveillance systems can aid in early warning systems, better situational awareness and help facility managers make informed security decisions. In spite of all of these advantages, there are some limitations that must be recognized. The proposed framework is mainly based on information from visual gestures based cues captured in surveillance videos, which may be influenced by lighting condition variation, camera angles, occlusions, and video resolutions. Additionally, behavioral signals related to deception or risk related activities can vary greatly across individuals and across cultures, which may act to negatively impact the level of classification reliability. The relatively small dataset size can also limit the generalization capability of the models when it is put into large scale real world environment.
Conclusion
This research introduced an intelligent video monitoring framework for behavioural risk assessment in sustainable building environments through gesture based analysis and the classical machine learning techniques. The proposed system uses non invasive visual cues obtained from facial and hand gestures that are used to automatically detect behavioral patterns that correspond to truthful and deceitful activities. By extracting features from the video signal of court rooms based on gestures and testing some supervised learning algorithms, the present research has provided a study of comparative analysis of some of the popular classification algorithms such as Logistic Regression, Decision Tree, k Nearest Neighbor, Linear Discriminant Analysis, Gaussian Naive Bayes, Support Vector Machine, and Random Forest. Experimental results showed that K Nearest Neighbor and Support Vector Machine algorithm had the best overall classification accuracy when multimodal features of gestures were combined. The results also show that facial gestures are better also in regards to hand gestures separately, for the reason that in combining it makes it more robust in behavioural detection. From a practical point of view, the proposed monitoring framework offers a scalable and cost effective approach which can be integrated into the current surveillance infrastructure of smart buildings. By allowing for automated behavioral analysis and risk detection, the system can help in facility management and improve occupant safety and play a role in building intelligent and resilient urban infrastructures. Overall, the results prove the effectiveness of machine learning based gesture analysis as an effective component of a smart monitoring system in sustainable building environments.
Future work can further improve the efficacy of intelligent behavioral monitoring systems and requires the use of multimodal sensing solutions that combine visual gesture analysis and other behavioral and contextual cues. For instance, combining cue information from physiological responses, such as voice stress patterns, speech characteristics or biometric signal, would enhance the reliability of detection of deception and behavioural risks. The use of more sophisticated deep learning techniques for automatic feature extraction may also allow subtler patterns of behaviour to be more accurately recognised. Another important direction of research is to implement the proposed framework in real time monitoring environments in smart buildings to test the system performance under real operational conditions. Such deployments will require integrating technologies with building management systems, making video analytics infrastructure scalable, and creating privacy protecting mechanisms for the data. How expanding the dataset with more diverse behavioral scenarios and real world surveillance footage will provide a greater robustness and generalization capability for the models. These developments will contribute towards the creation of more intelligent, adaptive and context aware monitoring systems for sustainable urban infrastructure.

