

Introduction
Throughout the course of human history, technological advancements have introduced new products and services. In some cases, these replace existing products, while other times they augment the use of an existing technology. In most cases, no assessment is made regarding the environmental and social impacts of either the new technology or the status quo. As such, it is impossible to determine if technological advancements represent the “optimum” outcome for society as a whole. For instance, when computers and other electronic devices became popular in the 1970’s and 1980’s, the environmental consequences of their use were not well understood or studied. Many people believed that electronics would eliminate society’s dependence on paper products [1]. However, there may be also some doubt if the shift from a use of paper to a reliance on computers have a positive impact on the environment. In addition, when computer use increases the volume of paper use (as now seems to be the case due to the relative ease in printing) [2], the impacts of this users’ pattern on the environment could follow a different trajectory.
As a similar study, the environmental impact associated with substituting the use of a personal digital assistant (PDA) for reading a newspaper was evaluated using life-cycle assessment (LCA) [3]. LCA is the process through which environmental impacts of products, services, or processes are evaluated [4], [5]. When performing an LCA, the objective is to evaluate the environmental impacts that occur throughout every stage of a product’s life, including design, resource extraction, manufacturing, use/operation, and end-of-life. The environmental impacts can be stretched from resource, material, water, and energy use (inputs) to emissions of toxic pollutants and green-house gases (outputs) [6]. This study found that PDA use resulted in fewer emissions of carbon dioxide (CO2), nitrous oxide (N2O) and sulfur dioxide (SO2). In addition, Kozak and Keolelan [7] compared printed books versus electronic books (E-books), and revealed that E-books resulted in lower environmental impacts including global warming potential, ozone depletion potential, and acidification potential and required fewer inputs including material, water, and primary energy.
In this study, the paperless office is defined as an office where all paper documentation will be replaced by digital content except for documents that are final drafts or can be considered legally binding and we attempts to analyze the relative environmental impact of the use of paper and electronic devices. In order to examine that the transition to a completely paperless office would have potential environmental advantages associated with decreased (or eliminated) paper use, the objectives of this study were set (1) to compare the environmental impacts of running an office with traditional paper use with those of a “paperless” office through use of life-cycle assessment (LCA) techniques; (2) to apply the environmental analysis to a typical office case study; and (3) to consider the feasibility of transitioning to a paperless office scenario.
Background
Three models for an LCA, including process-based LCA, economic input-output (EIO) analysis, and hybrid approaches have been applied to compare the paper and paperless scenarios. Brief description on methodologies used are as follows:
Process-Based LCA
The International Organization for Standardization (ISO) has published an international standard for environmental management systems (ISO 14000), which include a standard LCA methodology based on the process-based approach. A similar methodology has been developed in the United States by the Society for Environmental Toxicology and Chemistry (SETAC) and the Environmental Protection Agency (EPA) [8]. The process-based approach is based on an understanding of process flow diagrams which indicate the flow of resources and materials during the life-cycle of a product. Process-based approaches are limited, in that process flow diagrams are not readily available for all products. Analysis through a process-based approach can be very time- consuming and cannot account for all supply-chain impacts associated with product manufacturing. However, process-based approaches allow for a very specific and detailed evaluation.
Economic Input-Output Analysis (EIO_LCA)
EIO-LCA was developed by the Carnegie Mellon University Green Design Initiative [8] to facilitate LCA calculations and to account for the entire supply chain for a product. It uses a matrix input-output model of the United States economy, augmented with environmental impact factors to account for environmental impacts of a product [6]. While this procedure is more effective at accounting for supply-chain impacts, it is limited in that some sectors of the United States economy aggregate several different types of products. The EIO-LCA tool is available on the internet [9] and can be used to evaluate environmental inputs and outputs associated with monetary transactions within sectors of the economy.
Hybrid Approaches
A hybrid LCA incorporates the positive attributes of process-based and EIO-LCA; namely, the ability to account for supply-chain impacts and the ability to look at specific systems or processes [10].
In the paperless office, all paper documentation will be replaced by digital content except for documents that are final drafts or can be considered legally binding. Documentation shall be considered any information stored on paper. Thus the types of documentation that will be eliminated in the paperless office will include but not be limited to; inter-office messages, notes, report drafts, computer aided design (CAD) drafts, and drafts of other documentation. In this definition, paperless refers to the elimination of all “office paper”. Office paper can be defined as all forms of paper that an office has complete control over, including both use/production and disposal. For instance, note paper, drafts on copy paper, folders, and envelopes used to deliver draft materials, which are typically produced within an office, will be eliminated in the paperless scenario. However, other paper forms such as packaging and mail, which are delivered to the office and not produced in the office, will not be eliminated in this study.
This study also evaluated an intermediate scenario where the use of paper is reduced by half and some new electronic components are introduced to the office (50% scenario), since it may be impossible to completely eliminate office paper use. Thus, the relative environmental impacts of paper-use (0% paperless) office scenario, the 50% paperless office scenario, and the 100% paperless office scenario encompassed in the above definition were evaluated.
On the paper side, the analysis includes the energy and pollution associated with timber harvesting, pulp and paper manufacturing, an estimate of the amount of paper used by an office worker, disposal and/or recycling options, and an assessment of the electronic devices ancillary to paper use, such as copy machines and printers. On the paperless side, the analysis includes an estimate of what additional electronic equipment will be required, the energy and environmental costs associated with the manufacturing of those electronic parts, and the use of electricity to power this equipment.
Available Data
A literature review was performed to determine what data is available related to the environmental impact of paper and electronic office equipment, and what economic sectors included within the EIO-LCA tool would be appropriate to include in this study.
Office Paper
The only publicly available LCA on office paper was conducted in 1995 by the Paper Task Force (PTF), a group sponsored by the Environmental Defense Fund (EDF) [11]. The results of the PTF were later used to develop a web-based paper calculator. In cooperation with the US Office of the Federal Environment Executive, the US Postal Service and the EDF collaborated on the creation of the web-based paper calculator. The web-based paper calculator has the capabilities to measure the impacts of different paper types at different use rates [12].
The EIO-LCA tool includes several sectors relevant to paper use including [9]:
‧ Paper and Paperboard Mills (Sector #240800),
‧ Blankbooks, looseleaf binders and devices (Sector #260602),
‧ Stationery, tablets, and related products (Sector #240705), and
‧ Envelopes (Sector #240400)
Additional sectors were identified as being relevant to paper use, but were not considered as part of the study. These included logging and pulp mills, which were not included because the paper and paperboard mills sector was a more specific sector and is defined to include operations that combine logging and paper manufacturing. The paper industries machinery sector was likewise not included because it was assumed to be part of the supply-chain for the paper and paperboard mills sector. Finally, the writing ink (chemical and chemical preparations not elsewhere classified) and pens, mechanical pencils, and parts sectors were not considered as it was assumed that pen and pencil use would not be eliminated.
Generation and Consumption of Paper in the United States
This study examines the impact of “office” paper only. Office paper, a subcategory of the “printing and writing” paper industry [13] includes letterhead, computer and copying paper, graph paper, note paper, envelopes, and file stock. Although other paper forms are typically included in the “printing and writing” industry, such as book and magazine paper, junk mail, and brochures, they are not considered in this study. The scope of this study, as defined by the definition of “paperless office” provided above, encompasses only those paper forms (i.e. “office paper”) that offices have complete control over. As reported by this study, office paper generation has increased since 1960 by 6.15 million tons, or 404% [13]. A study conducted by the United States Environmental Protection Agency (EPA) on municipal solid waste generation (MSW) estimated that 7.67 million tons of office paper waste was produced in 1999 [14]. This estimate is up 404% from the amount generated in 1960. These numbers equate to an average of 56.25 pounds of office paper per person, of which 75% is generated in businesses and the remaining 25% is generated in homes. Office paper in the EPA study was defined as “high-grade papers such as copier paper, computer printout, stationary, etc.” Industry averages reported by Miller (2005) are even higher. Industry data suggests that 9.31 million tons of office paper waste were generated in 2000.
In 1999, the state of California commissioned the Integrated Waste Management Board (CIWMB) to also conduct a study of municipal solid waste generation [15]. According the state’s study, approximately 1.67 million tons of office paper was generated in California alone, as summarized in Table 1. The numbers generated by the state include “other office paper”, is defined as other kinds of paper used in offices, such as manila folders, manila envelopes, index cards, white envelopes, white window envelopes, notebook paper, ground wood computer paper, junk mail, and carbonless forms.
Table 1.
CIWMB Assessment of Office Paper Disposal in California [15]
Assuming the numbers estimated by CIWMB are comparable to those estimated by the EPA, office paper waste in California accounted for approximately 21.8% of all office paper waste in the United States in 1999.
Environmental Inventory Analysis – Paper
There are environmental impacts associated with all the lifecycle stages of paper. A typical paper lifecycle includes fiber acquisition, pulp and paper manufacturing, paper use, recycling and waste management (Figure 1) [11]. Figure 1 also includes the office equipment associated with the paper use phase. The environmental impacts of all stages of office paper, including fiber acquisition, bleaching, manufacturing, paper use, and disposal, are evaluated in the LCA presented in this study.
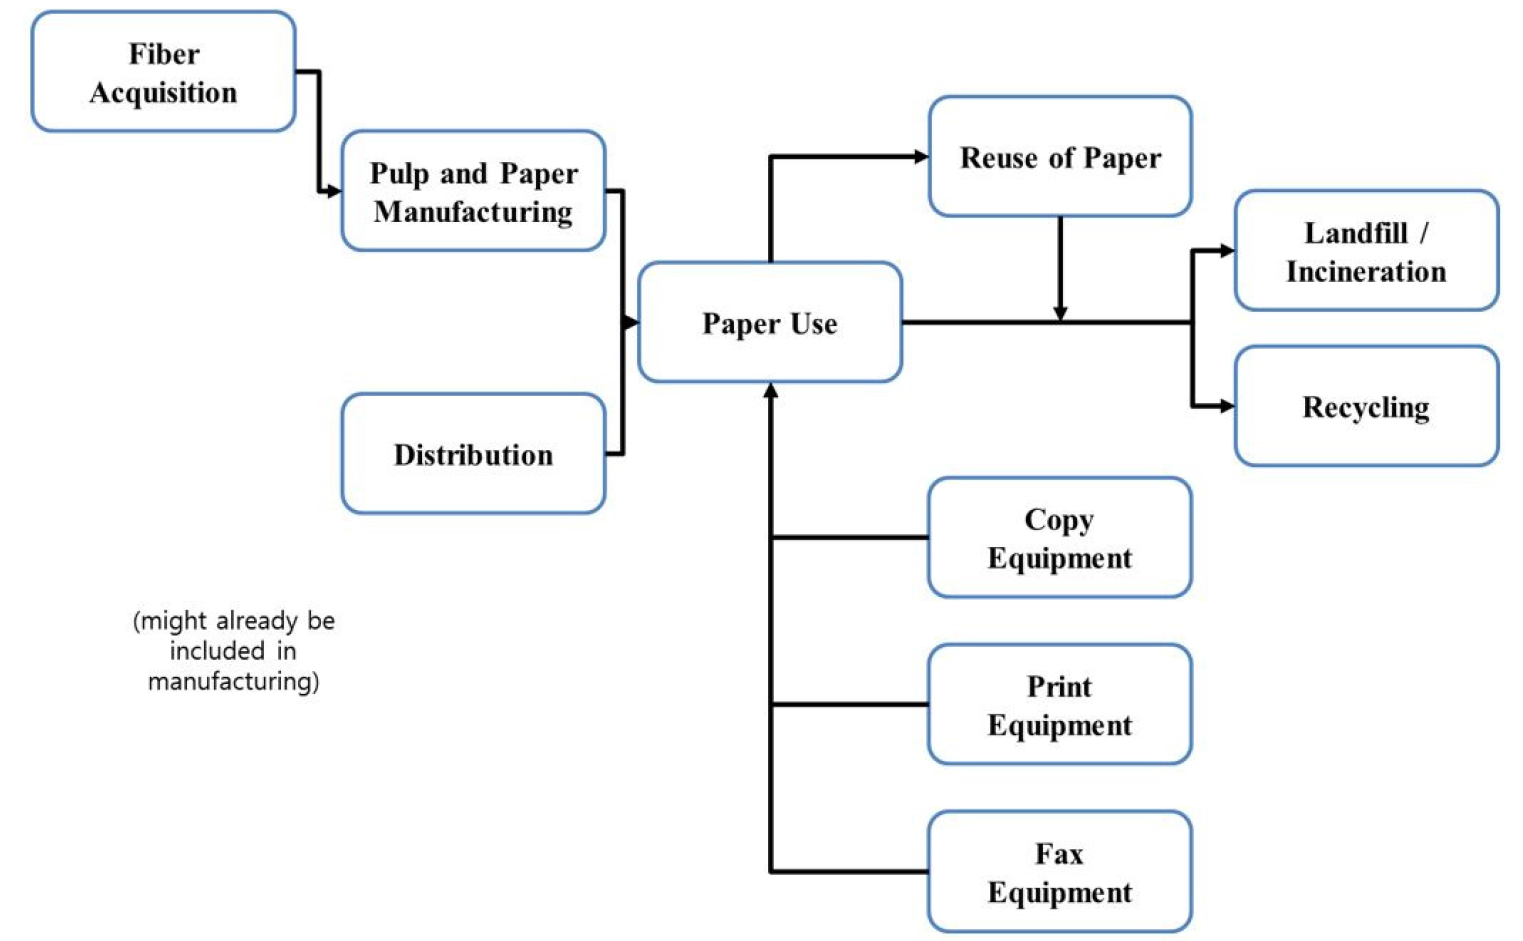
The paper life-cycle begins at the virgin fiber acquisition stage. No matter how much paper recycling is conducted, virgin fibers still need to be collected from trees. Pulpwood, or young trees, are the main source of cellulose fiber used in the creation of paper products. The supplier of pulpwood for paper production is the forestry industry. Similarly to agricultural crops, the raising of trees for paper production has environmental impacts. The PTF report points out that other agricultural crops can have much more substantial environmental impact, but nonetheless, the forestry industry does produce its share of environmental burdens.
Environmental impacts include depletion of soil nutrients, impairment of forest productivity, non-point source water pollution (e.g., nutrients such as nitrogen and phosphorous from pesticide use, sedimentation from soil erosion), and atmospheric emissions from the equipment use to harvest and transport the trees. Dependent on the size, location, and management of the forested land, environmental impacts can be as far reaching as to affect an entire watershed, potentially impacting wildlife habitat, entire ecosystems, recreational areas, and drinking water.
According to the PTF report, the pulp and paper manufacturing process is the most resource intensive process in the entire life-cycle of paper. During the pulp and paper manufacturing process virgin fibers, recovered waste paper, and other plants are transformed into paper. There are three basic steps in the process: (1) pulping the raw material into usable fibers; (2) bleaching/brightening of pulp; and (3) transforming of pulp to paper.
The overall manufacturing process uses large amounts of wood for fiber, chemicals, water, and energy. During chemical pulping the cellulose fibers collected from trees are separated from lignin, the organic compound that holds the cellulose fibers together. Cellulose can also be obtained from other plant sources, and from recycled paper. The other plant sources that contain cellulose used in paper production include flax, hemp, and a few other crops.
This chemical process for virgin fibers, plant fibers, and recycled fibers is chemically, energy, and water use intensive. Large amounts of chemicals such as caustic soda, chlorine-based chemicals, and oxygen-based based chemicals are added to solution to separate the fibers from the lignin in the case of the virgin fibers, and to clean paper fibers in the case of recycled paper. In addition, other coating and filling chemicals are added to the pulp to achieve the desired functional requirements of the final paper product. Water is used in every step of the manufacturing process. The PTF reported that 11,600 to 22,000 gallons of water, along with 31 million British thermal units (BTUs) of energy, are used to produce one ton of paper product. The end-of-life phase of paper is comprised of a combination of landfilling, incineration, and recycling.
Office Electronics
Although some LCA studies have been conducted on specific electronic components (e.g., computer tape drives [16] and microchips [17]), the scope of these assessments is limited in breadth and difficult to apply to the paperless office scenario considered in this report.
The EIO-LCA tool includes several sectors relevant to office equipment including [9]:
‧Electronic computers (Sector #510103),
‧Computer peripheral equipment (Sector #510104),
‧Telephone and telegraph apparatus (Sector #560300; fax machines),
‧Photographic equipment and supplies (Sector #630300; photocopy machines)
Additional sectors were identified as being relevant to equipment manufacture and use, but were not considered as part of the study. For example, the printing ink sector appears to be more relevant to the publishing industry than to computer printers, which are included in the computer peripherals sector. The office machines, not elsewhere classified sector includes such office machines as paper trimmers, staplers, pencil sharpeners, and binding machines. Although it is anticipated that the use of these types of machines would differ in the paper and paperless office scenarios, this study does not include an evaluation of these types of machines. The manufacturing of photocopy machines was modeled using the photograph equipment and supplies sector rather than the other business services sector, or the miscellaneous equipment rental and leasing sector, both of which included photocopy service in their sector definitions.
Environmental Inventory Analysis – Office Equipment
Different types of office equipment were assumed to be used under the paper office, 50%, and 100% paperless office scenarios, as described previously. The life-cycle stages important for office equipment include resource acquisition, manufacturing, use, and disposal. Recognizing that certain electronic devices will continue to be used in both the paper and paperless scenarios (i.e., printers for final copies, large-format plotters, etc.), the ancillary office equipment accounted for in this report only cover what will be eliminated in the paperless scenario. In other words, those pieces of equipment that exist in both the paper and paperless scenario and whose use are similar in both the paper and paperless scenario are not evaluated here. For example, large-format plotters are not included in this study.
Electricity Use
During the use-phase of electronic office equipment, various types of equipment require different energy input. Electricity requirements for various types of office equipment were evaluated by the Department of Energy (DOE) [18]. The EIO-LCA tool includes the electric services sector (Sector #680100), which was used to evaluate the environmental impacts of energy consumption during machine use phase, as described previously.
Approach
Based on a thorough background search of previous LCA assessments of office paper and office equipment associated with paper (i.e., computers, printers, etc.), this study uses a hybrid LCA (process-based LCA + EIO-LCA) approach to evaluate environmental impacts. The environmental impacts of paper use only were evaluated using a process-based LCA. Due to the lack of process-based LCAs on office equipment, EIO-LCA was used to evaluate the environmental impacts of equipment use. This describes the functional unit, assumptions, and approach used to conduct an LCA for each of three office scenarios.
Functional Unit
In order to evaluate the difference between a paper office scenario and a paperless office scenario, we conducted a case study on a medium sized office located in CA, USA. We sent a survey regarding paper-use and computer use to the office employees, as well as the facilities coordinator of the office building. Based on the results of the survey, we developed a baseline paper-office scenario. In order to have a comparable paperless-office scenario, we then modeled a paperless office scenario based on the current needs of the surveyed office. The functional unit considered in this study is the paper and/or electronic equipment used by this 150-person office for a period of one year.
Scenario Definitions
Three scenarios were considered – the paper office, the 50% paper (or 50% paperless) office, and the 100% paperless office. It will be almost impossible to eliminate all paper use within an office. In addition, an office cannot eliminate all paper that it receives from outside sources (i.e. brochures, reports, etc.). This type of paper use will not be included in the assessment of the paper office, and therefore does not represent a changed condition between the two scenarios. In acknowledgement of this fact we have included one high volume scanner for digitizing outside information in the paperless scenario, as described below. However, an office can regulate how much paper it uses. A more realistic view of a paperless office would be one in which all forms of internal paper documentation are eliminated. For our study we considered best and worst case scenario of paper consumption. In the best case all paper is eliminated, in the worst case 50% of paper use is eliminated.
The paperless office used in our study is based on existing technology and hardware. Logical assumptions were made as to what equipment would be used in the 50% and 100% paperless scenarios. We presume that the paper office was pre-wired with a Local Area Network (LAN). Therefore, these components are included in both the paper and paperless offices, and are therefore not analyzed in this study. Other equipment that is common to all three scenarios, like large-format plotters, are also not considered.
The scenarios used in this study are further defined in the followings:
Paper Office
The paper office represents current conditions of paper use in a “typical” office setting. The paper office includes ancillary office equipment that is associated with paper use (i.e., printers, copiers, fax machines) that would not be present in the paperless office. In addition, the paper office includes desktop computers and cathode ray tube (CRT) monitors that are replaced with newer computer technology in the paperless office. Therefore, the environmental impacts of this office equipment in all life-cycle stages including resource acquisition, manufacturing, use, and disposal, are considered in the analysis of the paper-office.
LCA Methodology
Paper Office LCA
As mentioned above, the paper scenario was evaluated using a hybrid LCA approach. The environmental impacts of paper were evaluated using the PTF, while the environmental impacts of electronic equipment manufacturing and use was evaluated using EIO-LCA. The PTF results [11] were used to evaluate the environmental impacts of office paper use throughout the entire lifecycle of paper, from manufacturing to end-of-life (fiber acquisition to recycling and waste management). The web-based paper calculator [12], which was developed based on the findings of the EDF, was used to determine the environmental impacts of office paper use. According to the paper calculator, office paper constitutes “paper typically used in an office, such as copier paper, letterhead, envelopes, and forms”. As discussed previously, office paper for this study is defined as all forms of paper that an office has complete control over. More specifically, the types of paper accounted for in our office case study include copy paper (8.5’x11x and 11’x17’), note pads, graphing paper pads, envelopes, and folders. All of these types of paper are assumed to be accounted for in the “office paper” category in the paper calculator.
Based on the survey results, the mass of total paper consumed per year by the case study office, as well as the cost of the paper, were estimated. The mass of office paper consumed per year was input into the Paper Calculator to determine the environmental impact. The environmental impacts were then divided by the cost of paper to generate results based on a unit per $1. Environmental impacts measured by the paper calculator include energy usage, atmospheric emissions, solid wastes, waterborne wastes, water use, and wood use.
Tissue and toweling products, which are also types of paper used in an office are not covered in his assessment, and are not accounted for by the paper calculator of the PTF. According to the PTF report, “60% of the U.S. tissue market is in the residential sector and therefore outside the Task Force’s primary emphasis on commercial paper use” [11]. In addition, these types of paper products often contain up to 100% recycled material. Therefore, their environmental impacts are can be considered negligible in comparison to office paper use for our case study. In addition, a comparison study was made using the EIO-LCA sectors related to paper manufacturing to evaluate the appropriateness of combining PTF and EIO-LCA data
EIO-LCA was used to evaluate the environmental impacts of the manufacturing (including the supply chain) and use phases of equipment, based on the amount of electricity consumed by electronic equipment in the paper office. Because the end-of-life phase cannot be evaluated through EIO-LCA, and no other publicly available information exists for the types of equipment evaluated in this study, end-of-life environmental impacts for equipment were not evaluated as part of this assessment.
As previously stated, the major office equipment not accounted for in this assessment include CAD-plotters. It was assumed that the large format printing required for design jobs used at the case study office were not replaceable by electronic equipment. Those design sheets that can be printed on typical copy paper (8.5’x11’, or 11’x17’), however, were assumed to be replaceable by electronic equipment.
50% Paper/Paperless Office LCA
The 50% scenario was also analyzed using a hybrid approach. The environmental impacts of paper use were estimated using both the web-based paper calculator, while the environmental impacts of electronic equipment was estimated using EIO-LCA. In the 50% Paperless, scenario paper use across all categories is decreased by half. This is accomplished by equipping two thirds of the office workers with a tablet notebook and Liquid Crystal Display (LCD) monitor as replacements for the desktop personal computer and CRT monitors used in the standard paper study. Other peripheral pieces of paper using hardware, such as facsimile machines and photocopy machines, are decreased by half as well.
100% Paperless Office
The 100% paperless office scenario was evaluated using EIO-LCA, which accounts for the manufacturing (including the supply chain) and use phase of equipment. As with electronic devices in the paper office, the end-of-life phase was not evaluated. In the 100% paperless scenario all paper use and paper using hardware is eliminated. It is assumed that the conversion to paperless will require a minimum of physical alteration to the office. In this scenario, desktop computers are eliminated and every employee is instead equipped with the notebook tablet and LCD monitor. In addition, the office is equipped with one shared high volume scanner. Approximations were also made regarding the total information volume increase related to data storage. The new equipment and data storage requirements for the paperless office include:
Tablet Computer - Each employee must be given the means of manipulating digital documents as they would a paper document. This can be achieved with tablet computers, which use a “paper metaphor” for the user interface. Two types of tablets are available. The simplest is a called a “slate” and consists of a read/write screen. Expanding the capabilities of the slate, the second option is the “tablet notebook”, which functions as a normal laptop with keyboard, but can be inverted to write on the screen. In this study, it is presumed that all employees use the tablet notebook type of computer. Tablet notebooks in this study used Pentium M Centrino, 1.8 GHz processors, with 12.1 TFT screens and have 60 GB hard drives. The tablet computers will be run actively for seven hours and spend one hour in stand-by per day.
New Monitors - New monitors are necessary for coupling with the tablet laptops. By extending the virtual desktop onto the external monitor, employees will be able to organize and edit “stacks” of documents much like they would do with paper on a real desktop. Each employee with a tablet notebook will also use one 19” LCD monitor with 1280 x 1024 resolution. The LCD monitors are assumed to running actively eight hours per day.
Scanner – The paperless office will share one high volume scanner for digitizing information. This item is necessary since the majority of the world still uses the paper medium. It is estimated that the scanner will be able to scan documents up to 11 x 17 inches at a rate of over 60 pages per minute. The scanner is estimated to be in active in use 2-6 hours per day.
Data Storage Equipment – The amount of extra electronic data generated by the paperless office was estimated utilizing an information per unit weight of paper conversion factor used in the How Much Information Project [19]. It was estimated that only 150 GB of extra data would be generated by the 100% paperless office. Thus it was considered that no additional memory storage beyond that provided by the hard drives of the new tablet computers would be necessary.
Results and Discussion
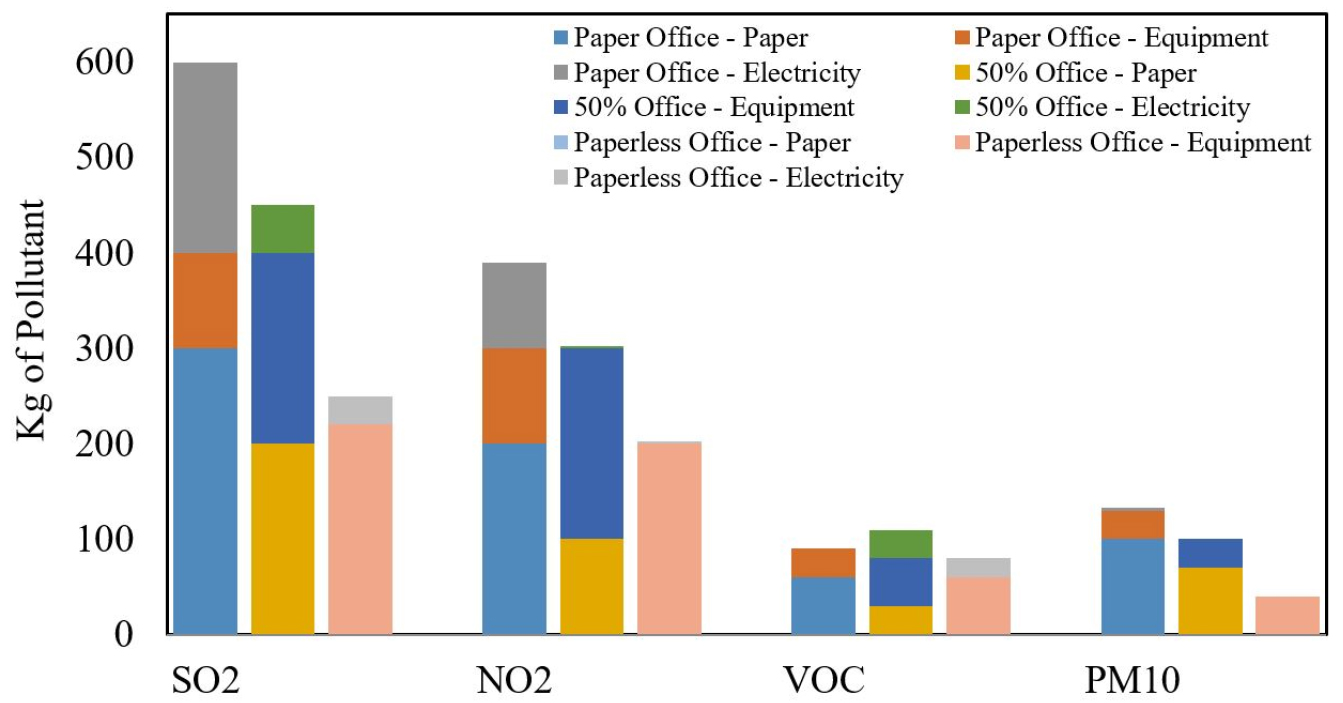
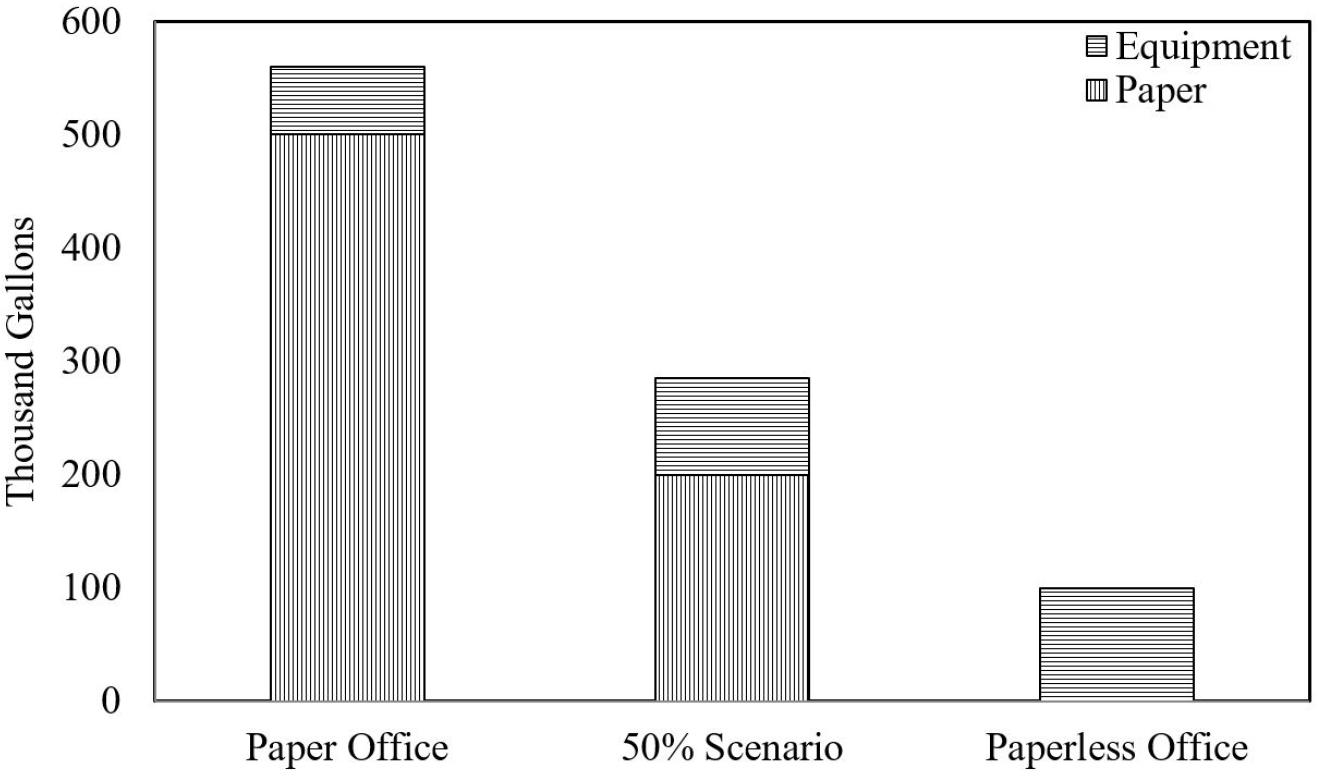
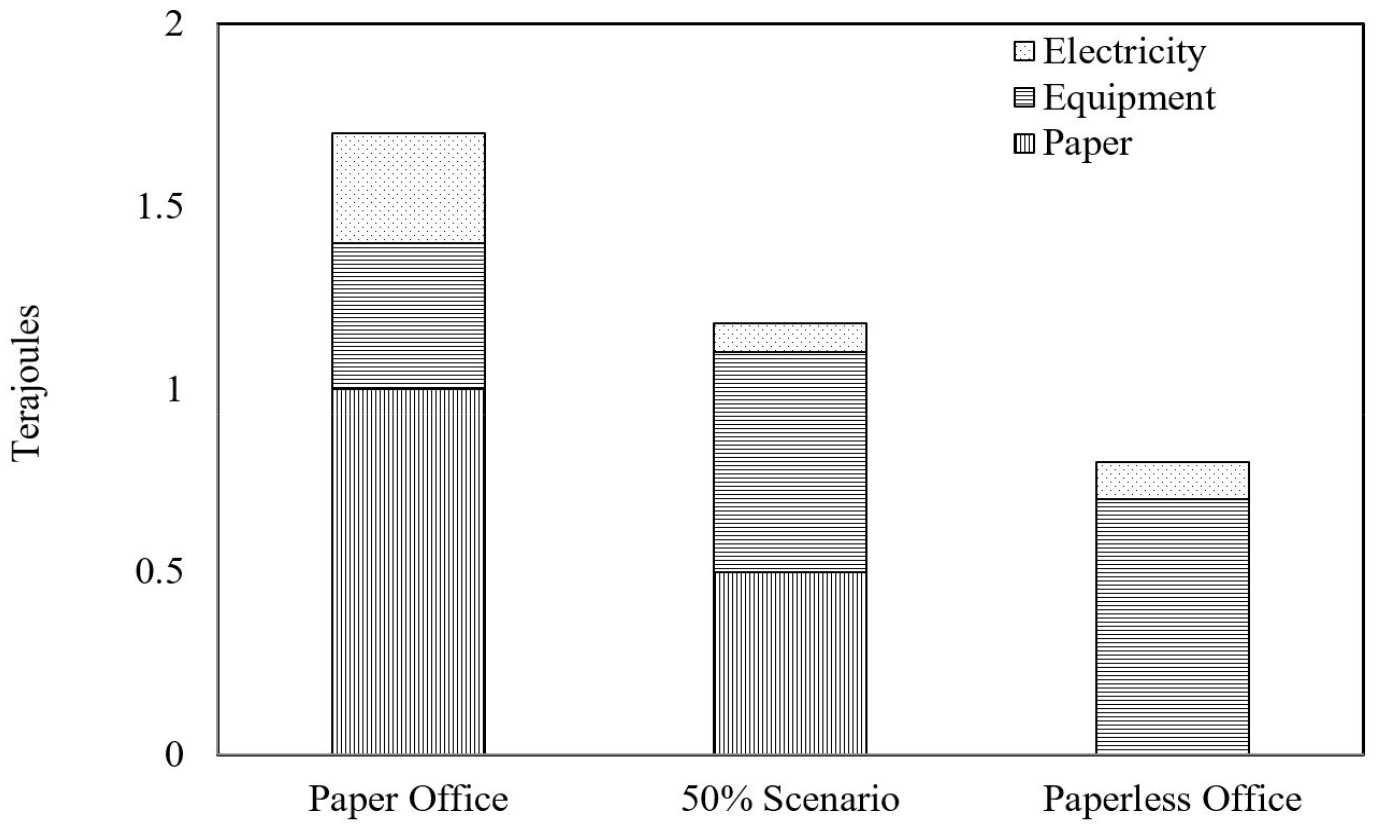
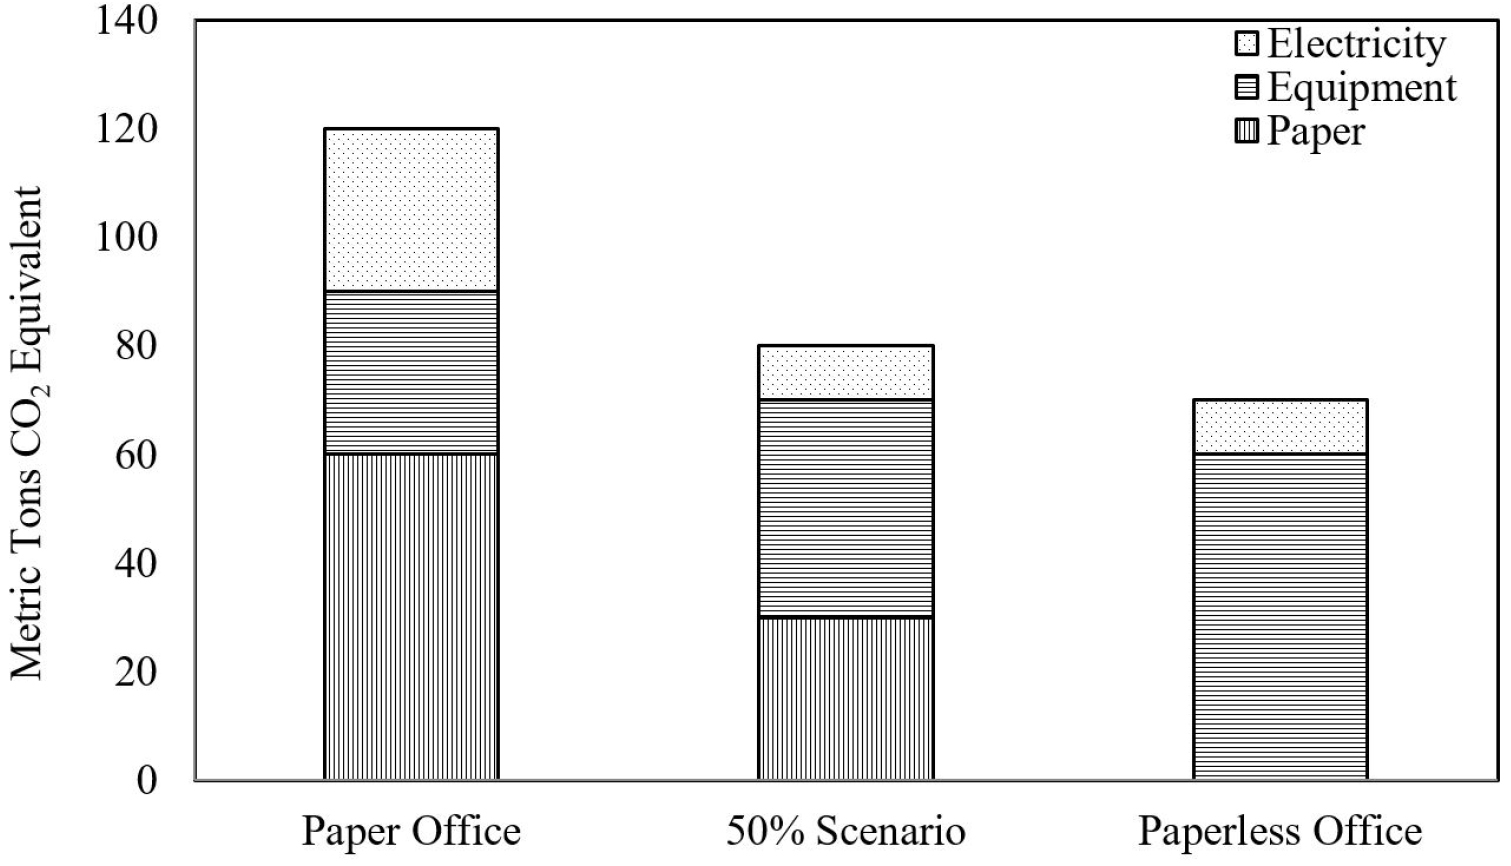
This study presented selected environmental inputs (water use, total energy use) and outputs (global warming potential and four criteria pollutant emissions) for each of the three office scenarios. These figures illustrate which life-cycle phase is responsible for the inputs and outputs considered.
As shown in the figures, there is a general trend toward lower impact in the paperless office compared to both the 50% and paper offices for each of the environmental inputs and outputs considered except for volatile organic compounds (VOCs). The environmental inputs and outputs associated with paper dominate other life-cycle phases studied (equipment manufacturing and electricity use). Although the relative contribution from equipment manufacturing is larger in the 50% and paperless scenarios, it does not increase by enough to compensate for the lower quantities of paper used.
It may seem counterintuitive that the paper office would use more electricity than either the 50% or paperless office scenarios. However, photocopy machines, which are reduced in the 50% scenario and eliminated in the paperless scenario) are relatively more energy intensive than other office equipment. In addition, by replacing older CRT monitors with more energy efficient LCD screens, and desktop computers with tablet notebooks, the paperless office electronic equipment generally uses less electricity than the paper office equipment.
As shown in Figure 2, VOCs do not follow the general trend noted above. This result is likely due to the relatively low emissions of VOCs in all three scenarios. These results indicate that technologies that can eliminate or reduce the need for paper can be more environmentally friendly than paper use. However, it should be noted that no order of magnitude difference was observed for any of the inputs or pollutants shown in Figure 2, 3, 4, 5. If companies were to allow knowledgeable and willing employees to phase in the use of paperless equipment in a responsible manner, it is estimated that emissions of greenhouse gasses would be cut by approximately one-half, resulting in a savings of 50 metric tons of CO2 equivalent. In addition, water use would be cut by approximately 500 gallons.
In this study, several assumptions were made in performing this analysis. As such, there are many sources of uncertainty in the estimates presented in this report, as outlined in the following sections.
Paper Manufacturing, Use, and Disposal
It is important to note that the paper calculator [12] does not go into detail about what exact percentage of paper waste is landfilled, incinerated, or recycled. However, the calculations are based on a national average. It is also important to note that the EDF study characterizes the impacts of “typical” activities at average facilities. The practices of specific and individual facilities involved in each life-cycle stage may differ from the average. However, for the purposes of this assessment, a comparison of averages is considered to be appropriate. In addition, it is unclear whether the EDF assessed the environmental impact of the transportation of paper products from the manufacturing site to the warehouse to the office.
Equipment Manufacturing
The largest uncertainty related to equipment manufacturing stems from the level of aggregation present in EIO-LCA. All computer peripheral equipment, including monitors, printers, keyboards, and mice, are included in one economic sector. In addition, desktop computers, laptop computers, and tablet notebooks are also aggregated into one sector. Because tablet notebooks are a relatively new technology, modeling their manufacture with 1997 economic sector data may not be truly representative.
Equipment (Electricity) Use
There is uncertainty related to the precise amount of electricity used by electronic devices, especially if a device goes into a hibernation mode after periods of inactivity. As previously described, it was assumed that all equipment was in use for an 8-hour work day. Assumptions were also made regarding the distribution of time spent in active and hibernation modes. Therefore, if an office has a very different equipment use pattern than the one represented in this study, these results may not be applicable.
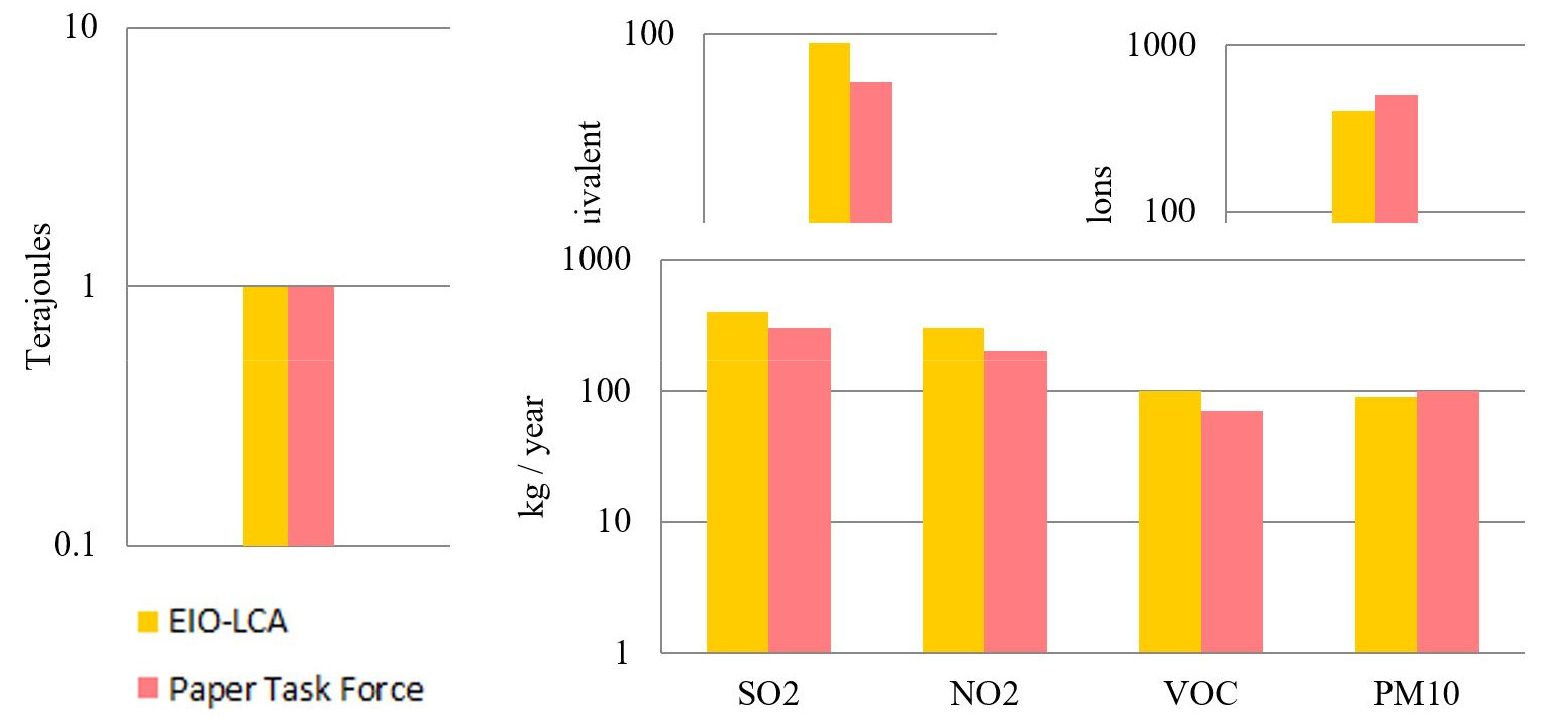
As described, an evaluation was conducted to determine if paper use modeled using the EIO-LCA paper mill sector resulted in similar environmental output to the PTF study. It should be noted that while the PTF includes end-of-life considerations, EIO-LCA only considers paper manufacturing. On the other hand, it is assumed that EIO-LCA accounts for more supply chain impacts associated with paper manufacturing than does the PTF. In general, the PTF and EIO-LCA results were very similar for the environmental inputs and outputs. The comparisons are illustrated in Figure 6. There was no order-of-magnitude difference found for any results compared.
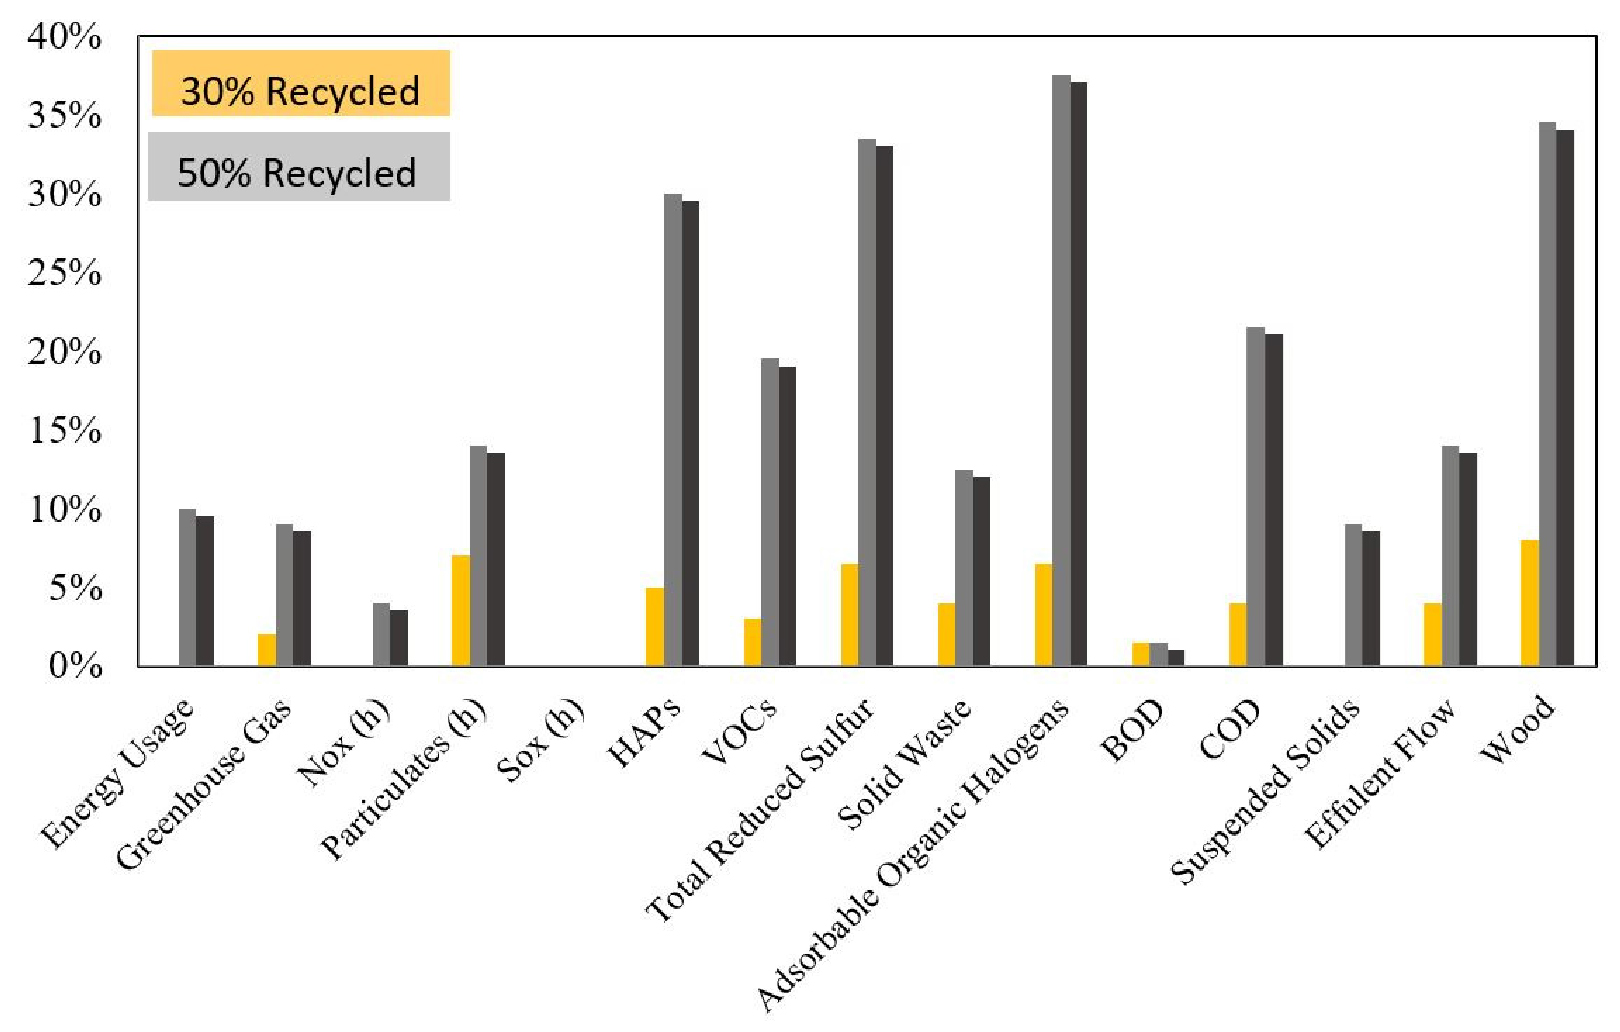
The web-based paper calculator was also used to vary the post-consumer recycled paper content of the paper supply. As shown in Figure 7, some inputs, including water use and electricity use, were not highly sensitive to this change. However, some emissions, including absorbable organic halogens, can be reduced by up to 35% by doubling the recycled content from 25% to 50%.
Other sensitivity analyses that were considered included:
Electricity use of equipment
Because the electricity use phase accounted for a relatively small portion of environmental impact, changes in the assumed electricity use of certain types of equipment did not significantly impact the results of this study (data not shown; available upon request).
Cost of equipment
Average costs for computers and other equipment were assumed. Because tablet notebooks are more expensive than desktop computers, the sensitivity to modifying equipment price can be seen by evaluating the EIO-LCA output for the paper, 50%, and paperless scenarios for the computer and computer peripherals sectors.
Amount of paper used
The paper and 50% scenarios illustrate the sensitivity to changes in assumptions regarding the quantity of paper used.
Obsolescence/life of equipment
As stated previously, a three-year life was assumed for all equipment. If the equipment lifetime were increased, the paperless office would score even more favorably compared to the paper office.
Conclusion
Recently, large portions of paper documentation have been replaced by digital documents through the pursuit of the paperless office, which can contribute to sustainable development as good environmental practice. This study evaluates the environmental benefit of substituting new technology for existing practices (i.e., paper use) using LCA methodology with inventory analysis (inputs and outputs), impact assessment (what are the consequences of these inputs and outputs, for example on human health), and interpretation. By completing and comparing LCAs of all scenarios, this study attempts to understand if changing an office from using paper to being paperless will offer any environmental benefit.
Although a completely paperless office may never become a reality, it is evident that a shift in technology is occurring, and the technology does exist to reduce dependence upon paper use. Companies should allow knowledgeable and willing employees to phase in the use of paperless equipment in a responsible manner, because a responsible paperless office can be more environmentally friendly than the paper office alternative.
There are several interesting aspects of the transformation to a paperless office that were not considered within the scope of this assessment. Further studies on this topic are recommended, including:
‧ Psychology of paper – employees may be unwilling to give up paper use
‧ Healthcare costs associated with electronics use (e.g., eye strain)
‧ Alternative visions of the paperless office
‧ How the transformation to a paperless office could occur; how to make it user friendly
‧ How the transformation would affect different types of workers
‧ What to do with old paper to be disposed
‧ Office space use change (e.g., filing cabinets, copiers, etc.)
‧ Security risks – data loss
‧ New technology enabling more, rather than encouraging less, paper use
