

Introduction
Related Study
Materials and Techniques
Dataset Specifications
Data Preprocessing
Models Used
Experimental Setup
Findings and Analysis
Results for oil spill classification using CNN
Results for oil spill classification using CNN with self-attention mechanism
Conclusion
Introduction
The environmental impact of oil spills is substantial, affecting marine ecosystems, coastal communities, and economies worldwide. The area of Artificial Intelligence (AI) has been greatly affected by Deep Learning (DL), achieving remarkable results in numerous applications and demonstrating a high level of skill in handling large datasets and complex computations [1, 2, 3]. Recent advancements in automated learning, specifically through the application of Convolutional Neural Networks (CNNs) and self-attention mechanisms, have provided new paths to improve the efficiency and precision of oil spill classification. [4] have highlighted the potential of the efficient attention of the channel to enhance CNN, suggesting that incorporating the attention layers can improve the attention of the model on critical characteristics by reducing noise interference. This merger approach aims to use the strengths of both methodologies, leading to better detection and classification of oil spills. The advancement of DL designs has led to significant improvements, enhanced the efficiency of the model, and widened the scope of DL applications [5, 6, 7, 8].
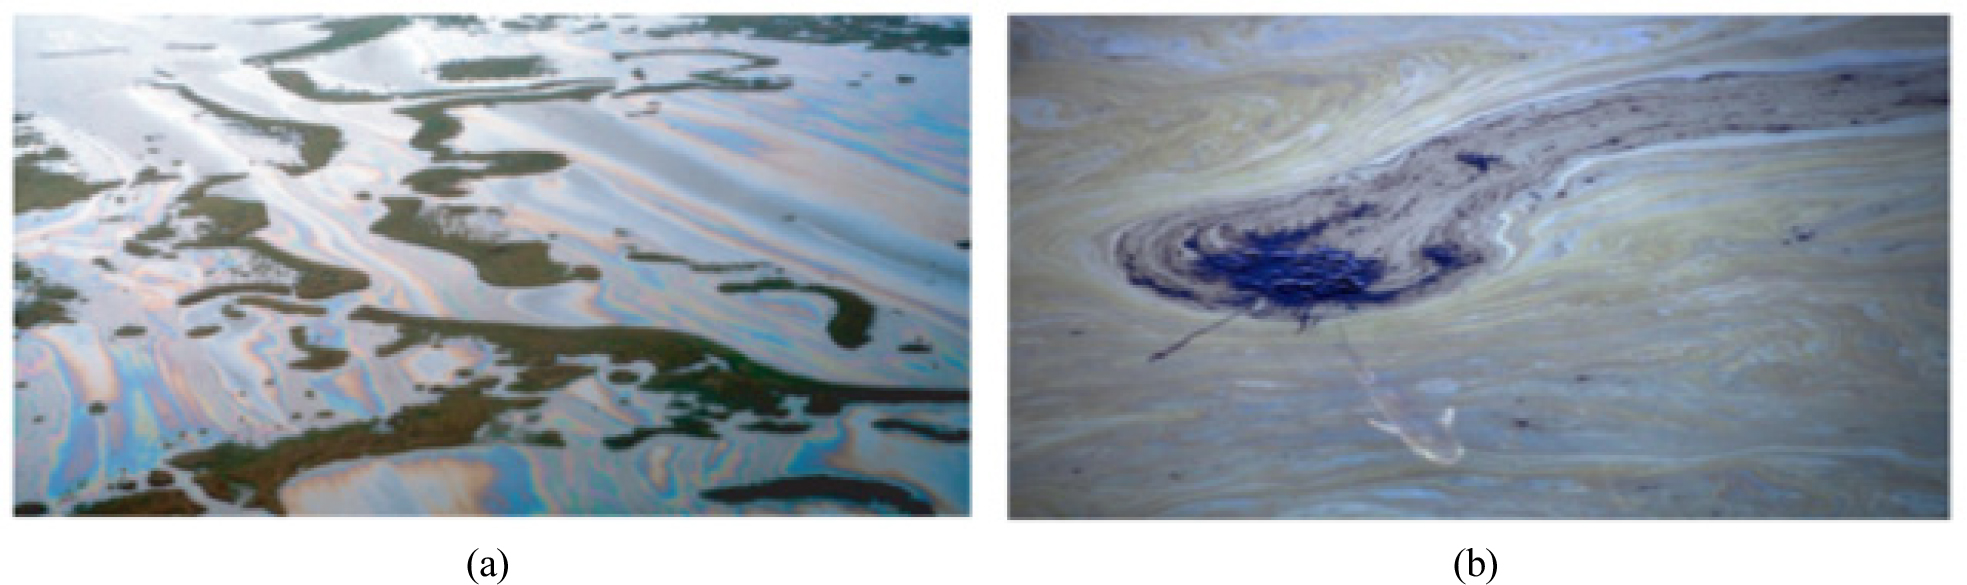
DL is a significant area within machine learning and has demonstrated effectiveness in image classification tasks [9]. CNNs are a kind of DL architecture that can do a better job of analysing images because they can automatically extract complicated characteristics from raw image data [10, 11, 12, 13]. Attention mechanisms are designed for specific use cases, such as sequence-based tasks, such as Natural Language Processing (NLP), and scaled dot-product attention. There are various types of attention mechanisms, like Self-attention or intra-attention. It is used in sequences, allowing models to assess the significance of each component. The Scaled dot-product attention is a key component of transformer architecture, calculating attention scores by computing the dot product between a query vector and keys, followed by scaling and the application of a softmax function. Finally, multi-head attention allows models to concentrate on various parts of the input. concurrently, enhancing their potential to identify intricate connections in data. Location-based attention is often used in image-related tasks, assigning attention scores according to the element’s spatial locations. In this paper, a self-attention mechanism is integrated with CNN to improve its performance in classifying oil spill is there or not. Figure 1 depicts the visual distinctions between an oil slick (b) and an oil spill (a) on water surfaces.
According to [14], the main methods for removing spilled oil are managed combustion, excavation, dispersal agents, oil barriers, skimming devices, and vacuum methods. Sorption on sorbents for spill clean-up is also frequently employed. Many of these oil spill remediation techniques may be expensive, both for initial implementation and ongoing operational costs. The cost fluctuates based on the spill’s magnitude, location, and environmental consequences; nonetheless, extensive spill remediation often necessitates considerable resources.
The creation of commercially feasible substitute methods to eliminate potentially hazardous substances and soluble petroleum derivatives from water polluted by oil is imperative due to the growing environmental consciousness and legal restrictions placed on oil spills. The evolution of non-traditional materials, such as agricultural by-products, for oil spill remediation has received a lot of interest. This is due to their widespread accessibility, affordability, environmental friendliness, and high absorption capacity, as they contain functional groups capable of binding metals [15].
A literature review reveals that there is a lack of knowledge about the soluble petroleum fractions and potentially hazardous components that agricultural wastes remove from oil-spilled water. Therefore, research in this area is essential. Traditional methods for detecting oil spills, including visual observation, aerial surveillance, satellite imagery, and shoreline assessments, are limited. Synthetic Aperture Radar (SAR), multispectral imaging, and other remote sensing technologies, hyperspectral sensors, and unmanned aerial vehicles have transformative potential for detecting and monitoring oil spills. Sensor networks and autonomous systems, such as buoy networks, underwater drones, and autonomous surface vessels, are emerging as game-changers in real-time monitoring and rapid response.
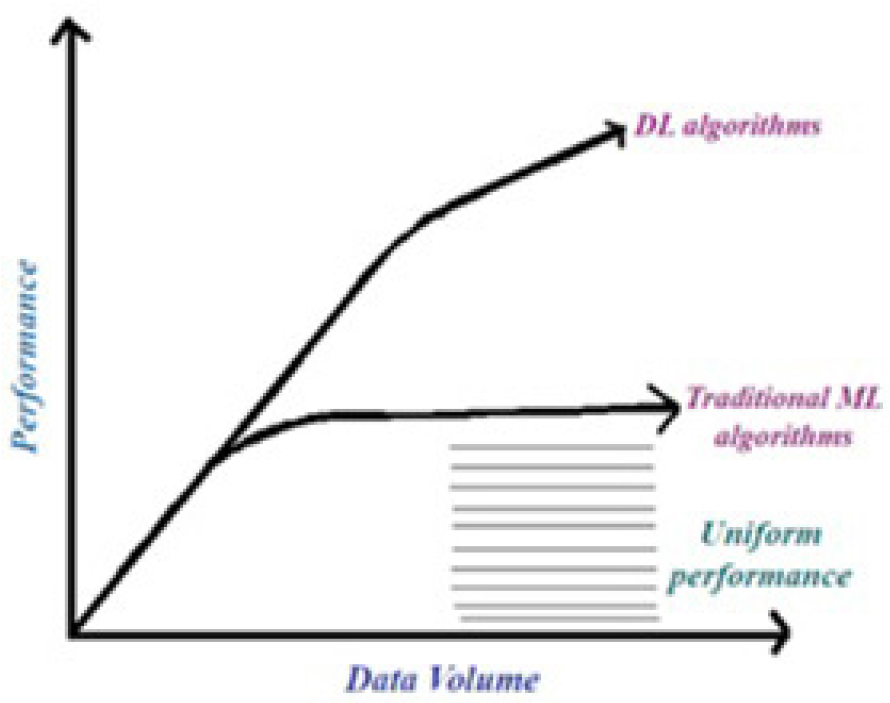
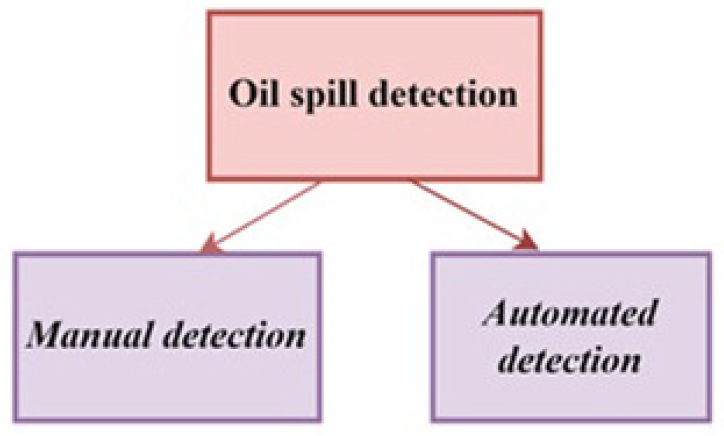
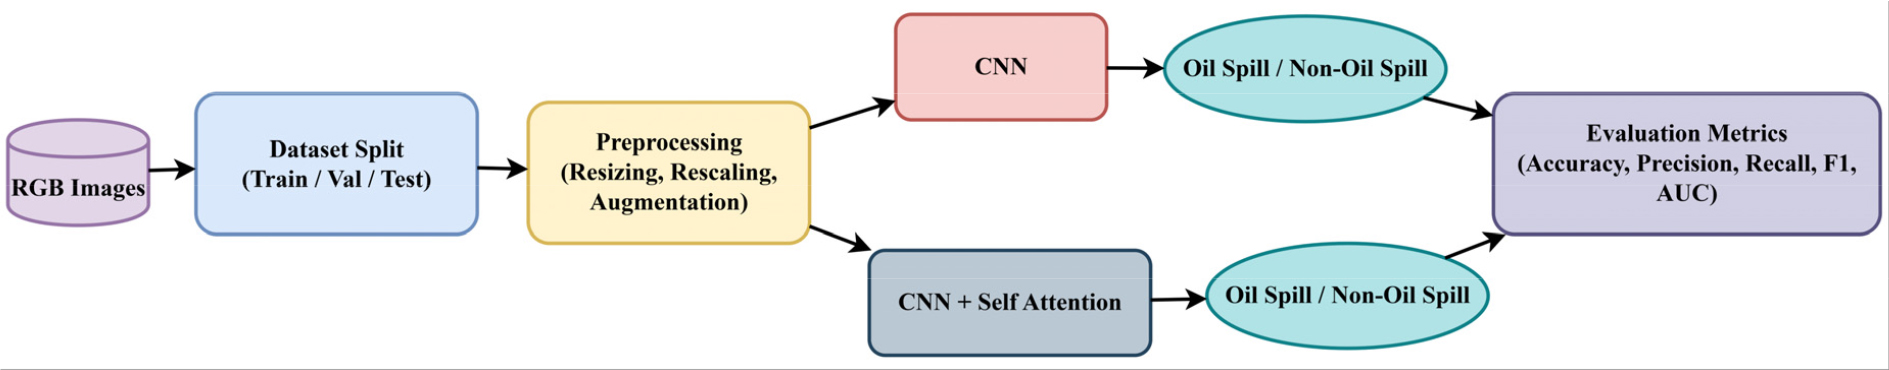
DL algorithms can give superior performance than traditional ones. It is depicted in Figure 2 above. Also capable of handling large amounts of data. Oil spills can be classified and detected in two ways, as shown in Figure 3.
The area of DL has been largely influenced by several important architectures that have defined its progress. The fundamental structures of CNNs and Recurrent Neural Networks (RNNs) have completely changed how neural networks process information [17]. These DL models have demonstrated efficacy in automating classification tasks, increasing accuracy, and decreasing dependence on manual
labor, especially CNNs enhanced with attention mechanisms [18]. Automated detection is done by using robust models such as CNNs to accurately identify oil spills in aerial imagery. These models autonomously acquire intricate properties inside imagery, differentiating oil spills from similar appearances and non-oil regions. Model performance is improved by the use of techniques like data augmentation and transfer learning, even with constrained datasets.
From the epoch-making CNN [19] to Deep Belief Networks (DBNs) [20] and various effective and remarkable NN structures [21, 22, 23, 24, 25, 26, 27], DL has unquestionably become the norm of machine learning (ML) today and has demonstrated extraordinary accomplishment in areas including Voice Recognition (VR), NLP, and Computer Vision (CV). Training large and complex Deep Neural Network (DNN) models is still a major problem, sometimes requiring much computer power and careful hyper parameter tweaking [28].
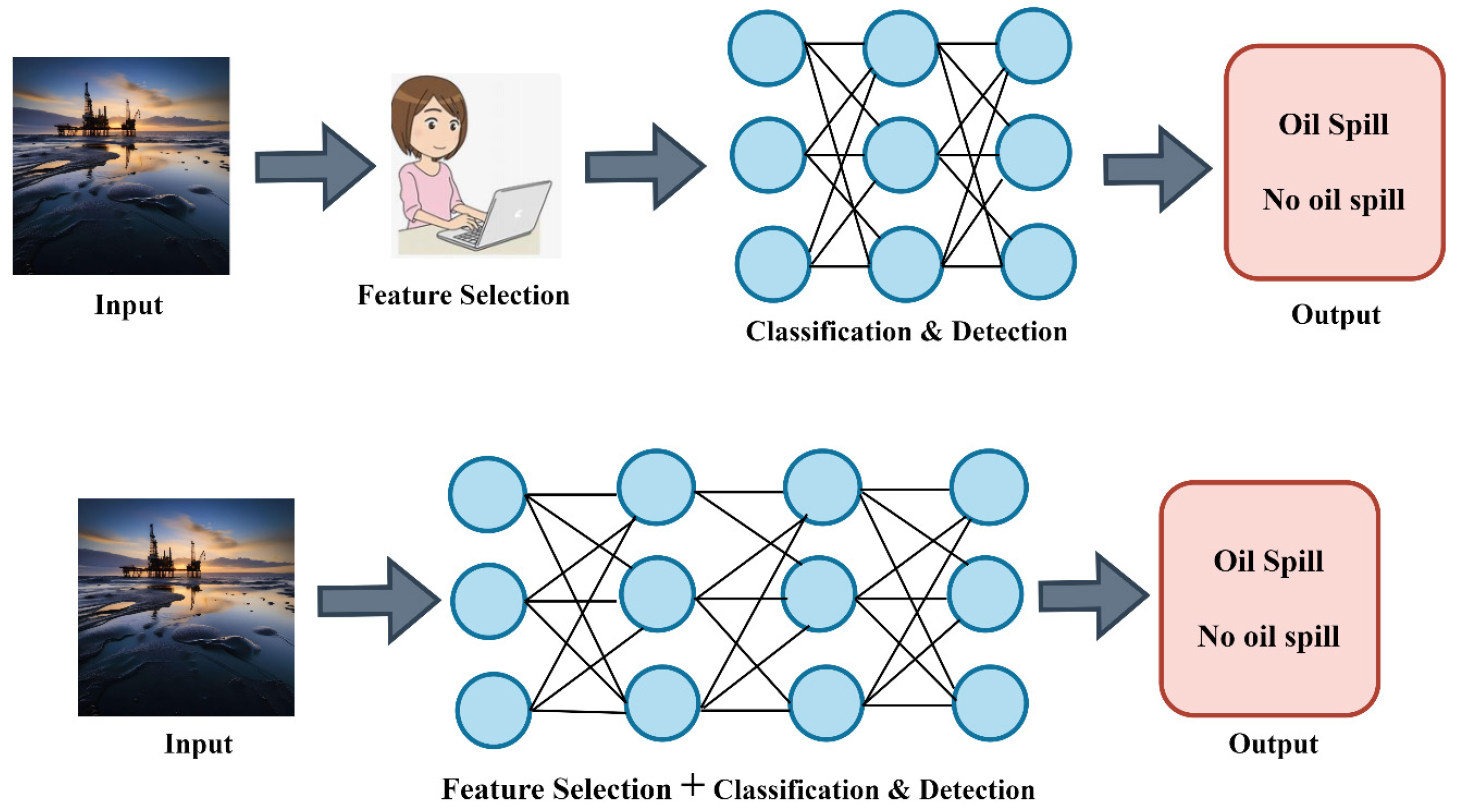
Traditional ML separates feature selection and categorization, which is sometimes done manually. This approach may struggle to detect detailed patterns in complex datasets, but it is computationally efficient. DL, on the other hand, combines feature extraction and classification into a single model, much like a DNN. This technique lowers the need for human feature engineering, but it needs significant computing resources and bigger datasets for best performance. Figure 4 depicts the traditional ML and DL, whereas Figure 5 represents a Foundational neural network and DNN.
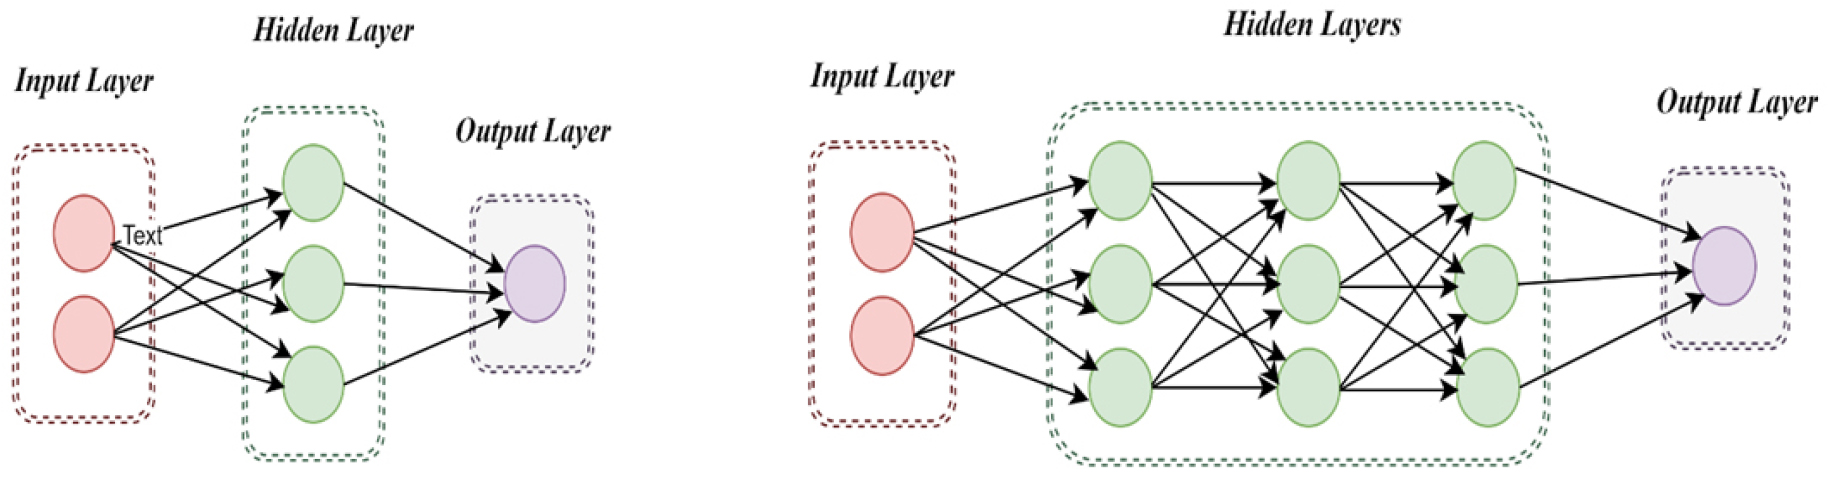
Foundational neural networks have one hidden layer for basic tasks, while DNNs have multiple layers for complex tasks, requiring more processing resources and training data for better performance. Accelerating DL models compensates for physical limitations in training and inference, allowing output to be derived in real time. A lightweight model, with fewer layers and fewer parameters, can reduce inference time and be used in real life [29]. A smart and sustainable city is a healthy urban area integrating sustainable economic, societal, environmental, and governance practices, aiming for positive outcomes for all [30, 31, 32, 33, 34, 35, 36].
Motivation
Oil spills cause catastrophic environmental and economic harm and seriously threaten marine life, ecosystems, and coastal areas.
•Accurately classifying oil spills, whether occurred or not, is essential to mitigating these impacts.
•Developments in ML, DL, and image processing provide promising approaches to enhance the precision and effectiveness of oil spill categorization.
•This effort is essential for protecting the environment, developing sensible policies, and minimizing financial losses for a sustainable environment.
•Our goal is to provide a CNN model with and without an attention mechanism (self-attention) for oil spill classification.
Contribution
The novelty of this study, in the incorporation of self-attention mechanisms within a CNN architecture, aimed at improving the extraction of spatially relevant features in RGB oil spill images. The proposed method is assessed through a collection of images depicting oil spills alongside those of non-oil spills sourced from various origins. This increases the likelihood of effective functioning in various contexts. This differs significantly from the CNN-based solutions that have existed for quite some time. The study highlights the importance of interpretability by presenting various performance metrics, which aid in understanding the model’s operation. The design emphasizes computational efficiency, making it highly suitable for extensive monitoring applications. This study presents a reliable DL approach that aids in environmental conservation through the swift and precise classification of oil spills.
•Developed a convolutional neural network architecture incorporating self-attention mechanisms to emphasize spatially significant features in RGB images of oil spills.
•Validates using a multi-source dataset comprising real-world RGB images of oil and non-oil spills.
•Facilitates the interpretation of model decisions by visualizing various performance metrics.
•Implemented a design focused on efficiency.
•Facilitates ecological protection via this dependable solution.
The manuscript comprises six sections: Introduction, Related Work, Materials and Methods, Experimental Setup, Findings and Analysis, and Conclusion & further research. The introduction outlines the research problem, highlighting its significance and objectives. The related work section reviews existing literature and previous studies. The Materials and Techniques section details the experimental design, data collection procedures, and analytical techniques employed. The Findings and Analysis section outlines the findings and their implications, whereas the conclusion emphasizes the contributions to the field and future research.
Abbreviations
DL Deep Learning
ML Machine Learning
CNNs Convolutional Neural Network
RNNs Recurrent Neural Networks
RGB Red Green Blue
ANN Artificial Neural Network
NLP Natural Language Processing
SVM Support Vector Machine
AI Artificial Intelligence
CV Computer Vision
VR Voice Recognition
DNN Deep Neural Network
BCEL Binary Cross-Entropy Loss
DBN Deep Belief Network
SAR Synthetic Aperture Radar
EDA Exploratory Data Analysis
TPU Tensor Processing Unit
ReLU Rectified Linear Unit
ROC-AUC Receiver Operating Characteristic - Area Under the Curve
Related Study
Transfer CNN rose to popularity because of its capacity to automatically learn the hierarchical characteristics of the images, which is fundamental for tasks such as the detection of oil spills, where variations in size, shape, and color prevail. However, while CNNs stand out in the extraction of spatial characteristics, they often struggle to capture long-range units within the data. This is where the self-locking mechanisms come into play. Self-acting enables models to assess the significance of various components of the supplied data dynamically, which leads to richer representations. A study in [4] proposed a network designed for the extraction of features across multiple levels in both spatial and spectral domains, using graph convolutional and attentional neural network models for different spaces. An approach to merging features at many levels is created to fuse these features, obtaining multilevel features for oil spill information. The method enhances the accuracy of determining the kind of oil and classifying film thickness.
This study [31] uses a large, well-selected, worldwide historical dataset of Sentinel-1 SAR imagery, publicly available, to test an empirical way and a DL model to distinguish oil-like features from lookalikes in marine park scenes. The classifiers work better together with an accuracy greater than 98% and a false positive rate of 0.01 rather than independently. This study [32] employs the complex CNN framework for classifying marine oil spills. The marine oil spill classification performance is analyzed for various polarization modes for three classes: biogenic oil, crude oil, and seawater. Experimental results indicate that CP SAR modes exhibit performance comparable to QP mode. The final classification result includes the influence of feature counts, which is assessed in this study [33], examining the following ML supervised classifiers: SVM, ANN. Polarimetric SAR features enhance oil spill classification accuracy by differentiating mineral oil from biogenic imitations. A 4-feature set is sufficient. SVM outperforms ANN and Maximum likelihood classification when sufficient polarimetric information is available. The efficacy of reliable oil spill detection relies on extracting features from all black areas and the precise differentiation of oil spills from similar substances based on these characteristics. This study [34] outlines the creation of an ANN for classifying oil spills and similar entities using various geometric and radiometric feature vectors. A Sentinel-1 image dataset, including 51 images, including 31 oil spills and 20 analogous scenarios, was utilized for training and assessing the classifier’s performance. An overall accuracy ranging from 90% to 95% was achieved for classification. The work [35] delineates research using an ML dataset to forecast oil spills. The dataset is unbalanced, including 937 instances with 48 attributes: 896 instances are non-oil spills (class 0); whereas 41 instances are oil spills (class 1). Following the execution of Exploratory Data Analysis (EDA) and preprocessing, many classifiers were assessed. The gradient boosting classifier had the greatest accuracy of 98% and was designated as the optimal model for oil spill prediction. Almost all the research on oil spill classification and detection, not on classification standalone for RGB images. Most utilized datasets are SAR-based. In this study, we will utilize an RGB-based oil spill dataset for performing classification. A detailed DL framework for detecting oil spills in Pakistan’s Exclusive Economic Zone has been proposed by Basit et al. (2024), demonstrating its applicability across a multiyear dataset [36]. A new pipeline integrating generative data augmentation with dual attention mechanisms reached a mean Intersection-over-Union of 72.49% in a related study, highlighting the significance of sophisticated data processing in enhancing detection accuracy [37]. Additionally, Sentinel-1 SAR imagery using a hybrid CNN-Vision Transformer model achieved an enhanced F1-score of 78.48%, demonstrating the effectiveness of Transformer integration in remote sensing tasks [38, 39, 40, 41, 42].
Materials and Techniques
This section presents the end-to-end pipeline used for oil spill classification from RGB images. It involves thorough preprocessing methods like normalization, resizing, and augmentation to increase diversity in data. The implemented DL architectures, such as a CNN and an advanced CNN with self-attention modules, were used for the purpose of capturing both local and global characteristics efficiently. Model training, evaluation mechanisms, and architectural designs are also explained to maintain reproducibility and performance clarity. The experimental pipeline is shown in Figure 6.
Dataset Specifications
In this work, we have utilized the Zenodo dataset [39] of RGB images with annotations showing oil spills in a port context. It has three subsets: training, testing, and validation. This is the balanced data set. It is an image-based dataset for the oil spill detection task, as masks are given. However, our aim in this study is to perform a classification task. So, it is customized for oil spill classification, whether an image is an oil spill or a non-oil spill image. This dataset comprises a total of 1268 images of oil spills. So, we have added 1268 images of non-oil spills from different Kaggle datasets [40]. The image count in subsets of the customized dataset is shown specifically in Table 1.
Table 1.
Number of images in the dataset
| No. of Images | Oil Spill | Non-oil spill |
| Train | 811 | 811 |
| Test | 254 | 254 |
| Val | 203 | 203 |
Data Preprocessing
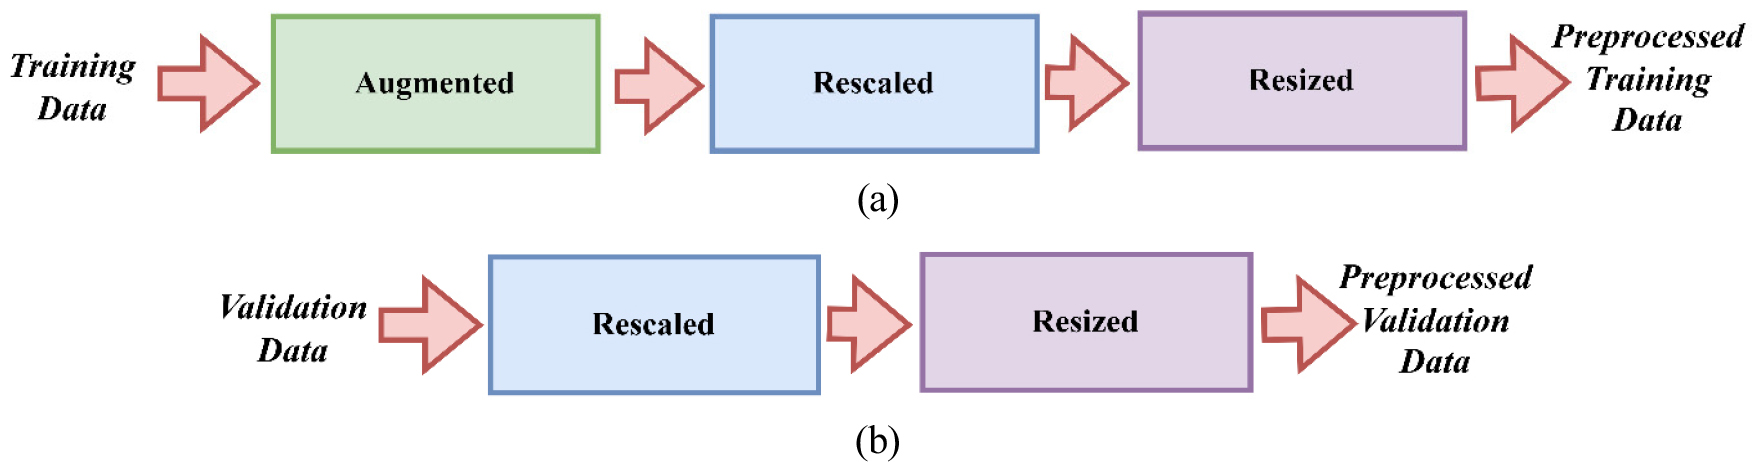
Preprocessing is essential in oil spill categorization since it enables the model to accurately learn features from intricate oil spill patterns while preventing overfitting. Data augmentation enhances the training dataset, allowing the model to accommodate changes in spill configurations, dimensions, and contexts. Normalization enhances convergence and numerical stability while resizing guarantees consistency with the model design. These sequential measures jointly improve the model’s precision, resilience, and capacity to identify oil spills in various contexts.
In this study, the preparation of training data entails normalizing pixel values in the range of [0, 1] by rescaling them using rescale=1./255. Moreover, many data augmentation methods are used to increase dataset variety and mitigate overfitting. This includes random rotations of up to 20 degrees, width and height adjustments of up to 20%, shearing, zooming, and horizontal flipping. This enhancement replicates real-world differences in oil spill images, including changes in angle, size, or viewpoint, hence increasing the model’s robustness. Furthermore, all training pictures are scaled to a uniform dimension of 128x128 pixels to conform to the input specifications of the CNN model. These measures guarantee that the model has various training and comprehensive datasets, enhancing its capacity to generalize well to novel data.
Only normalization and resizing are performed for the validation data. The range of possible pixel values is transformed to [0, 1] to ensure uniformity with the training data, and pictures are shrunk to dimensions of 128x128 pixels. No data augmentation is used since the validation set aims to assess the efficacy of the model on data that closely mirrors real-world settings without synthetic alterations.
Preprocessing steps for training and validation sets are given in Figure 7.
Models Used
This section is divided into further sub-sections for better clarity. Algorithm 1 is mentioned for the oil spill classification scenario as follows:
Algorithm 1.
Oil Spill Classification
CNN
In feature learning, CNNs are the most popular DL models for large-scale image identification and classification [41, 42, 43, 44, 45, 46, 47, 48, 49, 50, 51, 52, 53, 54, 55, 56, 57, 58, 59, 60].
The three layers that comprise a CNN are illustrated in Figure 8. The ReLU activation function and pooling layers are positioned subsequent to the convolutional layers.
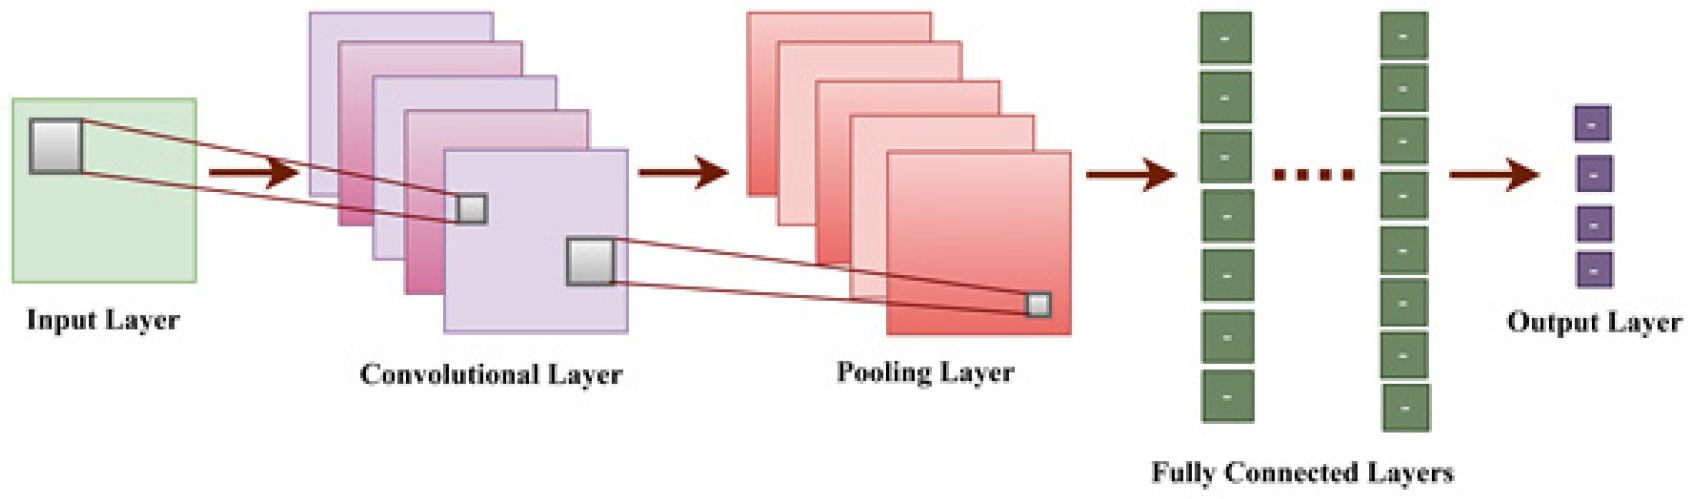
The terminal layers are entirely interconnected, using softmax activation for the classification task, given in equation (1).
Where Xout is the output, X is the input, W is the kernel matrix, and b is the bias vector. The operation ∗ denotes convolution. The Binary Cross-Entropy Loss (BCEL) serves as a fundamental tool for training the machine. It is given in equation (2).
Adam optimizer with learning rate decay is used in this model, given in equation (3).
CNN with self-attention mechanism
CNNs that include self-attention processes have garnered interest for their capacity to comprehend the greater context inside images. The self-acting method enables the model to assess the significance of various aspects within the image throughout the prediction phase. This mechanism makes the model concentrate on critical regions that may signify an oil leak, while also taking into account the broader environmental context. Research indicates that CNNs, including self-attention processes, significantly enhance classification accuracy, particularly in intricate situations.
The self-attention mechanism calculates attention scores that determine which parts of the image should receive more focus. The computation of attention weights is done through equation (4).
Where Q is the query, K is the key, and dk is the dimensionality of the key. Through this technique, the model can prioritize various areas within the input image.
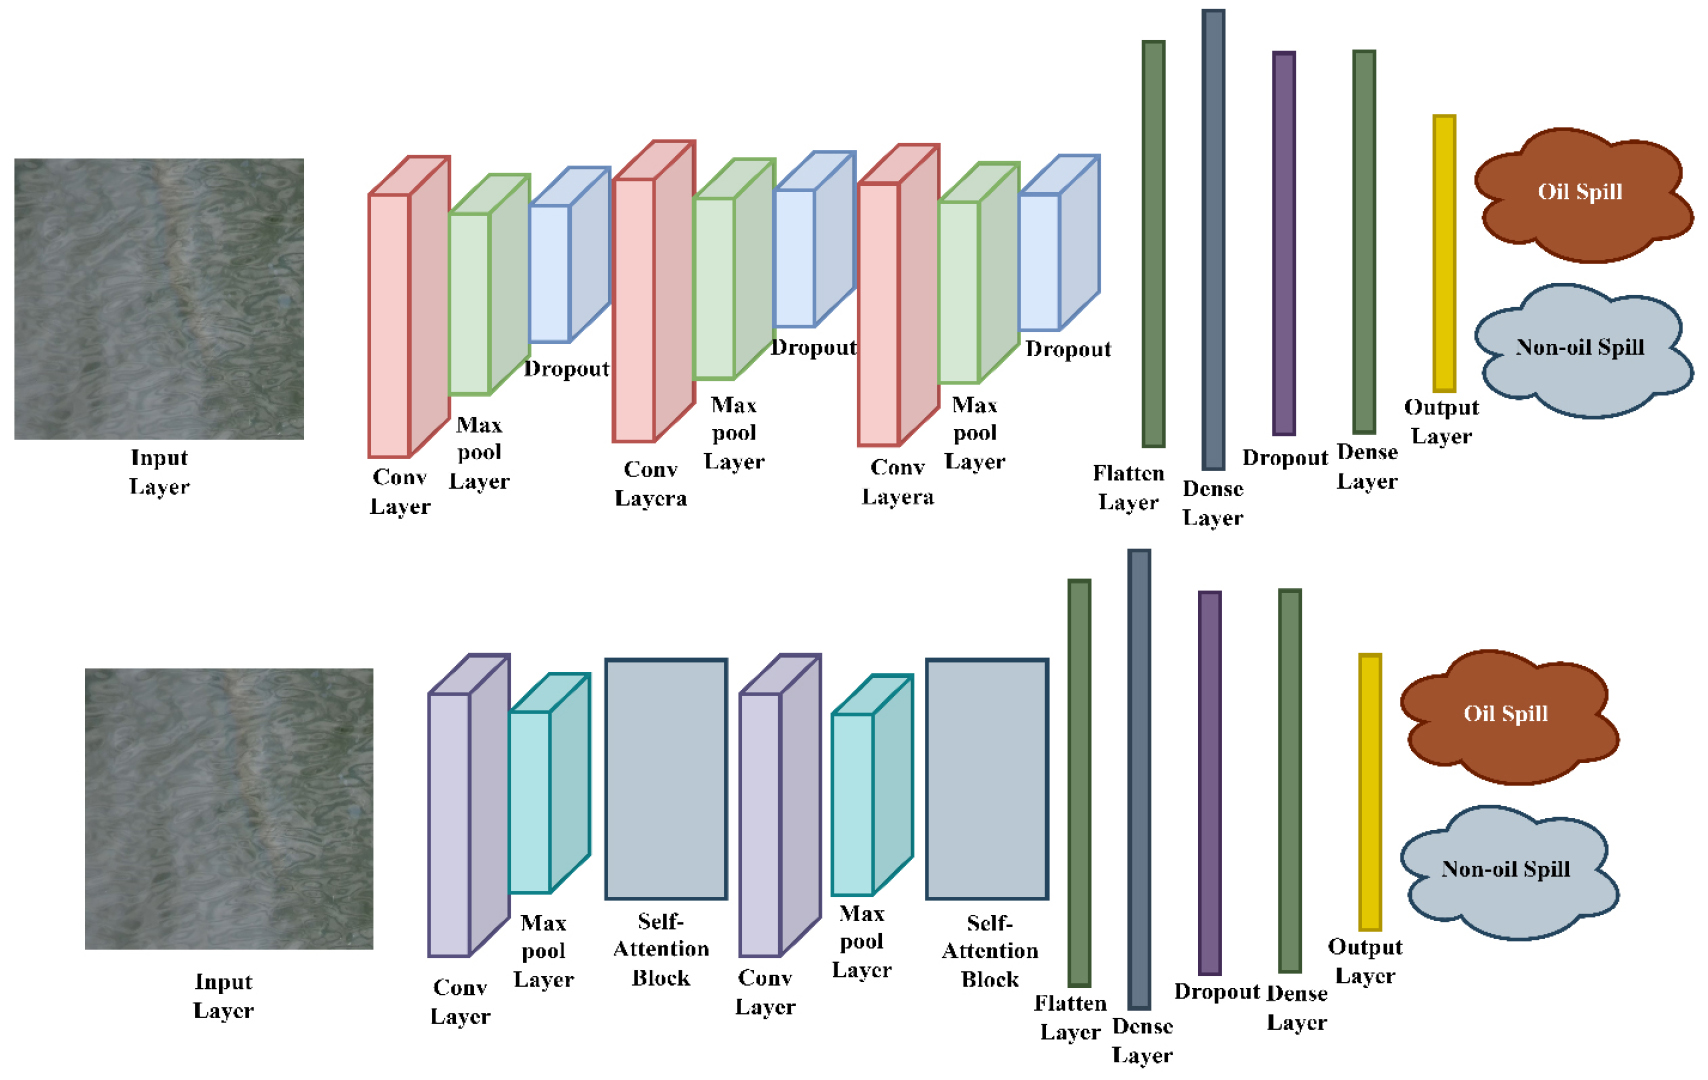
In this work, two DL architectures based on CNNs have been constructed and used to differentiate between images of oil spills and images that don’t show oil spills. The first model is a standard CNN-based structure with several convolutional, max pooling, dropout, and dense layers that work together to find hierarchical spatial features. The second model builds on this structure by adding self-attention blocks between convolutional layers. This lets the network pick up on long-range dependencies and focus on important areas. Both models use dropout to regularize the data and end with fully connected layers that give a binary output. Adding attention mechanisms to the second model showed that it learned features better and made more accurate classifications. Table 2 summarizes the features of these implemented models. Figure 9 displays the architectures of the implemented models.
Table 2.
Architectural analysis of implemented Models
Experimental Setup
This study uses Google Colab to develop the oil spill classification model, which uses Tensor Processing Unit (TPU) acceleration to speed up computations. Using these high-performance hardware options, the model can handle huge datasets effectively and significantly reduce the training time. TensorFlow is the main library used to build and train the model, along with Keras to develop the CNN architecture and self-attention module. Data processing, visualization, and performance evaluation — including metrics such as ROC curves and classification reports — are accomplished with the help of additional libraries such as sci-kit-learn, matplotlib, and NumPy. To test the stability and flexibility of the model, we train it for 20 epochs in each run and then repeat the process four times. For training and validation, a batch size of 32 is used, which provides a good compromise between computational efficiency and the quality of gradient estimates. Three subsets make up the dataset. This model configuration is tested on new data, giving a reliable indication of its generalization ability.
To comprehensively analyze the efficacy of the presented models, we used metrics such as accuracy, precision, recall, F1-score, and AUC to assess their performance. The selected metrics thoroughly assess overall classification effectiveness and the equilibrium between false positives and false negatives, which is vital in oil spill detection, since misclassification may result in significant ecological and economic repercussions.
Both models, CNN and CNN with the self-attention mechanism, are assessed using ROC curves, Recall (5), Precision (6), F1-Score (7), and Accuracy (8).
The integration of the self-attention mechanism inside the CNN model has resulted in significant improvements across all assessment measures. The CNN + Self-Attention model exhibits substantial improvements, attaining superior accuracy, recall, and F1 scores for both classes relative to the baseline CNN. This signifies a well-balanced performance and improved capacity to accurately categorize both oil spill and non-oil spill images. The total accuracy has increased from 66% to 99%, demonstrating the self-attention module’s efficacy in capturing global relationships and enhancing the model’s comprehension of intricate patterns within the dataset. All these parameters obtained are given in Table 3.
Table 3.
Performance Metrics and Insights: CNN vs. CNN + Self-Attention
Findings and Analysis
Several performance measures are employed to measure the efficacy of the CNN model and the CNN with the self-attention mechanism. Common metrics include precision, recall, and F1 score. Precision measures how many images were classified correctly. The precision indicates the proportion of oil spills identified correctly among all the spills identified. The recall shows how many real oil spills were detected correctly. One metric that includes both recall and precision is the F1 score, which facilitates the understanding of the general performance of the models.
Results for oil spill classification using CNN
Figure 10 displays the performance for the CNNs training and validation, demonstrating a sharp rise in training and validation accuracy throughout the early epochs. Both accuracy trajectories converge and stabilize at 1.0 as training advances, suggesting that the underlying patterns in the dataset have been successfully learned. The model’s close alignment of the training and validation accuracy curves indicates minimal overfitting, indicating good generalization to unseen validation data.
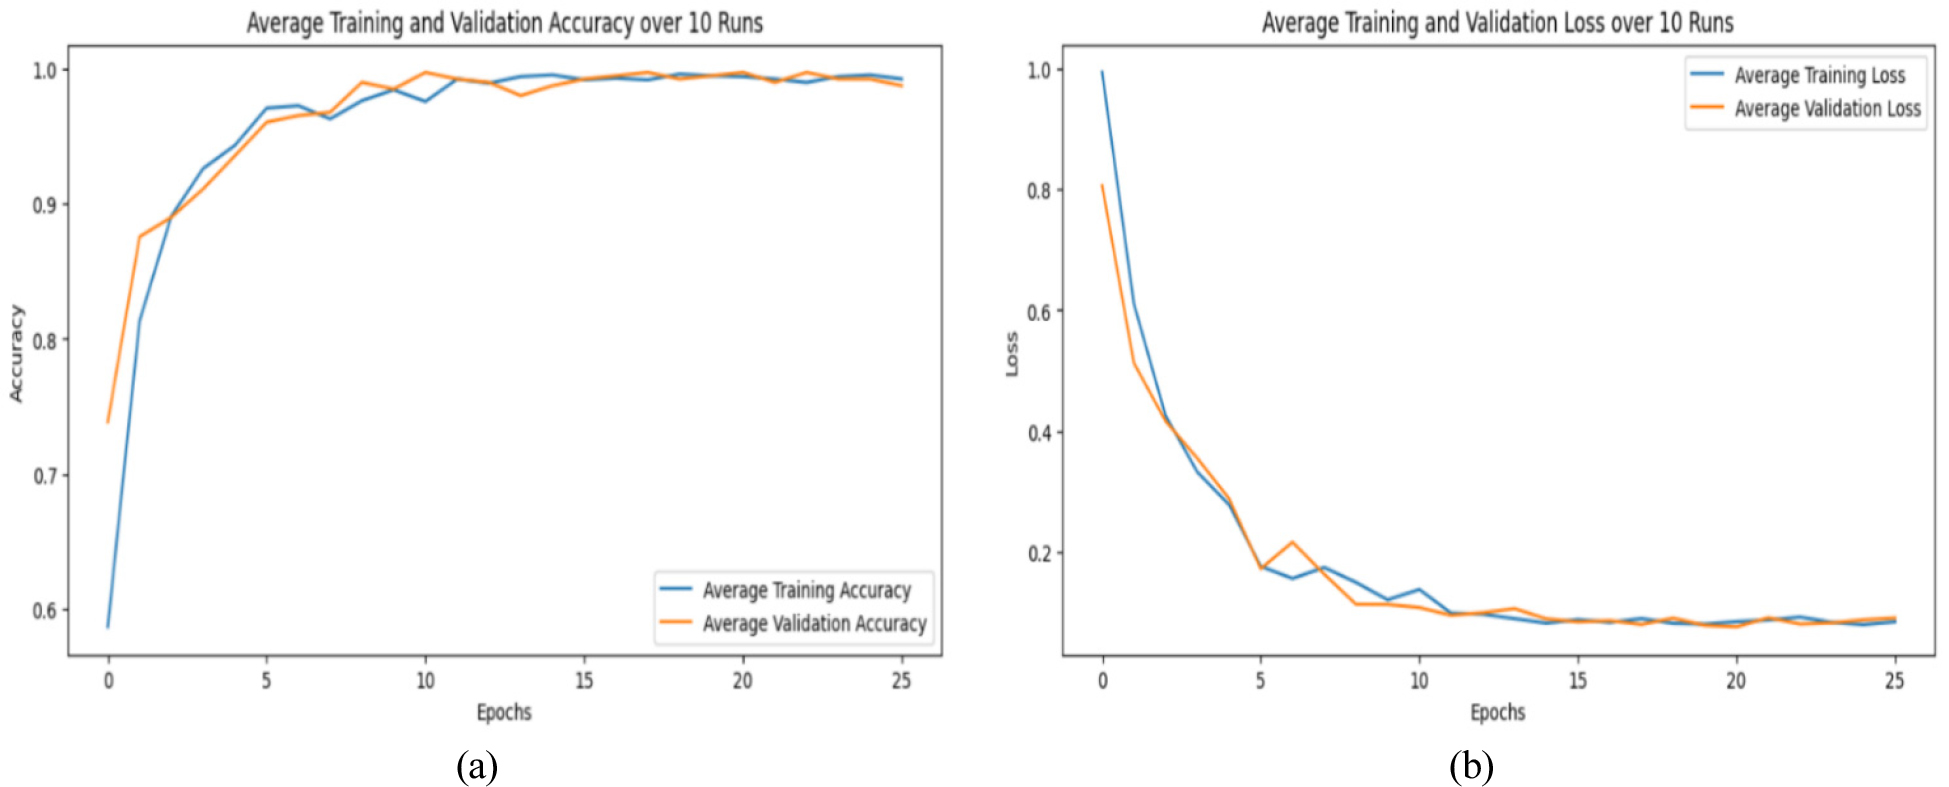
The loss plot illustrates a significant reduction in both training and validation during the early epochs, suggesting efficacy in parameter optimization. As training advances, loss values decrease and stabilize at a low level, indicating the model’s optimal state with minimal prediction errors. The model demonstrates no overfitting since the validation loss does not indicate a substantial increase after an initial decline. The results demonstrate that the training process was well administered, and the chosen hyperparameters promoted efficient convergence. The model achieves high accuracy with little loss, demonstrating strong generalization capability on the validation dataset.
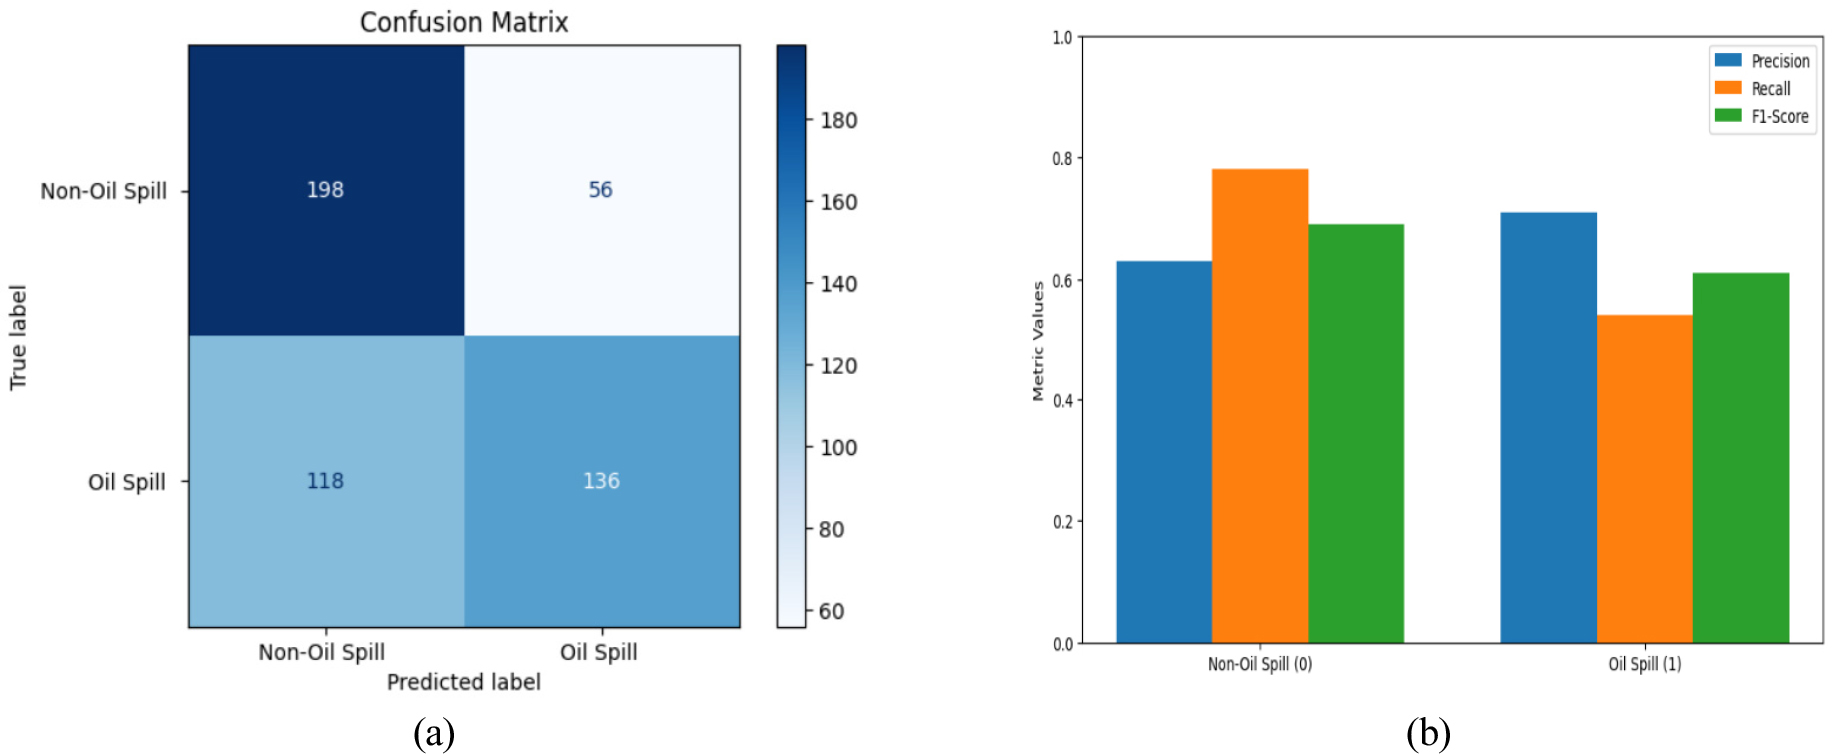
In addition, the confusion matrix and the ROC curve are used in order to evaluate the effectiveness of the classification model. Figure 11(a) displays the confusion matrix for model CNNs, which indicates that the model accurately identified 198 non-oil spill images as non-oil spills (true negatives). 136 oil spill images as oil spills (true positives). 56 non-oil spill images were erroneously identified as oil spills (false positives), whereas 118 images of class belonging to oil spills were incorrectly classified as non-oil spills (false negatives). The model attained an accuracy of 0.63, a recall of 0.78, and an F1-score of 0.69 for non-oil spills, but for oil spills, the precision, recall, and F1-score were 0.71, 0.54, and 0.61, respectively. The overall accuracy achieved by a CNN model is 66%, with macro-averaged precision, recall, and F1-score values of 0.67, 0.66, and 0.65, respectively, shown in Figure 11(b). The findings reveal that the model excels in recognizing non-oil spills, evidenced by the superior recall for this category.
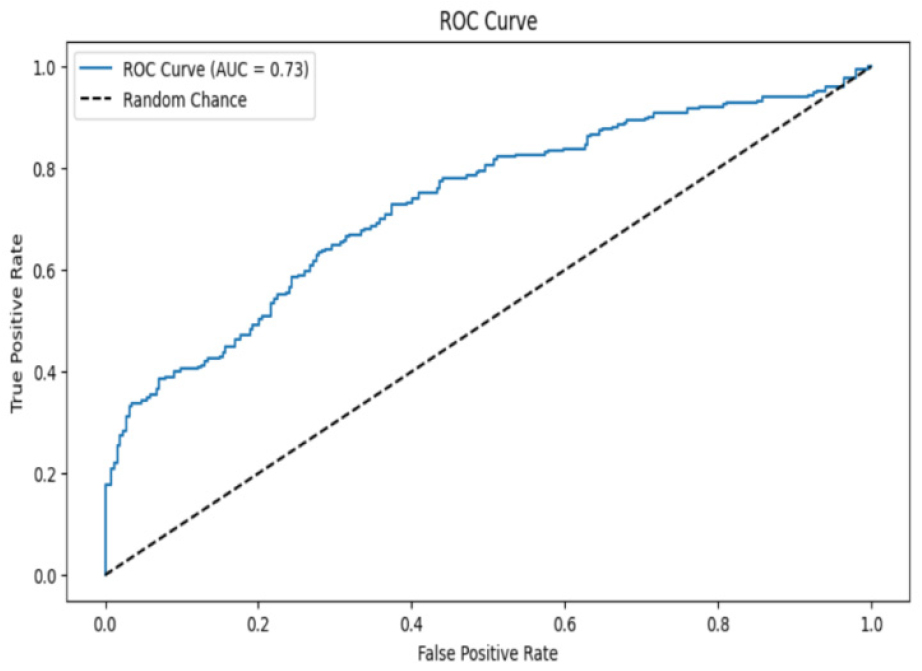
The CNN model’s ROC curve is shown in Figure 12, which balances sensitivity and specificity, as evidenced by an AUC score of 0.73 for moderate discriminating skills. While the convex shape implies that the performance is well-balanced across decision thresholds, improvements in feature extraction or threshold modification may improve the precision-recall balance.
Results for oil spill classification using CNN with self-attention mechanism
By using attention mechanisms, neural networks can enhance their data processing and understanding capabilities by simulating human-like selective concentration. The plots show how well a CNN with a self-attention mechanism can classify oil spills. Figure 13(a) illustrates that both training and validation accuracy consistently improve over epochs, providing evidence of successful learning and generalization by the model.
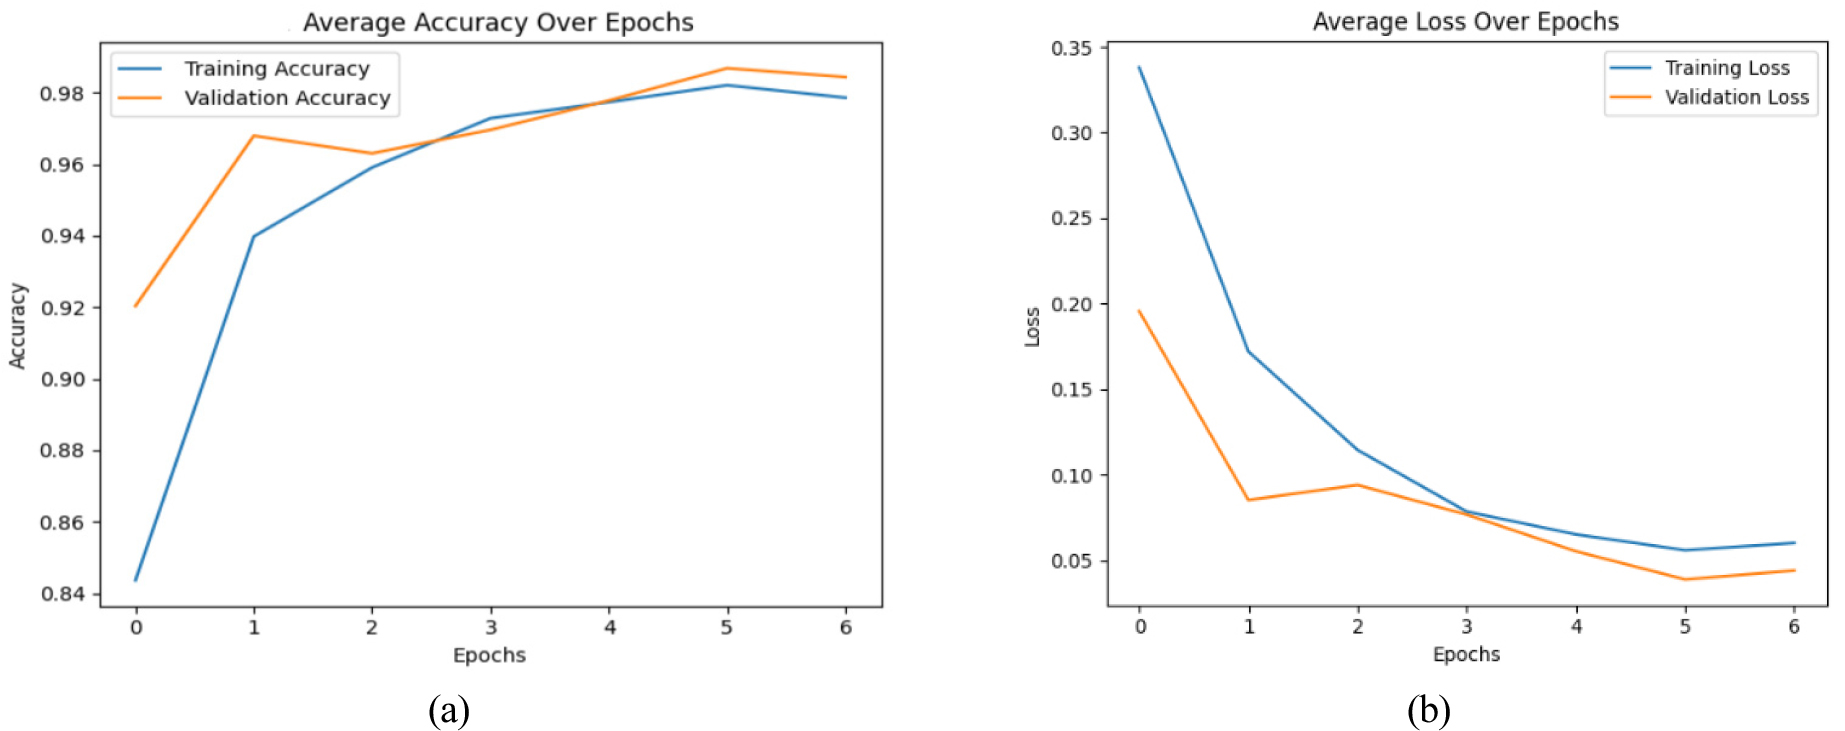
The loss plot 13 (b) shows that both training and validation loss steadily decrease, which means that the model can minimize errors and speed up convergence. The small gap between the training and validation loss suggests that the model has a lower probability of overfitting and performs well.
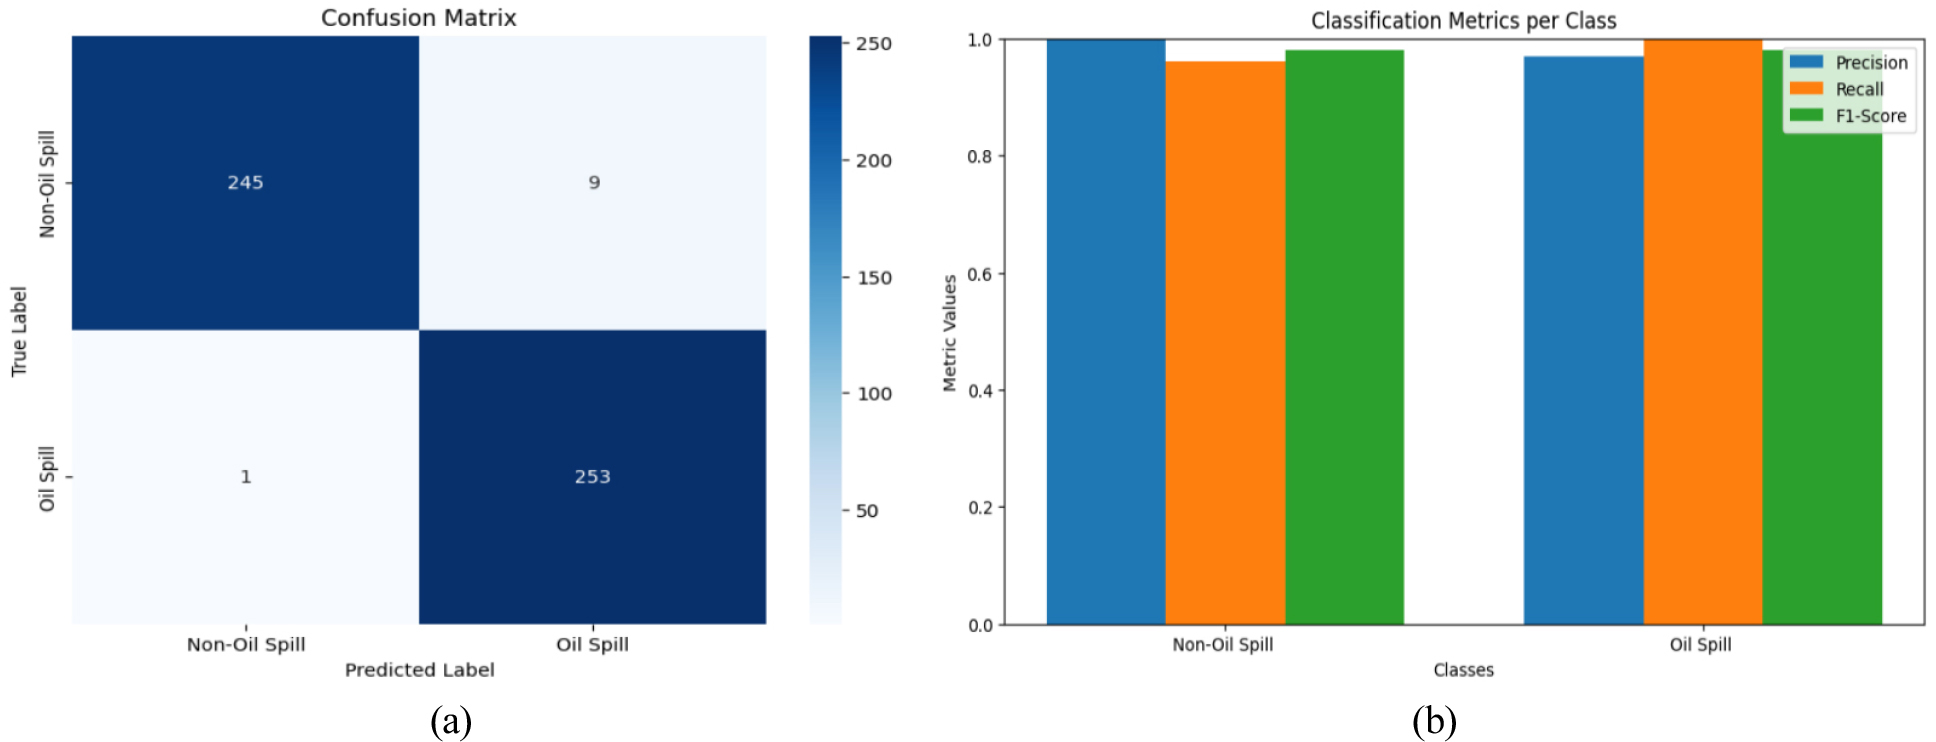
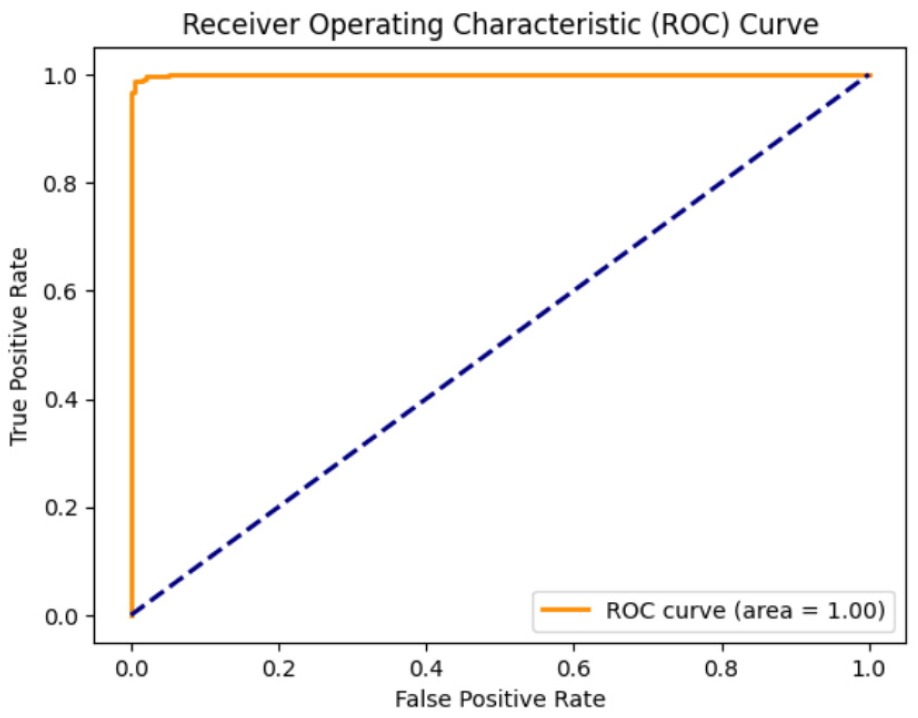
The indication of accurate classification lies in the high diagonal dominance in the CNN model’s confusion matrix, which is caused by the self-attention process, shown in Figure 14(a). The consistently high precision, recall, and F1-score values shown in Figure 14(b) explain that the model does a good job of minimizing false alarms while accurately identifying and labeling positive events. An analysis of the ROC curve contrasts the rates of true positives and false positives for different classification levels. With a completely accurate detection rate and a minimal margin of error of 0% across all thresholds, an AUC of 1.0 indicates perfect discrimination. This curve, shown in Figure 15, explains that the model is flexible, keeping the false alarm rate low while keeping the positive class identification rate high.
Conclusion
This study proposed and assessed two methods for classifying oil spills: a traditional CNN and a CNN augmented with a self-attention mechanism. The results indicate that the self-attention-enhanced CNN outperforms the traditional CNN, particularly in challenging scenarios where distinguishing oil spills is difficult. The findings emphasize the potential for improving DL efficacy in environmental monitoring tasks through the incorporation of self-attention mechanisms, especially in the context of multi-source datasets.
Future studies will focus on expanding the dataset with multi-sensor imagery, including SAR and RGB data, to improve model generalization. To enhance detection accuracy further, advanced hybrid DL architectures will be explored. Finally, to facilitate timely environmental responses, the development of real-time oil spill monitoring systems will be analyzed.
