

Introduction
Objective and Methodology
Reference Tool
Indicators for Vitória’s Smart Assessment
Selection of Indicators
Criteria for assigning weights to the indicators
Assigning weights to the indicators
Final Considerations
Introduction
In 2007, the world’s urban population surpassed the rural population for the first time in history. Currently, 54% of the world population live in urban areas, and the forecast is that by 2050 this figure will reach 66% - approximately 6.2 billion people. In Brazil, the urbanization rate is even higher. Currently, 85% of the Brazilian population lives in cities, and it is estimated that by 2050 this figure will reach 91% (United Nations 2015).
Increasing urbanization inflicts obstacles to cities, as it contributes for the emergence of infrastructure, mobility, and environmental problems, and consequently affect the quality of life of the population. In this context, the Smart City concept arises, as an urban planning model aimed at the development of cities through a combination of human and technology capital (Angelidou 2014).
Although there is no consensus about its definition, it is widely held that Smart Cities are characterized by the use of digital technologies - Information and Communication Technologies (ICT) -, in order to help cities to make better use of its resources (Neirotti et al. 2014). However, despite the importance of technology, there is a need for investment in human capital for the development of an efficient strategy for Smart Cities. (Angelidou 2015; Monfaredzadeh & Krueger 2015).
The adopted Smart City concept is based on Caragliu et al. (2011), who state that a city is considered to be smart “when investments in human and social capital and traditional (transport) and modern (ICT) communication infrastructure fuel sustainable economic growth and a high quality of life, with a wise management of natural resources, through participatory governance”.
According to Neirotti et al. (2014) there is some difficulty in establishing worldwide definitions and trends for Smart Cities, since the initiatives are implemented under different contexts and realities. The Smart indicators of the cities should consider specific variables that capture particular characteristics, such as local culture, political leadership, population density, economic development and climate conditions.
Therefore, it is noteworthy that each city faces specific challenges, therefore its Smart indicators must be particularized. In this context, the focus of this research is on the city of Vitória, Espírito Santo, Brazil. The choice of this subject matter is because this municipality has a 100% urbanised territory (Oliveira et al. 2014), and the highest population density of the state, with more than 3,000 inhabitants/km² (Miranda et al. 2014).
Objective and Methodology
This study aimed to select and assign weights to assessment indicators for Vitória, according to the Smart City concept. This set of indicators should measure the city’s progress and be periodically updated. Thus, it is assumed that it is possible to evaluate Vitória’s evolution in relation to the selected indicators, by providing data to the government assisting the development of specific policies and guiding investments. It is therefore expected that the local population be positively affected, since the Smart City attributes are aimed at sustainable development and the improvement of the population quality of life.
In order to achieve this goal, the research was developed in three main stages. The initial stage consisted of a literature review, to understand the Smart City concept, identify existing assessment tools and establish the state of the art theme. Research was conducted in academic journals, reports published by universities and governmental entities, and in websites that offer Smart City and sustainable urbanism assessment tools. In the second stage of the research, an assessment tool was selected, based on specific criteria, which served as reference for the choice of indicators for Vitória. The selected tool was thoroughly studied, seeking a clear understanding of its conceptual guidelines, specific goals and methodologies associated with the indicators. In the third stage, the reference tool indicators were selected, based on suitability, clarity and availability criteria. Then, weights were assigned to the selected indicators, judging their relevance based on their compliance with the strategic goals of the city. Finally, considerations were made regarding the current stage of the research and its continuity.
Reference Tool
There is currently no unanimity on a methodology or indicators to assess a city in relation to the Smart City concept. There are few specific tools for this type of assessment, and they are usually linked to the companies and events of this field. However, the tools for evaluating sustainability, because they aim for sustainable urban development, are compatible with the Smart City concepts, and can be used for this purpose with few adaptations.
In order to select the reference tool for choosing Vitória’s indicators, the main urban area assessment systems were identified, specific for Smart Cities or related to the sustainability concept. The analysed evaluation and certification systems were: AQUA Bairros e loteamentos (neighbourhoods and housing developments) (Fundação Carlos Alberto Vanzolini 2011), Connected Smart Cities (Urban Systems 2015), BREEAM Communities (BRE 2016), CASBEE for Cities (JSBC 2012), European Smart Cities (Giffinger et al. 2007), HQE Urban Planning and Development (HQE 2015), Green Star Communities (GBCA 2015) and LEED Neighborhood Development (USGBC 2011).
The score was given by evaluating the relevance of the criteria for the research and suitability of the tool to the criterion. For each tool, the values assigned to the evaluated items were added up, and the one with the highest score was selected as reference for the research, according to Table 1.
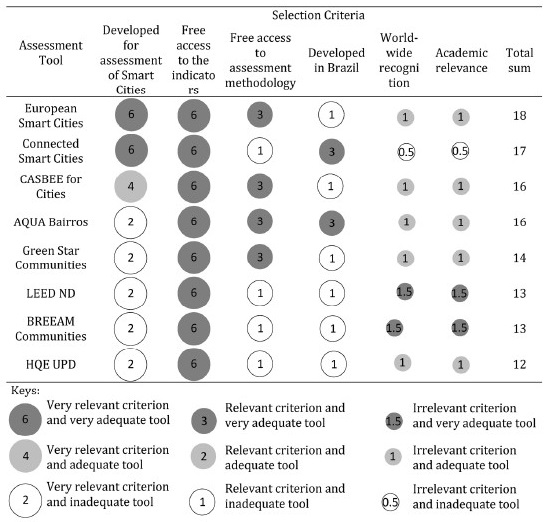
The tool European Smart Cities, used as a basis for the development of this research, was created in order to assess European medium-sized cities, with populations between 100,000 and 500,000 people, comparing them and identifying their strengths and weaknesses. To develop the assessment system, six key features of Smart Cities were identified: economy, people, governance, mobility, environment and living (Giffinger et al. 2007).
This research was based on the first developed version of the tool European Smart Cities, released in 2007. Six key features are presented, divided into 31 factors, for a total of 74 indicators. According to Giffinger et al. (2007), the data were obtained from free public access databases.
According to Giffinger et al. (2007), the indicators have their values standardised by z-transform, according to Equation 1, with 0 mean and positive or negative deviation equal to 1. The score of each domain is given by the simple average of the corresponding indicators. The same goes for the key features, obtained by the simple average of the domains. Thus, the indicators have equal weights.

were  indicator data for the assessed city;
  indicator average considering all assessed cities; and
  standard deviation.
Indicators for Vitória’s Smart Assessment
Selection of Indicators
The tool European Smart Cities was used as a source for the acquisition of indicators for Vitória’s Smart assessment. Each item proposed by the structure was analysed according to the following criteria:
・Suitability - considers whether the indicator is adequate to assess Vitória;
・Clarity - evaluates whether the purpose of the indicator or data related to its acquisition is understandable;
・Availability - amongst the defined research sources - IBGE and City of Vitória websites - it identifies if there are similar available data.
The criteria for exclusion of items was the negative response to at least one of the three conditions above. Thus, from the 74 analysed indicators, 35 of them were excluded. Among the excluded indicators, it is noteworthy that about 63% received a negative response only to the data availability criterion, which was the main cause of exclusion of indicators. The exclusion of items does not mean that they do not contribute to the assessment of Smart Cities, but rather that they are not fit for the assessment of the local reality, that they are not clear as to how or what they intend to evaluate, or that the data are not available, hindering the subsequent application of the tool.
Criteria for assigning weights to the indicators
After the selection of indicators for Vitória, it was deemed necessary to assign weights in order to provide a hierarchical reading of the items, facilitating the analysis in investment decisions. The proposed system classifies each indicator according to its relevance, which is based on the relationship with the strategies presented in the 2008-2028 Agenda of the City of Vitória. Each indicator is evaluated under the perspective of the Agenda themes, and its relevance is judged based on the type of relationship they establish with them, whether direct or partial.
Vitória 2008/2028 Agenda
The choice of the Vitória 2008/2028 Agenda as a base in the process of assigning weights to the indicators is based on the fact that the document proposes strategic goals in line with the local reality. Shen et al. (2010) argue that the challenges are more easily recognised at the city level, as well as the development of strategies for the development of the city.
The Agenda is the third revision of the strategic plan drawn up according to the 1992 Rio Summit, and it was developed by a multidisciplinary technical team and representatives from various social sectors of the city. The population participated in the Agenda development through debates in seminars and surveys, signalling their main demands and expectations to the City. The strategy is based on three main themes that steered the plan’s guidelines (Agenda Vitória):
・Economy - involves issues related to the dynamics of labour and production, productive investments, Science and technology, innovation, workforce qualification, specialized activities, labour market, ports and airports;
・Urban-Environmental- prioritizes issues related to the environment and urban infrastructure, such as mobility, sanitation, housing, clean energy and urban planning legislation;
・Sociocultural - addresses areas related to citizenship, human rights, social welfare, culture, education, health, security, employment and income and population dynamics.
Assigning weights to the indicators
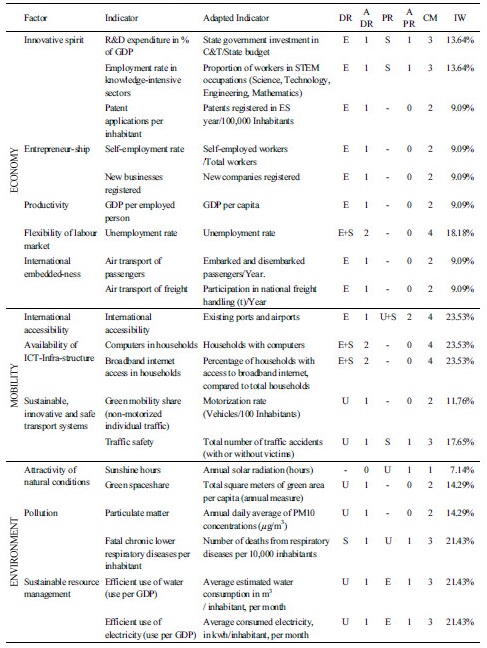
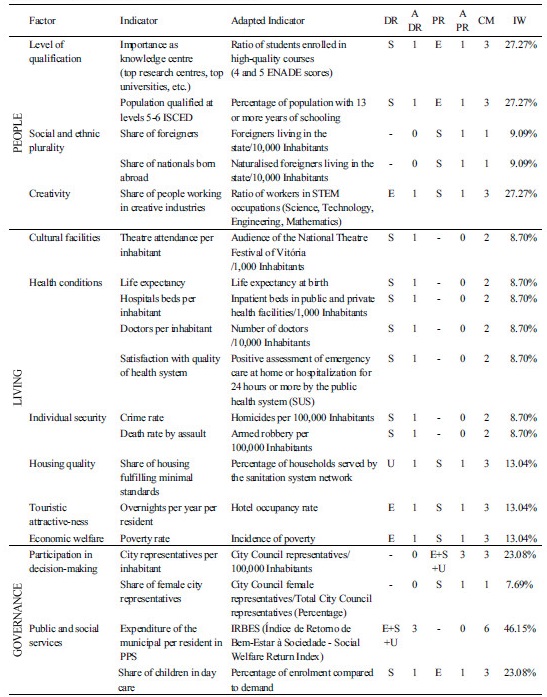
Considering the above-mentioned criteria, weights were assigned to the indicators (Tab. 2). First, we evaluated the relationship of each indicator with the Vitória 2008-2028 Agenda themes, considering its direct or partial affinity (Equ. 2). Then, its weight was calculated in contribution percentage for the scoring of each key feature (Equ. 3).

where  sum of the amount of themes directly related to indicator i;
  sum of the amount of themes partially related to indicator i.

where  = sum of CM of all indicators of the key feature.
Final Considerations
This article, by choosing specific indicators for Vitória, is the first step to develop an assessment tool for the city under the Smart City concept. It aimed to outline the city profile, in order to diagnose its situation, and later compare it with other cities to obtain information through benchmarking and support government policy makers.
The development of a consistent assessment tool requires the selection of relevant indicators, aligned with the defined goals and targets (Hák et al. 2015). Amid a large number of indicators, it is assumed that the first step in the development of the assessment framework is to define the city’s strategy, in accordance with the adopted concept of Smart City and Sustainable Development Goals. The importance of defining city level strategies is stressed, due to the relevance of local characteristics and challenges (Shen at al. 2010). The Vitória Agenda defines the strategy at the local level and displays important diagnostics and considerations. However, it is not clear as to setting goals and targets to be achieved, hindering the selection of indicators.
The strategic themes of the Vitória Agenda were the basis for assigning weights to the selected indicators. The indicator that stands out with the highest relative weight in the context of its category (Governance dimension), is the Social Welfare Return Index (Índice de Retorno de Bem-Estar à Sociedade - IRBES), with 46.15%, which compares the tax burden to the Human Development Index (HDI), and thus is directly related to the three strategic themes of the Agenda. Next, with the relative weight of 27.27%, are the indicators Ratio of Students Enrolled in High Quality Courses, Percentage of Population with 13 or More Years of Schooling, and Ratio of Workers in STEM Occupations, components of the People dimension. The high weight assigned to the indicator IRBES may have occurred because the Governance dimension has a lower amount of items when compared to the others. Thus, for a proper assessment, the need to add new indicators to this dimension is clear, in order to achieve a better balance in the allocation of weights.
The main challenge of the research was the access to reliable information, especially at the local level. In some cases, the use of the metropolitan region or state data was accepted, in order to not hinder the work, since the percentage of excluded items for lack of similar data was high (63%). The data sources used for this research are public databases, and their publication, in general, does not occur on an annual basis, which also makes it difficult to obtain updated data.
By analysing the proposed indicators for the European medium-sized cities, the authors emphasise the difference between their development levels compared to the Brazilian cities. The tool used as reference does not address issues that correspond to recurring problems in Brazil, such as illiteracy and infant mortality. Thus, the need to continue the research is realised, in order to, once again, supplement the list of indicators with new items according to the local reality, grounded on other existing assessment tools.
